Quantification and speciation of mercury in soils from the Tripuı´
Ecological Station, Minas Gerais, Brazil
Helena E.L. Palmieri
a,*, Hermı´nio A. Nalini Jr.
b, Liliam V. Leonel
a,
Cla´udia C. Windmo¨ller
c, Regis C. Santos
a, Walter de Brito
aa
Nuclear Technology Development Centre/National Commission for Nuclear Energy, Caixa Postal 941, Belo Horizonte, Minas Gerais, Brazil
bFederal University of Ouro Preto, Geological Department, Morro do Cruzeiro, s/n, Ouro Preto, Minas Gerais, Brazil cFederal University of Minas Gerais, ICEx, Chemistry Department, Antonio Carlos av., 6627, Belo Horizonte, Minas Gerais, Brazil
Received 15 October 2004; received in revised form 12 May 2005; accepted 26 September 2005 Available online 27 December 2005
Abstract
Contents of total mercury, organic carbon, total sulfur, iron, aluminum and grain size and clay mineralogy were used along with Pearson’s correlation and Hg thermal desorption technique to investigate the presence, distribution and binding behavior of Hg in soils from three depths from the Tripuı´ Ecological Station, located near Ouro Preto, Minas Gerais State, Brazil. The soils studied had predominantly medium and fine sand texture (0.59–0.062 mm), acid character and Hg contents ranging from 0.09 to 1.23Ag/g. The granulometric distribution revealed that Hg is associated with coarse sand (2–0.59 mm) and silt and clay (b0.062 mm) and presents similar Hg concentrations in both fractions. Mercury distribution in soil profiles showed that Hg was homogeneously distributed throughout the depths at most sites. Hg thermal desorption curves show that mercury occurs not only as Hg2+ predominantly bound to organic components in most of the samples, but also in the form of cinnabar in some. Pearson’s correlation confirmed that mercury is associated with organic matter and sulfur and possibly with sulfur-bearing organic matter in most samples.
D2005 Elsevier B.V. All rights reserved.
Keywords:Mercury; Soils; Tripuı´ Ecological Station; CVAAS; Hg thermal desorption
1. Introduction
For decades, the Tripuı´ Ecological Station (TES) has been the object of interest of many studies due to its historical, ecological, and environmental importance. It was turned into an ecological station in 1981 due to the discovery of the invertebrate,Peripatus acacioi, a
prob-able ancestor of annelids and arthropods (Guimara˜es
Neto, 1999) in 1954. It lies in Quadrila´tero Ferrı´fero, a
region of rudimentary gold mining in the late 17th century (Eschewge, 1979; Guimara˜es Neto, 1999). Even though there is no evidence that gold miners might have used Au–Hg amalgamation in the TES area (Busher, 1992), mercury was found in sediments and some plant species as reported by Cruz (2002),
Busher (1992)andPalmieri et al. (2003).
Mercury occurs on Earth’s crust as more than 20 minerals. Cinnabar (HgS) and the free mercury (Hg0) are the main natural mercury sources found in soils and aquatic environments (Salomons et al., 1995). Due to
0048-9697/$ - see front matterD2005 Elsevier B.V. All rights reserved. doi:10.1016/j.scitotenv.2005.09.085
* Corresponding author. Centro de Desenvolvimento da Tecnologia Nuclear, Servic¸o de Quı´mica e Radioquı´mica, Caixa Postal 941 CEP-30.123-970 Belo Horizonte, Minas Gerais, Brazil. Tel.: +55 31 3499 3181; fax: +55 31 3499 3550.
E-mail address: [email protected] (H.E.L. Palmieri).
Science of the Total Environment 368 (2006) 69 – 78
the extremely low solubility of HgS (10 54mol dm 3), it has fundamental importance in the immobilization of Hg under low oxygenation and in slightly oxidant-to-reducing environmental conditions. However, under altered conditions, it may become soluble (Moore and
Ramamoorthy, 1984).
Depending on redox conditions, inorganic Hg may occur in three different states, Hg22+, Hg0, and Hg2+.
The last two are normally found in soil. pH and Cl 1 concentration are also key parameters in determining the speciation and the chemical transformations of mer-cury in soil solution. Due to the large susceptibility of Hg2+to form complexes, only a minute fraction of this ion occurs in soil solution. The major fraction is either bound to soil minerals or adsorbed onto solid inorganic and organic surfaces (Steinnes, 1995).
Anderson (1979) demonstrated a close correlation
between Hg and organic matter in acid soils, whereas in slightly acid and neutral soils (pHN6), the co-variation
between Hg and Fe was stronger than that between Hg and organic matter. The formation of organic Hg com-plexes is largely due to the affinity of Hg2+ and its inorganic compounds for sulfur-containing functional groups (Shuster, 1991; Xia et al., 1999).
Due to the high affinity of Hg for organic matter and minerals, soil Hg leaching rates are very low and are mostly associated with dissolved organic matter
(Anderson, 1979; Shuster, 1991; Mierle and Ingram,
1991).
The determination of Hg by thermal desorption/ atomic absorption technique was initially applied in geochemical prospection (Azzaria and Webber, 1969), and in recent years, it has proved to be useful to distinguish different Hg-binding forms (Hg phases) by their thermal release characteristics (Windmo¨ller et al.,
1996; Biester et al., 2000; Higueras et al., 2003).
The aim of this work was to investigate the presence, distribution and binding behavior of Hg in soil samples collected at three depths on the banks of the main streams and near a pond in TES. Total Hg was deter-mined by cold vapor atomic absorption spectrometry (CVAAS) and Hg phases were determined by thermal desorption atomic absorption spectrometry (TDAAS). Factors that govern the mobility of mercury such as organic carbon, pH, total sulfur, iron and aluminum contents and clay mineralogy were also examined.
2. Study area
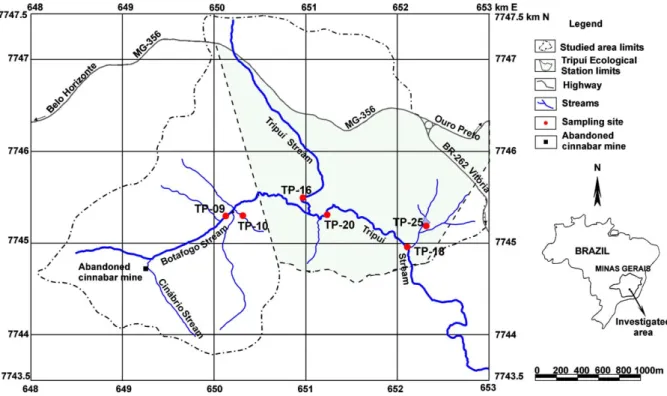
The area studied lies between UTM coordinatesb23 K; 648000/653000 E and 7743500/7747500 NQ and comprises an area of approximately 7 km2. The Tripuı´ Ecological Station (TES) (Fig. 1) has an area of 3.37 km2and is located in the Tripuı´ Stream valley, about 3
km away from Ouro Preto City. One of the main tributaries of Tripuı´ Stream, Botafogo Stream, flows fast and its riversides present dense vegetation. It meets the Cina´brio Stream at its source, which drains the surroundings of an abandoned cinnabar mine.
3. Methods
3.1. Sample collection and grain size fractionation
Soil samples were collected on stream banks in February 2003 at the following sites: TP-09 (Botafogo Stream), TP-10 (a tributary of Botafogo Stream), TP-16 (Tripuı´ Stream upstream its confluence with Botafogo Stream), TP-18 and TP-20 (Tripuı´ Stream downstream its confluence with Botafogo Stream), TP-25 (Fortes pond shore). One track sediment sample (SDT) was also collected at TP-09. Sampling sites are shown in
Fig. 1, and sample identifications are given inTable 1.
Approximately 0.5 kg of soil was collected at three different depths, 30, 60 and 90 cm, at all sampling sites using a deep sampling handle (JMC back-saver handle). Samples were kept in polyethylene bags and air dried and fractionated in laboratory by sieving in three grain sizes (2–0.59 mm, 0.59–0.062 mm, and
b0.062 mm) to determine the relation between particle
size and Hg retention. Each fraction was weighed and the percent weight of the each fraction was calculated
(Table 1).
3.2. Analytical techniques
To determine total mercury, 0.20–0.30 g of soil samples was digested with a mixture of HNO3/H2SO4
(1:2, v/v), potassium permanganate, potassium persul-fate in a closed Teflon vessel (22 ml) at 758C for 16 h. Before analysis, hydroxylamine hydrochloride was added to reduce excess permanganate, and the sample was diluted to 50 ml with deionized water. Total mer-cury was determined by CVAAS using a Perkin Elmer flow-injection mercury system, FIMS 400 (detection limit of 5 ng/g). Standard reference material 2709, San Joaquim soil 1.40F0.08Ag/g Hg from the Nation-al Institute of Standards and Technology (NIST), USA and GBW 07404 0.590F0.034 Ag/g Hg from the National Research Center, China, were used to evaluate the analytical accuracy within 5%. The concentrations measured were 1.32F0.14Ag/g Hg and 0.60F0.07Ag/ g Hg, dry weight, with recovery rates of 94% and 102%, respectively. Moisture was determined by weight loss in a separate sub-sample by drying at 110 8C for 2 h.
For pH determination, dry soil was mixed with 1– 2.5-fold its water weight and shaken. Measurement was carried out in the supernatant solution 60 min after preparation using Metrohm 744 pH meter.
Determination of Hg phases by solid-phase Hg ther-mal desorption is based on the specific therther-mal desorp-tion or decomposidesorp-tion of Hg compounds from solids at different temperatures. Hg thermal desorption curves (TDCs) were obtained according to Windmo¨ller et al.
(1996). The system consists of an electronically
con-trolled heating unit and an Hg detection unit. The samples (masses varying from 500 to 3000 mg) were heated at a rate of 338C/min from room temperature to 5708C. A constant nitrogen flow (200 ml/min) passed through the samples carried thermodesorbed vapors to the detection cell of an atomic absorption spectrometer (GBC 932-AA). Mercury was detected at 253.7 nm. Interference, mainly from pyrolytic organic matter, was compensated by continuous deuterium background cor-rection. The Hg TDC shows the release of Hg0 vs. temperature.
Mercuric sulfide red (99%, Fluka) and cinnabar found in the region studied were used as standards for Hg thermal desorption curve of synthetic red cinnabar (HgS) and natural red cinnabar. Standard materials were prepared by solid dilution with quartz powder. Standard
Hg0 (Raposo et al., 2003) and standard Hg in humic
acid (Valle, 2005) were obtained through the same thermal desorption/atomic absorption system and under the same work conditions.
The level of organic matter in soils was assessed by measuring organic carbon in all samples. Organic car-bon was determined by the Walkley–Black method
(EMBRAPA, 1997). This method is based on the
oxi-dation of C by acid dichromate and titration of excess dichromate with ammonium iron(II) sulfate hexahy-drate solution.
Iron, aluminum and sulfur were analyzed by X-ray fluorescence spectrometry (Rigaku 3134), and mineral-ogical analysis of the samples was carried out with a Rigaku X-ray diffractometer.
The physico-chemical parameters and Hg contents measured were analyzed using STATISTICA for Win-dows, version 6.0 for linear correlation (Pearson’s correlation).
4. Results and discussion
4.1. Sample characterization and Hg quantification
X-ray diffraction analyses of bulk mineralogy reveal that the soil samples consist primarily of quartz (SiO2),
Table 1
Distributions of mercury and organic carbon concentrations in different size fractions at three soil depths
Sampling Sites
pH range Size fractions (mm)
Depth (30 cm) Depth (60 cm) Depth (90 cm)
Sample Grain size (%)
Hg (Ag/g) Organic
carbon (%)
Sample Grain size (%)
Hg (Ag/g) Organic
carbon (%)
Sample Grain size (%)
Hg (Ag/g) Organic
carbon (%)
TP 09 5.1–5.6 2.0–0.59 SA1d 22 1.08F0.12 5.0F0.2 SA2d 13 1.23F0.12 2.6F0.1 SA3d 13 0.62F0.06 3.8F0.2 0.59–0.062 SA1g 61 0.91F0.09 4.6F0.2 SA2g 71 0.48F0.05 2.0F0.1 SA3g 72 0.39F0.04 2.0F0.1 b0.062 SA1h 17 1.18F0.12 5.3F0.2 SA2h 16 0.94F0.09 2.7F0.1 SA3h 15 0.79F0.08 2.8F0.1 TP-10 5.0–5.2 2.0–0.59 SB1d 24 0.21F0.02 3.3F0.2 SB2d 28 0.11F0.01 1.0F0.1 SB3d 23 0.09F0.02 1.8F0.1 0.59–0.062 SB1g 51 0.17F0.02 3.1F0.2 SB2g 40 0.15F0.01 1.7F0.1 SB3g 55 0.11F0.01 2.1F0.1 b0.062 SB1h 25 0.23F0.02 3.5F0.2 SB2h 32 0.17F0.02 1.4F0.1 SB3h 22 0.11F0.01 1.4F0.1 TP-16 5.1–5.7 2.0–0.59 SC1d 5 0.16F0.02 6.8F0.2 SC2d 12 0.28F0.03 3.4F0.2 SC3d 5 0.18F0.02 4.6F0.2 0.59–0.062 SC1g 68 0.12F0.01 2.0F0.1 SC2g 62 0.15F0.01 1.9F0.1 SC3g 57 0.12F0.01 1.7F0.1 b0.062 SC1h 27 0.16F0.02 1.7F0.1 SC2h 26 0.27F0.03 2.1F0.1 SC3h 38 0.25F0.02 1.7F0.1 TP-18 5.3–5.7 2.0–0.59 SF1d 12 0.27F0.03 12.0F0.3 SF2d 14 0.67F0.07 4.8F0.2 SF3d 24 0.70F0.07 5.8F0.2 0.59–0.062 SF1g 52 0.38F0.04 3.9F0.2 SF2g 42 0.55F0.05 2.7F0.1 SF3g 50 0.47F0.05 2.9F0.1 b0.062 SF1h 36 0.60F0.06 3.5F0.2 SF2h 44 0.75F0.07 1.9F0.1 SF3h 26 0.63F0.06 2.4F0.1 TP-20 5.2–5.7 2.0–0.59 SD1d 7 0.29F0.03 2.7F0.1 SD2d 10 0.22F0.02 1.3F0.1 SD3d 16 0.28F0.03 0.8F0.1 0.59–0.062 SD1g 80 0.22F0.02 1.0F0.1 SD2g 77 0.21F0.02 0.8F0.1 SD3g 75 0.24F0.02 0.4F0.1 b0.062 SD1h 13 0.37F0.04 2.3F0.1 SD2h 13 0.43F0.04 1.6F0.1 SD3h 9 0.39F0.04 1.3F0.1 TP-25 5.7–6.0 2.0–0.59 SE1d 9 0.76F0.08 3.4F0.2 SE2d 10 0.88F0.09 2.7F0.1 SE3d 10 0.88F0.09 2.3F0.1 0.59–0.062 SE1g 40 0.38F0.04 1.4F0.1 SE2g 40 0.53F0.05 0.7F0.1 SE3g 41 0.58F0.06 1.2F0.1 b0.062 SE1h 51 0.51F0.05 b0.1 SE2h 50 0.77F0.08 b0.1 SE3h 49 0.83F0.08 b0.1
H.E.L.
Palmieri
et
al.
/
Science
of
the
T
otal
Envir
onment
368
(2006)
kaolinite (Al2Si2O5(OH)4), goethite (FeOdOH) and
muscovite (KAl2(AlSi3O10)(OH)2). Minor amounts of
hematite (Fe2O3), gibbsite (a-Al2O3d3H2O), magnetite
(Fe3O4), chlorite (Mg3(Si4O10)d(OH)2dMg3(OH)6)
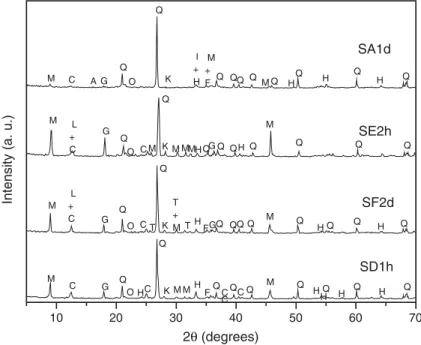
were also observed. The silt and clay fraction is pre-dominantly composed of quartz, muscovite and kaolin-ite, with minor amounts of goethkaolin-ite, hematite and gibbsite. At TP-25, the predominant minerals were quartz, muscovite and kaolinite. Diffractograms of sam-ples SA1d, SE2h, SF2d and SD1h are shown inFig. 2. The distribution of total mercury, organic carbon, Al, Fe and S concentrations in different grain-size fractions at three depths and at six sampling sites is summarized
in Tables 1 and 2. The mercury concentrations
pre-sented in Table 1 are reported as Ag/g dry weight. Total mercury concentration in soil samples ranged from 0.09 to 1.23 Ag/g, significantly higher than the concentration of b0.1 Ag/g established by Fergusson
(1990)for unpolluted soils. Hg content in the sediment
sample (SDTh) was 0.62Ag/g. The values obtained for organic carbon (0.6–4.8%) agree with the typical con-tent values of organic matter in tropical soils of South America (0.5–21.7%) reported by Alloway (1995).
Soil was found to consist mainly of fine and medium sand texture (0.59–0.062 mm). Clay and silt ranged from 9% to 51%. At site TP-25 (Fortes pond), the predominant size fraction was b0.062 mm. At this
site, abundant fine grains were deposited. In most of the samples of this study, sand (2–0.59 mm) and silt and
clay (b0.062 mm) fractions contained similar Hg
con-centrations. The same was observed for Fe, Al and organic carbon (except at TP-25). Sulfur concentration appeared to be independent from particle size. The behavior of mercury in association with the finest gran-ulometric class of clay in soil was observed in previous studies (Busher, 1992; Leoni and Sartori, 1997). According to Tessier et al. (1982), increased metal concentration in coarse fractions had already been ob-served, and it is believed that coarse particles may document anthropogenic inputs better because of their limited transport and longer residence time at any par-ticular site.
Sample pH values were between 5.0 and 6.0. Hence, this acid soil can be associated with the humid climate of this region, where possibly frequent leaching tends to produce protonated clays, which lowers the pH.
4.2. Mercury phases in soils
TDCs of standard mercury compounds or mercury binding forms, which might potentially occur in soils of TES, are shown inFig. 3.
Hg TDCs were carried out in all samples, and the representative curves are shown inFig. 4. Most of them display a characteristic pattern defined by peaks with one maximum between 280 and 3808C (Fig. 4a). This suggests the presence of mercury in the form of Hg2+ bound to organic matter according to the curve of
10 20 30 40 50 60 70
K HQ H Q H Q
H Q M C C C Q
Q F H Q M M Q HC O Q G C M Q Q M Q H Q Q QG MH M M K M C O L + C G Q Q Q M H
HQ Q Q
Q Q Q Q Q G F H T T + M K T C O G L + C M M Q Q Q H H Q H Q M M +
F Q Q
K I + H
A Q Q Q
Q Q O G C M SD1h SF2d SE2h SA1d
Intensity (a. u.)
2θ (degrees)
Fig. 2. Diffractograms of samples SA1d, SE2h, SF2d, and SD1h. Mineral peaks: M (muscovite); C (kaolinite); A (albite); L (chlorite); G (gibbsite); Q (quartz); O (goethite); H (hematite); T (tourmaline); K (microcline); I (ilmenite); F (magnetite).
Table 2
Distributions of aluminum, iron, and sulfur concentrations in different size fractions at three soil depths
Sampling sites Size fractions (mm) Depth (30 cm) Depth (60 cm) Depth (90 cm)
Sample Al (%) Fe (%) S (Ag/g) Sample Al (%) Fe (%) S (Ag/g) Sample Al (%) Fe (%) S (Ag/g)
TP-09 2.0–0.59 SA1d 6.1F0.6 12.4F1.2 490F50 SA2d 6.2F0.6 11.7F1.2 240F20 SA3d 5.5F0.5 11.1F1.1 260F30 0.59–0.062 SA1g 6.1F0.6 11.1F1.0 490F50 SA2g 5.3F0.5 8.4F0.8 200F20 SA3g 4.6F0.5 7.8F0.8 190F20 b0.062 SA1h 6.6F0.7 12.3F1.2 520F50 SA2h 8.1F0.8 12.2F1.2 260F30 SA3h 7.5F0.7 11.5F1.2 240F20 TP-10 2.0–0.59 SB1d 10.1F1.0 6.1F0.6 180F20 SB2d 12.6F1.3 5.2F0.5 b100 SB3d 11.9F1.2 6.0F0.6 140F10 0.59–0.062 SB1g 8.1F0.8 4.6F0.5 190F20 SB2g 10.1F1.0 4.4F0.4 120F10 SB3g 10.4F1.0 4.7F0.5 170F20 b0.062 SB1h 10.8F1.0 6.9F0.7 210F20 SB2h 11.7F1.2 6.0F0.6 b100 SB3h 11.7F1.2 6.5F0.6 130F10 TP-16 2.0–0.59 SC1d 6.2F0.6 13.2F1.3 450F40 SC2d 7.7F0.8 11.5F1.2 260F30 SC3d 7.1F0.7 12.7F1.3 250F20 0.59–0.062 SC1g 4.0F0.4 9.6F1.0 160F20 SC2g 5.8F0.6 9.0F0.9 200F20 SC3g 4.8F0.5 8.7F0.9 140F10 b0.062 SC1h 7.7F0.8 18.8F1.9 200F20 SC2h 8.9F0.9 15.3F1.5 230F20 SC3h 9.2F0.9 14.8F1.5 180F20 TP-18 2.0–0.59 SF1d 8.9F0.9 8.4F0.8 1370F140 SF2d 9.7F1.0 9.2F0.9 500F50 SF3d 9.2F0.9 8.4F0.8 600F60 0.59–0.062 SF1g 6.2F0.6 5.5F0.5 380F40 SF2g 8.6F0.9 6.7F0.7 250F20 SF3g 8.0F0.8 6.9F0.7 300F30 b0.062 SF1h 9.4F0.9 10.1F1.0 280F30 SF2h 10.0F1.0 9.4F0.9 140F10 SF3h 10.0F1.0 9.3F0.9 220F20 TP-20 2.0–0.59 SD1d 6.2F0.6 21.2F2.1 220F20 SD2d 8.4F0.8 14.2F1.4 b100 SD3d 3.3F0.3 14.8F1.5 b100
0.59–0.062 SD1g 3.7F0.4 11.8F1.2 b100 SD2g 8.3F0.8 14.1F1.4 b100 SD3g 4.1F0.4 15.2F1.5 b100 b0.062 SD1h 6.7F0.7 18.7F1.9 180F20 SD2h 9.0F0.9 19.2F1.9 110F10 SD3h 9.5F0.9 13.7F1.4 120F10 TP-25 2.0–0.59 SE1d 8.6F0.9 6.7F0.7 b100 SE2d 8.3F0.8 6.6F0.7 120F10 SE3d 8.6F0.9 6.6F0.7 b100
0.59–0.062 SE1g 6.2F0.6 3.7F0.4 b100 SE2g 6.6F0.7 3.4F0.3 b100 SE3g 6.5F0.6 3.7F0.4 b100 b0.062 SE1h 9.6F1.0 6.7F0.7 b100 SE2h 9.8F1.0 6.6F0.7 b100 SE3h 10.2F1.0 6.8F0.7 b100
H.E.L.
Palmieri
et
al.
/
Science
of
the
T
otal
Envir
onment
368
(2006)
standard Hg in humic acid (Fig. 3). Hg release tem-peratures varied with grain size, indicating a slightly stronger Hg interaction with the silt and clay fraction
(Fig. 4a and c, samples SA2h, SE2h). In some topsoil
layer, samples from sites TP-20 and TP-18 and in one sediment sample (SDT) from TP-09, Hg TDCs display a basically bimodal pattern with peaks at about 280– 380 8C and 400–500 8C (Fig. 4b). This suggests the presence of mercury bound to organic matter and the existence of red cinnabar as shown in the natural cin-nabar curve from the region studied (Fig. 3). According
to Biester et al. (2000), the thermal decomposition of
red cinnabar shows sharp Hg peaks due to the break-down of the cinnabar lattice, which causes the sudden release of high amounts of metallic Hg. They also found that the mercury release temperatures of red cinnabar varies slightly with crystallinity and grain size. Synthetic cinnabar (Fig. 3) showed Hg release temperatures lower than those of the fully crystalline cinnabar of the region studied. It is interesting to note that sample SD1h (Fig. 4b) and others that present similar peaks are from the topsoil layer, which indicates a possible detrital origin of cinnabar. According to
Alloway (1995), cinnabar is resistant to normal
oxida-tion and weathering processes, and therefore, it enters the geochemical cycle mainly in the form of mechan-ically degraded particulate material. Metallic mercury is released below 2008C (Fig. 3), but it was not detected in the soil samples studied as would be expected in the case of anthropogenic Hg input due to the gold amal-gamation process.
TP-25 samples showed Hg release temperatures higher than 400 8C (Fig. 4c), indicating that in these samples, mercury is more strongly bound to the matrix in comparison to the other samples evaluated here. This high release temperature is comparable with that of Hg bound to ferrihydrite (Valle, 2005). Due to its low crystallinity, this iron oxide presents a large surface area and high reactivity. This hypothesis is quite rea-sonable, since the soil of TES is rich in iron oxides.
4.3. Correlation analysis
With the objective of evaluating correlations be-tween Hg concentrations and the physico-chemical parameters analyzed at 3 depths and at 5 sites, Pearson linear correlation coefficient test was used. The obtained correlation matrix is presented in Table 3. TP-25 data were not included in this correlation due to its different behavior, as already demonstrated by Hg TDCs. The correlations in bold are significant at pb0.05 (N= 15). As can be seen inTable 3, Hg
corre-lated with organic carbon (r= 0.64) and sulfur (r= 0.77), and organic carbon strongly correlated with sulfur (r= 0.88). Shuster (1991) stated that mercury exhibits a large affinity for organic matter in soils and sediments due to its strong affinity for S-containing functional groups frequently found in organic mole-cules. Busher (1992) found a significant correlation between Hg and organic matter content in sediments from Tripuı´ Stream and observed that sulfur is most likely associated with sulfide minerals, mainly pyrite,
0 100 200 300 400 500 600
0.00 0.25 0.50 0.75 1.00 1.25 1.50 1.75 2.00 2.25
Hg release
Temperature, °C
Red Cinnabar (Natural) Red Cinnabar (Synthetic) Hg (0)
Hg in Humic Acids
Fig. 3. Comparison of thermal desorption curves of standard mercury compounds.
and possibly with sulfur-bearing organic matter. It was also concluded through thermal desorption technique that Hg in sediment samples from Carmo River, Minas Gerais, Brazil (FEAM et al., 1999) was mostly associ-ated to humic acids. The results of this study suggest that the Hg–S–organic matter interaction occurs with a large part of Hg present in soils. Although the clay and silt (b0.062 mm) mineralogy of site TP-25 is
predom-inantly of minerals quartz, kaolinite and muscovite and lesser amounts of hematite, goethite and gibbsite, ther-mal desorption results suggest that Hg is strongly bound as in Hg-ferrihydrite (Valle, 2005).
4.4. Mercury distribution in soil profiles
Mercury concentration profiles (30, 60 and 90 cm) at six TES sites are shown in Fig. 5. The mercury con-centration at each depth was calculated by the weighted mean of the Hg concentration in the three different grain sizes studied. In most sites, Hg was homoge-neously distributed throughout the depths. At TP-09, the concentration of Hg decreased with the depth, whereas at TP-25, the opposite was observed. The retention of Hg at TP-09 is probably related with the organic carbon content (Anderson, 1979), which is the highest in the topsoil layer. The low organic carbon content, acid pH and the oxidizing conditions (
Fergus-son, 1990) may explain the presence of Hg in the
deepest layer at TP-25. Within the soil profiles, organic matter content was the highest in the surface horizon, and the concentrations of Fe, Al and S were almost always homogeneously distributed throughout the depths. According to Fergusson (1990), variations in the concentrations of heavy elements in soil profile are not consistent and are as readily interpreted as in water and sediment profile. Several factors can influence the level of an element in a soil profile: the nature of the parent material, pedogenic process, organic and clay content, proportion of iron-containing minerals, pH, soil topography, rainfall, microbial activity and the level of pollution. The relevance of the factors will vary from site to site.
5. Conclusions
The distribution of mercury in TES soils pre-sented Hg concentrations ranging from 0.09 to
0 100 200 300 400 500 600
0 100 200 300 400 500 600
0 100 200 300 400 500 600 700 0.0
0.1 0.2 0.3 0.4 0.5 0.6 0.7 0.8 0.9 1.0
a SA2d
SA2h SA2g
Hg release
Temperature, °C
Temperature, °C
Temperature, °C 0.0
0.1 0.2 0.3 0.4 0.5 0.6 0.7
b Natural cinnabar
SDTh SD1h
Hg release
0.00 0.05 0.10 0.15 0.20 0.25 0.30 0.35 0.40
c SE2d
SE2h SE2g
Hg release
Fig. 4. Hg thermal desorption curves of TES samples: (a) different size fractions of sample SA2; (b) natural red cinnabar; track sediment sample SDTh (b0.062 mm); soil sample SD1h; (c) different size fractions of sample SE2.
Table 3
Pearson’s correlation between selected parameters in soils at three depths (N = 15, pb0.05)
Depth Hg Organic carbon
pH Al Fe S
Depth 1.00 Hg 0.14 1.00 Organic
carbon
0.42 0.64 1.00
1.23 Ag/g. The highest contents were found at the site nearest to an abandoned cinnabar mine, TP-09, and at the sites that receive direct influence from this mine through Botafogo Stream (18 and TP-20). Although Fortes pond (TP 25) was not affected by the cinnabar mine, it showed a high Hg content. As Hg0 was not detected in soil samples, it can be concluded that if there were metallic Hg input through gold amalgamation process in past times, it was oxidized to Hg2+ and sorbed onto soil components.
The results showed that Hg concentration depends on the distribution of different soil grain size fractions. Hg concentration was similar in the sand size fraction (2–0.59 mm) and in the silt and clay size fraction (b0.062 mm) of all soil layers studied. The same was
observed for Fe, Al and organic matter, with the excep-tion of site TP-25.
TDCs revealed the presence of mercury in the form of Hg2+ bound to organic components in most of the samples as well as the presence of red cinnabar in some. Data correlation analysis confirmed that mercury is associated with organic matter and sulfur and possibly with sulfur-bearing organic matter in soils.
The results suggest that mercury has been introduced into the soils along the years mainly via erosion process in the abandoned cinnabar mine rather than by anthro-pogenic origin.
Acknowledgements
We acknowledge the cooperation of the State For-est Institution (I E F) of Minas Gerais for allowing
the collection of samples at the Tripuı´ Ecological Station.
References
Alloway BJ. Heavy metals in soils. London7Blackie Academic & Professional; 1995. 368 pp.
Anderson A . Mercury in soils. In: Nriagu JO. The Biogeochemistry of Mercury in the Environment. Elsevier, North-Holland: Bio-medical Press, 1979, pp. 79–112.
Azzaria LM, Webber GR. Mercury analysis in geochemical explora-tion. Can Min Metall (CIM) Bull 1969;521 – 30 [May]. Biester H, Gosar M, Covelli S. Mercury speciation in sediments
affected by dumped mining residues in the drainage area of the Idrija mercury mine, Slovenia. Environ Sci Technol 2000;34: 3330 – 56.
Busher, DP, (1992). Mercury in river sediments from Garimpeiro activities in the vicinity of Ouro Preto, Minas Gerais, Brazil. M.Sc. Thesis, Faculty and Board of Trustees of the Colorado School of Mines, Golden, Colorado, 140 pp.
Cruz, LV, (2002). Avaliac¸a˜o Geoquı´mica Ambiental da Estac¸a˜o Eco-lo´gica do Tripuı´ e Adjaceˆncias, Sudeste do Quadrila´tero Ferrı´fero, MG. M.Sc. Thesis, Federal University of Ouro Preto, Minas Gerais, Brasil, 147 pp.
EMBRAPA/Empresa Brasileira de Pesquisa Agropecua´ria S. Manual de me´todos de ana´lise do solo. 2 ed. Rio de Janeiro7 Centro Nacional de Pesquisa de Solos; 1997. 212 pp.
Eschewge WL, 1979. Pluto Brasiliensis Col Reconquista do Brasil Itatiaia, Belo Horizonte. Sa˜o Paulo7USP; 1979. p. 165 – 6. FEAM, SES, FUNED, CDTN. 1999. Pesquisa da Contaminac¸a˜o por
Mercu´rio em Garimpo do Estado de Minas Gerais, seu Impacto na Sau´de e no meio Ambiente: relato´rio te´cnico final. Belo Hori-zonte, Minas Gerais, Brasil, v. 1, 182 pp.
Fergusson JE. The heavy elements. Chemistry, environment impact and health effects. Oxford7Pergamon Press; 1990. 614 pp. Guimara˜es Neto, AS. Estac¸a˜o Ecolo´gica do Tripuı´, Ouro Preto, MG.
1999,http://www.em.ufop.br/op/tripui.htm. Date of access: Oct 2003.
Higueras P, Oyarzun R, Biester H, Lillo J, Lorenzo S. A first insight into mercury distribution and speciation in soils from
10
30
50
70
90
110
0.00 0.20 0.40 0.60 0.80 1.00 1.20
Hg (µg/g)
Depth (cm)
TP 09
TP 10
TP 16
TP 20
TP 25
TP 18 TP 09
TP 10
TP 16 TP 20
TP 25 TP 18
Fig. 5. Mercury profiles at six sites in Tripuı´ Ecological Station.
the Almade´n mining district, Spain. J Geochem Explor 2003; 80:95 – 104.
Leoni L, Sartori F. Heavy metals and arsenic distributions in sedi-ments of the Elba-Argentino basin, southern Tuscany, Italy. Environ Geol 1997;32:83 – 92.
Mierle G, Ingram R. The role of humic substances in the mobiliza-tion of mercury from watersheds. Water Air Soil Pollut 1991;56: 349 – 57.
Moore JW, Ramamoorthy S. Heavy metals in natural waters. New York7Springer-Verlag; 1984.
Palmieri HEL, Leonel LV, Nalini HA, Cruz LV. Mercury assessment in plants from Trupuı´ Ecological Station, Minas Gerais, Brazil. In: Neves M.V, Neves ACV, editors. Int Symp Environment 2010: Situations and Perspectives for European Union, 6–10 May 2003, Porto, Portugal, paper B 13.
Raposo C, Windmo¨ller CC, Dura˜o Jr WA. Mercury speciation in fluorescent lamps by thermal release analysis. Waste Manag 2003;23:879 – 86.
Salomons W, Fo¨rstner U, Mader P. Heavy metals, problems and solutions. . Berlin7Springer-Verlag; 1995. 412 pp.
Shuster E. The behavior of mercury in the soil with special emphasis on complexation and adsorption process—a review of the litera-ture. Water Air Soil Pollut 1991;56:667 – 80.
Steinnes E. Mercury. In: Alloway BJ, editor. Heavy metals in soils. London7 Blackie Academic & Professional; 1995. p. 245 – 59. Tessier A, Campbell PGC, Bisson M. Particulate trace metal specia-tion in stream sediments and relaspecia-tionship with grain size: impli-cation for geochemical exploration. J Geochem Explor 1982;6: 77 – 104.
Valle, CM, (2005). Especiac¸a˜o, Quantificac¸a˜o, Distribuic¸a˜o e Com-portamento Redox do Mercu´rio em alguns Solos de Manaus, Amazonas, Brasil. Ph.D. Thesis, Chemistry Department, Feder-al University of Minas Gerais, Belo Horizonte, Minas Gerais, 105 pp.
Windmo¨ller CC, Wilken RD, Jardim WF. Mercury speciation in contaminated soils by thermal release analysis. Water Air Soil Pollut 1996;89:399 – 416.