Quim. Nova, Vol. 31, No. 1, 89-93, 2008
Artigo
*e-mail: [email protected]
BUTYLTIN SPECIATION IN SEDIMENTS FROM TODOS OS SANTOS BAY (BAHIA, BRAZIL) BY GC-PFPD
Juliana Feitosa Felizzola, Angela de Luca Rebello Wagener*, Ana Cristina Almeida e Wei Oh Lin
Departamento de Química, Pontifícia Universidade Católica do Rio de Janeiro, Rua Marquês de São Vicente, 225, 22453-900, Rio de Janeiro - RJ, Brasil
Recebido em 2/2/07; aceito em 14/6/07; publicado na web em 9/11/07
Butyltin compounds were investigated in surface sediments from 17 stations in Todos os Santos Bay. Analytical conditions for organotin determination in marine sediments were optimized for GC with pulsed flame photometric detection. Detection limits were: 5.4 µg kg-1 for TBT; 0.2 µg kg-1 for DBT; and 2.1 µg kg-1 for MBT, using a 610-nm filter. In general, TBT concentrations
were low and in the range of <DL to 15.9 µg kg-1. Only in one of the investigated stations DBT and MBT were above detection
limit despite the oxic to slightly anoxic conditions in the sediments. The presence of paint particles in the sediments and degradation in the water column during resuspension events followed by removal of the more soluble DBT and MBT may explain these observations.
Keywords: butyltin speciation; sediments; Todos os Santos Bay.
INTRODUCTION
There is an increasing interest and concern about the wide spread use of antifouling paints containing tributyltin (TBT)1,2. Such
substances intentionally used to eliminate certain organisms that infest ship hulls also act as endocrine disrupters in non target organisms leading to the appearance of imposex in gastropods and to reproductive failure1-8. Because of proven threats to marine
organisms several countries banned or have imposed restrictions to the use of TBT although there are still doubts on the efficacy and possible adverse effects of alternative paints4,5.
In Brazil, no legislation is currently in place to control the use of TBT-based paints. Studies conducted in Guanabara Bay, Rio de Ja-neiro, that houses the second largest harbor in Brazil and several shipyards and marinas, showed concentrations of TBT in sediments as high as 500 µg kg-1 9. Also in Guanabara Bay Almeida et al report
lack of evidences of TBT degradation in the anoxic sediments of the bay10. Limaverde showed that mussels and gastropods from the bay
contain high concentrations of TBT and that imposex in Stramonita haemastoma results from exposition to TBT contaminated waters11.
Godoi et al investigating butyltins in sediments from São Paulo coast found highest TBT levels in Santos harbor (360 µg kg-1 TBT) and in
Guaruja marina (670 µg kg-1 TBT) 12.
The aim of the present work was to extend the evaluation of TBT contamination in surface sediment of coastal Brazilian areas to the Todos os Santos Bay (TSB) located in the northeastern region of Brazil. Organotin speciation in sediments has been used to evaluate the extent of marine environment contamination as well as on going remobilization and degradation processes13.
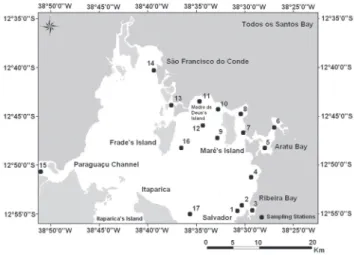
With an area of approximately 1000 km2, the Todos os Santos
Bay is the largest bay in the Brazilian coast. It has an extensive intertidal zone and a narrow opening to the ocean between Itaparica Island and Salvador City (Figure 1). The tidal regime, characterized by NNE high tidal currents and SSW low tidal currents, is the prin-cipal determining factor of water circulation within Todos os Santos Bay. This region is influenced by tropical climate with a well defined rain season from April to June. During summer, predominant winds are from SE, whereas during winter NE winds prevail14.
Since the 1950s, coastal areas of the Todos os Santos Bay have shown increasing industrialization. Exploitation of natural resources also increased along with the population living in the drainage basin15.
Nowadays, effluents from 29 industries drain into the bay contributing, together with urban and port activities, to the pollution of several areas of the bay. Most of the present study was focused in the Northern and Eastern portions of Todos os Santos Bay (Figure 1) because of the presence of an oil refinery, a major harbor, an industrial district and several ports and anchorage points, all potential sources of organotin compounds. The main fluvial contributions to the bay are derived from the Paraguaçu and Subaé rivers but in the above regions only three small rivers are found, namely D. João, Mataripe and São Paulo rivers. All these rivers are crossing zones of abundant mangrove vegetation and carry wastes from several industries and urban areas16.
EXPERIMENTAL
Reagents
All reagents used were analytical grade. Tributyltinchloride (TBTCl) 96%, dibutyltindichloride (DBTCl2) 96%,
butyltintrichloride (DBTCl2) 95%, tetrabutyltin (TeBT) 93% and pentylmagnesiumbromide (CH3(CH2)4MgBr, Grignard reagent) 2 mol L-1 in diethyl ether were purchased from Aldrich (Milwaukee, WI,
USA). Tripropyltinchloride (TPrTCl) 98%, neutral aluminum oxide (Al2O3, 70-230 mesh), Na2SO4, HOAc and HCl were obtained from Merck (Darmstadt, Germany); ammonium pyrrolidinedithiocarbamate (APDC - C5H8NS2.NH4) 97% was purchased from Fluka (Buchs, Switzerland), toluene and methyl alcohol (ChromAR® HPLC) from Malinckrodt, 95% n-hexane HPLC/GC UltimAR® and acetone Nanograde from Malinckrodt or Merck; sílica gel (0.063 – 0.200 mm) and silver nitrate PA (ACS Iso) were from Merck. For organic carbon determination, H3PO4 (p. a., Merck) was used.
Standard preparation
Organotin chlorides and TeBT stock standard solutions were prepared at 1.000 mg kg-1 (as Sn) in hexane and remaining stable
over a period of six months stored at -20 oC. Pentylated working
solutions were prepared by diluting the stock solutions with hexane before derivatization with Grignard reagent.
Sampling
In January 2003, 5 cm of sediments were collected with a Van Veen sampler of 4.2 L specially designed to avoid sediment-water contact during retrieval. Sediments were collected at each station and sub-samples were separated for the determination of organotin compounds, organic carbon, grain size, pH and redox potential (EH), and thereafter immediately sealed and maintained in aluminum box at 4 oC during the transport to the laboratory. The sub-samples
for organotin speciation and organic carbon determination were stored in the dark at -20 oC. In station 15, sample was collected in
July 2003 using a Kullenberg core sampler.
Sample treatment
Redox potential and pH were measured immediately after arrival in the laboratory using an Ag/AgCl/Pt combined electrode and a glass combined electrode, respectively. Measurements were performed under inert atmosphere, inserting the electrode directly in the sediment. The sub-samples for organotin and organic carbon determination were freeze-dried and ground before storing in amber glass bottles in the dark at -20 oC. Samples were not sieved as to
avoid contamination.
Organic carbon determination
Organic carbon was measured in 1–2 g of dry sediment, after acid treatment (1:2 H3PO4 aqueous solution, as recommended in the Shimadzu TOC manual) to eliminate carbonates. A Shimadzu SSM-5000A solid sample combustion unit coupled to a Shimadzu TOC-5000A Total Organic Carbon Analyzer was utilized for determination. Quantification was performed using analytical cur-ves and potassium biphtalate as standard.
Butyltins determination
Extraction
The adopted extraction methodology (Figure 2) was modified from Abalos et al. and Fernández-Escobar et al. as appropriate to the sediments characteristics and to the detection by PFPD17-20. Two
grams of sediment (dry mass) were transferred to a glass centrifuge tube. Tripropyltin chloride (TPrTCl) was added as surrogate at a
spiking level of 0.2 g. The extraction step was accomplished by sonication with toluene/HOAc (10:4, v/v) for 5 min followed by centrifugation at 2000 rpm, for 5 min, and transfer of the supernatant to a separation vessel. This process was repeated twice.
To the extracts 10 mL of 0.5% APDC aqueous solution were added to partition the HOAc to the aqueous phase and improve the solubility of the mono- and disubstituted organotins in the organic phase. This step was repeated two more times and the separated organic phase was percolated through activated Na2SO4 and rotaevaporated to a few milliliters at about 38 oC.
Derivatisation, alumina cleanup and sulfur elimination
After addition of 2 mL of Grignard reagent, the extract was shake for 1 min and left standing for 20 min. Elimination of excess of Grignard reagent was carried out in an ice bath by adding 12 mL of Milli-Q water and 2 mL of concentrated HCl. The derivatised extract was isolated with a Pasteur pipette and then percolated through activated Na2SO4, recovered in a vessel and rotaevaporated to a few milliliters at 38 oC.
GC-PFPD determination
A Varian CP-3800 gas chromatograph fitted with a 1177 split/ splitless injector, a 8200 auto sampler and a pulsed flame photometric detector (Varian, Walnut Creek, CA, USA) was used in the measurements. The injector kept at 250 oC was operated in
splitless mode for 60 s following injection. Separation was performed on a DB-17 (50%-phenyl-methylpolysiloxane) fused silica column of 30 m length, 0.25 mm internal diameter and 0.25 µm film thickness (J&W Scientific, Folsom, CA, USA). Nitrogen (ultra pure; flow 1.7 mL min-1) was used as carrier gas. The following
temperature program was used: 50 o C for 1 min, 50 to 80 o C at 50 o C min-1, 80 to 140 o C at 10 o C min-1, 140 to 170 o C at 2 o C min-1,
170 to 280 o C at 40 o C min-1, with a final hold of 5 min. The
detector, fitted with a Schott BG-17 band pass filter, was held at 300 o C. The gas flow rates were: air
1, 17.1 mL min -1; air
2, 10.6 mL
min-1 and hydrogen, 13.5 mL min-1. Best gate delay, gate width and
trigger level tested in the laboratory were, respectively, 5 ms, 3 ms and 200 mV. The determinations were made in duplicate. The resulting chromatograms were quantified using peak area normalized to the internal standard using the Star Chromatography Workstation 5.52 software (Walnut Creek, CA, USA). A chromatogram demonstrating the good peak resolution is shown under Figure 3.
Calibration and quantification
Quantification was performed by internal standard procedure, using TeBT added after derivatisation. Standards were prepared in hexane containing 6-201 µg L-1 as Sn of pentylated butyltins (TBT, DBT, MBT).
Procedural blanks were carried out for every batch of samples. The analytical procedure was validated by analyzing the harbor sediment reference material PACS-2 from the National Research Council of Canada (Ottawa, Canada), certified for TBT and DBT. As shown in Table 1 results obtained for the certified material are in good agreement with the certified values. The parameters of the calibration curves for all analytes are given under Table 2. Butyltin concentrations were corrected for the recoveries of TPrT (from 70 to 100%) used as surrogate. Derivatization yield tested in standard solutions of the several analytes was always around 85%. Detection limits expressed as µg kg-1 as Sn were: TBT (5.4), DBT (0.2) and
MBT (2.1) 21. The mean relative standard deviation obtained for 7
injections of standard solutions was 8.6% for TBT, 10.3% for DBT and 5.1% for MBT. Reported organotin concentrations are expressed as µg kg-1 dry weight as Sn (µg of tin per kg of dry sediment).
RESULTS AND DISCUSSION
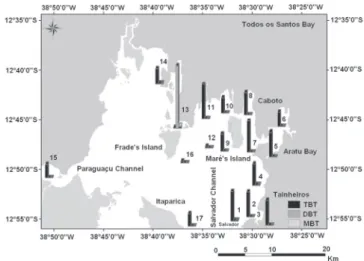
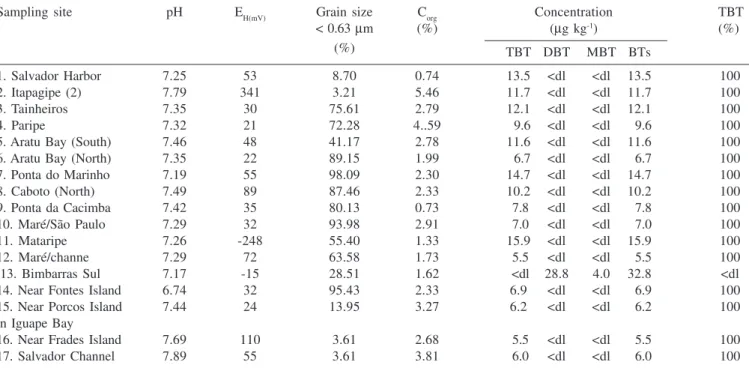
Results are given under Table 3 and the space distribution of concentrations appears in Figure 4. A remarkable result was the absolute dominance of TBT in all stations except in Bimbarras Sul (station 13) where TBT was below detection limit and DBT appeared as the main species. The predominance of TBT is usually associated to recent inputs. Spearman and Pearson statistical tests were applied to verify possible correlations between TBT and the other variables in Table 3. The absence of significant correlations indicates that processes controlling the concentration of TBT and its degradation products are occurring outside the sediment environment, as will be discussed below.
The degradation of TBT through dealkylation to tin occurs via biotic and abiotic reactions22. Photolysis is the most important
abiotic degradation process with a half-life of about 3 months22.
According to Batley and Maguire the half life for the biotic degradation of TBT in waters varies from 6 days to several weeks, while the total mineralization occurs within 50-75 days23,24. Only
in anoxic sediments the degradation is significantly slower ranging from 2 years to decades23,24. Therefore, the virtual absence of TBT
Table 2. Properties of the analytical curves
OTs Linear range CV* Correlation
(µg L-1) (%) coefficient (r)
TPrT 120.91 – 201.53 5.10 0.999
TBT 36.06 – 48.07 5.47 0.998
18.03 – 30.05 9.38 0.990
DBT 30.03 – 60.06 4.63 0.994
MBT 12.08 – 39.26 4.14 0.993
* Coefficient of variation obtained for the given concentration in-terval
Table 1. Butyltin concentrations in the reference material PACS-2 in µg kg-1 as Sn (dry weight)
Compound Determined Value (n=3) Certified Value
TBT 1041.9 ± 21.1 (2.0) 980 ± 130
DBT 1001.3 ± 58.5 (5.8) 1090 ± 150
MBT 172.5 ± 20.7 (11.9) 300a
a Information value; coefficient of variation, in percent, are given
between brackets.
Figure 4. Space distribution of butyltin concentrations in the Todos os Santos Bay
degradation products in sediments, which in its majority can be considered slightly anoxic, is not expected. In Guanabara Bay, where sediments are strongly anoxic, TBT is also the dominant species although DBT and MBT are found in detectable concentrations9,10.
In the Todos os Santos Bay (TSB) the combination of shallow water depths (average of 6 m), high water transparence (relatively low concentration of suspended matter, 2.15–10.07 mg L-1) and
high water turbulence caused by winds and tidal currents may concur for the observed results25. Fent found from studies in seawater that
95-99% of the total TBT is present in the dissolved phase2. Berg et
al. described the adsorption-desorption behavior of TBT in sediments as a fast and reversible process involving mainly particulate organic matter26. In TSB the low availability of particles
of organic nature (0.13 to 1.3 mg L-1) is a factor that contributes to
increasing residence time of these labile compounds in the water phase25. In as much, according to the above cited authors any
resuspension of contaminated sediments will enhance organotin concentrations in the water phase. Page et al. and Waite et al. also showed that significant amounts of TBT and DBT are liberated in the water column if contaminated sediments are resuspended27,28.
Under such a circumstance DBT and MBT may be lost preferentially from the sediment due to the higher solubility as compared to TBT (log Kow, octanol-water partitioning coefficient, is 2.40 for TBT, 1.50 for DBT and 0.40 for MBT)29. It is possible that the generally
low concentrations of TBT and the virtual absence of DBT and MBT in TSB (for some samples DBT and MBT peaks were present in the chromatogram as Figure 3 shows but were too small to allow accurate area measurement) may derive from frequent resuspension of sediments favoring dissolution in the water phase and photolytic or biotic degradation of organotins. Most probably TBT found in the sediments is a residual fraction associated in paint particles which are difficult to degrade. This hypothesis would also explain the absence of DBT and MBT in the sediments.
Organotin compounds (OT) seem to settle down in the vicinities of the sources (harbors, marinas, etc)10,12. The space distribution in
the TSB whereby higher TBT concentrations are in sites of potential sources confirms such a tendency. Stations 9, 10, 12, 14, 15, 16 and 17 where lower concentration were found are in areas under influence of the main tidal currents that enter the bay through the Salvador Channel. The lower values may result from the distance from major sources as well as from current driven dispersion in the water phase prior to sedimentation. It is interesting to note that station 14 in the near of the Subae River and where high sedimentation rates (1.3 cm year-1) are observed shows low TBT
concentrations although there is abundant boat traffic in the area25.
Station 7 in the Aratu Harbor presents the second higher TBT concentration, even if smaller by orders of magnitude than the 742 µg kg-1 reported for sediments from an area influenced by the Rio
de Janeiro Harbor10. Salvador Harbor (station 1), Itapagipe (station
2) and Tanheiros (station 3) are areas of intense navigation and show relatively higher concentrations although not proportional to the existing potential sources. Lessa et al. report presence of strong tidal currents and winds especially in the area of the Salvador Harbor, which may contribute for resuspension and for OT losses from sediments as already discussed above30.
Waite and co-workers proposed a criterion for classification of sediments according to their TBT contamination level28. Through
such criterion, sediments containing from < 10 µg kg-1 TBT as Sn
to 50 µg kg-1 can be considered slightly contaminated. The Brazilian
legislation does not set limits for TBT in sediments but the recently approved Resolution 357 established 0.01 µg L-1 TBT as standard
for saline waters31.
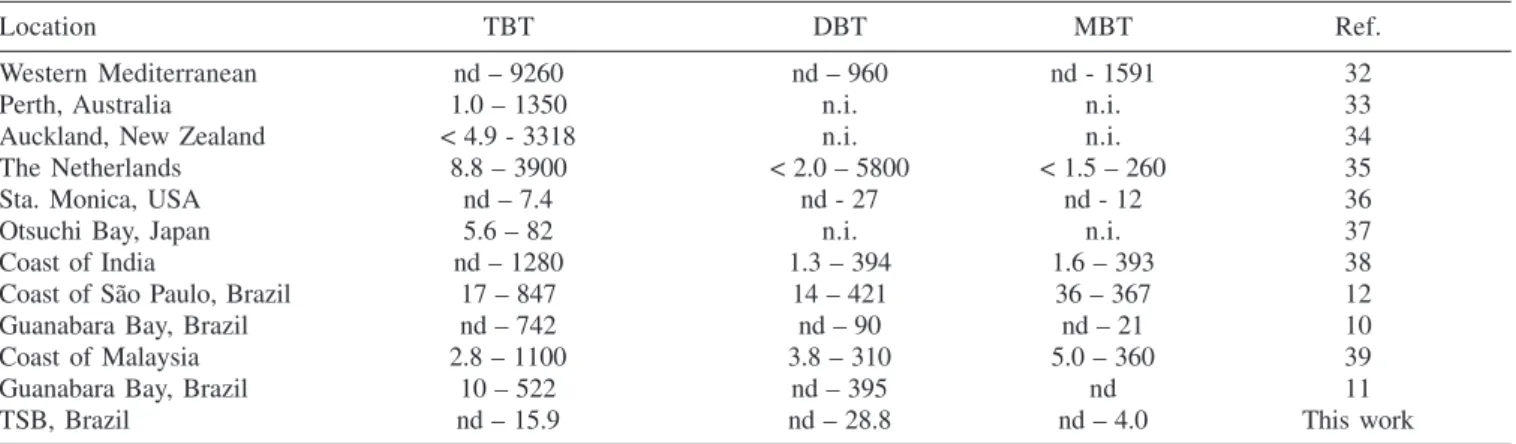
Table 4 shows data from other areas of the globe, which in some cases are of the order of those found for TSB. The lowest values reported by Godoi et al for the coast of São Paulo were found in Cananeia, a rather pristine area where, however, fishing and leisure boats are present12. In Guanabara Bay and in the sites
examined by Godoi et al. in São Paulo sediments were anoxic and peak concentrations were found associated to marinas and harbors as reported for most of the other studied areas in the globe. Table 3. OTs concentrations (µg kg-1 dw as Sn) in the sediment samples from Todos os Santos Bay, Bahia, Brazil
Sampling site pH EH(mV) Grain size Corg Concentration TBT
< 0.63 µm (%) (µg kg-1) (%)
(%) TBT DBT MBT BTs
1. Salvador Harbor 7.25 53 8.70 0.74 13.5 <dl <dl 13.5 100
2. Itapagipe (2) 7.79 341 3.21 5.46 11.7 <dl <dl 11.7 100
3. Tainheiros 7.35 30 75.61 2.79 12.1 <dl <dl 12.1 100
4. Paripe 7.32 21 72.28 4..59 9.6 <dl <dl 9.6 100
5. Aratu Bay (South) 7.46 48 41.17 2.78 11.6 <dl <dl 11.6 100
6. Aratu Bay (North) 7.35 22 89.15 1.99 6.7 <dl <dl 6.7 100
7. Ponta do Marinho 7.19 55 98.09 2.30 14.7 <dl <dl 14.7 100
8. Caboto (North) 7.49 89 87.46 2.33 10.2 <dl <dl 10.2 100
9. Ponta da Cacimba 7.42 35 80.13 0.73 7.8 <dl <dl 7.8 100
10. Maré/São Paulo 7.29 32 93.98 2.91 7.0 <dl <dl 7.0 100
11. Mataripe 7.26 -248 55.40 1.33 15.9 <dl <dl 15.9 100
12. Maré/channe 7.29 72 63.58 1.73 5.5 <dl <dl 5.5 100
l13. Bimbarras Sul 7.17 -15 28.51 1.62 <dl 28.8 4.0 32.8 <dl
14. Near Fontes Island 6.74 32 95.43 2.33 6.9 <dl <dl 6.9 100
15. Near Porcos Island 7.44 24 13.95 3.27 6.2 <dl <dl 6.2 100
in Iguape Bay
16. Near Frades Island 7.69 110 3.61 2.68 5.5 <dl <dl 5.5 100
17. Salvador Channel 7.89 55 3.61 3.81 6.0 <dl <dl 6.0 100
The BT concentrations for each site are the average of two determinations per sample; standard deviations are in the range of 0.1 to 2.3 µg kg-1. dl (detection limit): TBT = 5.4 µg kg-1, DBT = 0.2 µg kg-1 and MBT = 2.1 µg kg-1. Depth (m) of the water column in stations
CONCLUSIONS
The presence of TBT as the dominant OT species in TSB is a rare feature since even in anoxic environments, where TBT is more stable, measurable levels of DBT and MBT have been reported for other areas. TBT concentrations are relatively low even in areas of intense navigation. The combination of these two facts leads to the conclusion that TBT released into the water is rapidly degraded, possibly to tin, before reaching final sedimentation. TBT half life under the environmental conditions of the Todos os Santos Bay may be remarkably smaller than those so far reported in the literature. The fraction that resists degradation must be embedded in a protective medium, most probably paint particles. These results show that monitoring contamination and possible hot spots in TSB needs a different strategy given that concentration records in sediments do not discriminate sites in the near of potential sources from others. Measurements in the water column or in organisms that accumulate TBT or adversely react to its presence at low concentration, as for instance gastropods that develop imposex, are more appropriate for use in future environmental assessments.
ACKNOWLEDGEMENTS
The authors are grateful to CNPq (Conselho Nacional de De-senvolvimento Científico e Tecnológico) for the financial support, to the Environmental Resources Coordination of the State of Bahia and to Hydros Eng. for the right to use the samples. J. Felizzola acknowledges the support of CAPES (Coordenação de Aperfeiço-amento de Pessoal de Nível Superior).
REFERENCES
1. Hoch, M.; Appl. Geochem. 2001, 16, 719.
2. Fent, K.; Crit. Rev. Toxicol. 1996, 26 1.
3. Wilken, R. D.; Kuballa, J.; Jantzen, E.; Fresenius. J. Anal. Chem. 1994,
350, 77.
4. Alzieu, C.; Sanjuan, J.; Deltreil, J. P.; Borel, M.; Mar. Pollut. Bull. 1986,
17, 494.
5. Champ, M.; Sci. Total Environ. 2000, 258, 21.
6. Gibbs, P. E.; Bryan, G. W. In Organotin - Environmental Fate and Effects;
Champ, M. A.; Seligman, P. F., eds.; Chapman & Hall: London, 1996, p. 259.
7. Horigushi, T.; Shiraishi, H.; Shimizu, M.; Masatoshi, M.; Appl. Organomet.
Chem. 1997, 11, 451.
8. Abbott, A.; Abel, P. D.; Arnold, D. W.; Milne, A.; Sci. Total Environ. 2000,
258, 5.
9. Fernandez, M.; Wagener, A. de L. R.; Limaverde, A. M.; Scofield, A. de
L.; Pinheiro, F. M.; Rodrigues, E.; Mar. Environ. Res. 2005, 59, 435.
10. Almeida, A. C.; Wagener, A. de L. R.; Maia, C. B.; Miekeley, N.; Appl.
Organomet. Chem.2004, 18, 694.
11. Limaverde, A. M.; Ph.D. Thesis, Pontifícia Universidade Católica do Rio
de Janeiro, Brazil, 2003.
12. Godoi, A. F. L.; Montone, R. C.; Santiago-Silva, M.; J. Chromatogr., A
2003, 985, 205.
13. Watanabe, N.; Takatsuki, H.; Sukai, S.; Appl.Organomet. Chem. 1997, 11,
273.
14. Ponce, V. R.; Correa, C. I.; An. Hidrograficos1980, 37, 113.
15. Tavares, T. M.; Rocha, V. C.; Porte, C.; Barceló, D.; Albaiges, J.; Mar.
Pollut. Bull. 1988, 19, 575.
16. Venturini, N.; Tommasi, L. R.; Mar. Pollut. Bull.2004, 48, 97.
17. Abalos, M.; Bayona, J. M.; Capañó, R.; Granados, M.; Leal, C.; Prat, M. D.; J. Chromatogr., A 1997, 788, 1.
18. Abalos, M.; Bayona, J. M.; Quevauviller, P.; Appl. Organomet. Chem.1998,
12, 541.
19. Fernández-Escobar, I.; Gibert, M.; Messeguer, A.; Bayona, J. M.; Anal.
Chem. 1998, 70, 3703.
20. Jacobsen, J. A.; Stuer-Lauridsen, F.; Pritzl, G.; Appl. Organomet. Chem.
1997, 11, 737.
21. Currie, L. A.; Anal Chim. Acta1999, 391, 105.
22. Maguire, R. J.; Tkacz, R. J.; Chau, Y. K.; Bengert, G. A.; Wong, P. T. S.;
Chemosphere1986, 15, 253.
23. Batley, G. In Tributyltin: A Case Study of an Environment Contaminant;
de Mora, S.J., ed.; Cambridge University Press: Cambridge, 1996, p. 139. 24. Maguire, R. J. In ref. 23, p. 94.
25. CRA; Diagnóstico da Concentração de Metais Pesados e Hidro-carbonetos
de Petróleo nos Sedimentos e Biota da Baía de Todos os Santos, Centro de Recursos Ambientais da Bahia, Salvador, 2004, vol. II.
26. Berg, M.; Arnold, C. G.; Müller, S. R.; Mühlmann, J.; Schwarzenbach, R. P.; Environ. Sci. Technol.2001, 35, 3151.
27. Page, D. S. ; Widdows, J.; Environ. Pollut. 1996, 91, 237.
28. Waite, M. E.; Waldock, M. J.; Thain, J. E.; Smith, P. J.; Milton, S. M.;
Mar. Environ. Res. 1991, 32, 89.
29. Vighi, M.; Calamari, D.; Chemosphere1985, 14, 1925.
30. Lessa, G. C.; Lima, G. M.; Carvalho, J. B.; Oliveira, W.; http:// www.cpgg.ufba.br/~glessa/bts, accessed in January 2005.
31. Conselho Nacional de Meio Ambiente; Resolução CONAMA No 357,
Brasília, DF, 2005.
32. Tolosa, I.; Merlini, L.; De Bertrand, N.; Bayona, J. M ; Environ. Toxicol.
Chem. 1992, 11, 145.
33. Burt, J. S.; Ebell, G. F.; Mar. Pollut. Bull. 1995, 30, 723.
34. De Mora, S. J.; Phillips, D. R.; Mar. Pollut. Bull.. 1995, 30, 50.
35. Stab, J. A.; Traas, T. P.; Stroomberg, G.; van Kesteren, J.; Leonards, P.;
van Hutten, B.; Th. Brinkman, U. A.; Cofino, W. P.; Arch. Environ. Contam.
Toxicol. 1996, 31, 319.
36. Venkatesan, M. I.; Chalaux, N.; Bayona, J. M.; Zeng, E.; Environ. Pollut.
1998, 99, 263.
37. Takahashi, S.; Tanabe, S.; Takeuchi, I.; Miyazaki, N.; Arch. Environ.
Contam. Toxicol. 1999, 37, 50.
38. Rajendran, R. B.; J. Environ. Monit. 2001, 3, 627.
39. Sudaryanto, A.; Takahashi, S.; Iwata, H.; Tanabe, S.; Ismail, A.; Environ.
Pollut. 2004, 130, 347.
Table 4 . Examples of OT concentrations reported for different areas of the world (µg kg-1 as Sn)
Location TBT DBT MBT Ref.
Western Mediterranean nd – 9260 nd – 960 nd - 1591 32
Perth, Australia 1.0 – 1350 n.i. n.i. 33
Auckland, New Zealand < 4.9 - 3318 n.i. n.i. 34
The Netherlands 8.8 – 3900 < 2.0 – 5800 < 1.5 – 260 35
Sta. Monica, USA nd – 7.4 nd - 27 nd - 12 36
Otsuchi Bay, Japan 5.6 – 82 n.i. n.i. 37
Coast of India nd – 1280 1.3 – 394 1.6 – 393 38
Coast of São Paulo, Brazil 17 – 847 14 – 421 36 – 367 12
Guanabara Bay, Brazil nd – 742 nd – 90 nd – 21 10
Coast of Malaysia 2.8 – 1100 3.8 – 310 5.0 – 360 39
Guanabara Bay, Brazil 10 – 522 nd – 395 nd 11
TSB, Brazil nd – 15.9 nd – 28.8 nd – 4.0 This work