Article
J. Braz. Chem. Soc., Vol. 22, No. 5, 910-918, 2011. Printed in Brazil - ©2011 Sociedade Brasileira de Química 0103 - 5053 $6.00+0.00
A
*e-mail: [email protected]
Arsenic and Mercury Mobility in Brazilian Sediments from the São Francisco River Basin
Patrícia S. Rezende, Priscila A. S. Moura, Walter A. Durão Jr., Clésia C. Nascentes, Cláudia C. Windmöller and Letícia M. Costa*
Departamento de Química, ICEx, Universidade Federal de Minas Gerais, Av. Presidente Antônio Carlos, 6627, 31270-901 Belo Horizonte-MG, Brazil
Os sedimentos possuem propriedades de acumulação de poluentes e a determinação de elementos tóxicos nessas amostras permite avaliar o seu ciclo geoquímico. Arsênio e mercúrio foram determinados em 28 amostras de sedimento da Bacia do Rio São Francisco, Minas Gerais, Brasil, por geração de hidretos acoplada à espectrometria de absorção atômica (HG AAS). Foram empregados procedimentos de digestão pseudo-total empregando HCl:HNO3 (3:1 v/v) e extração parcial com HCl 1 mol L-1. Realizou-se ainda a determinação de Hg nas amostras sólidas, utilizando-se um analisador direto de mercúrio. Observou-se que 46% das amostras apresentaram concentrações de As acima do limite de nível 1 estabelecido pela Resolução 344/2004 do CONAMA e que 14% excederam o limite de nível 1 para Hg. As amostras com altas concentrações de Hg foram também analisadas por termodessorção acoplada à espectrometria de absorção atômica (TDAAS) para especiação e os termogramas apontaram somente a presença da espécie Hg(II).
Sediments have metal accumulation properties, then, an evaluation of their geochemistry cycle is feasible via toxic element determination of these samples. Arsenic and mercury determinations were accomplished in 28 sediment samples from the São Francisco River Basin, Minas Gerais, Brazil. For sample pretreatment were employed a pseudo-total digestion procedure with HCl:HNO3 (3:1 v/v) and a partial extraction procedure with 1 mol L-1 HCl. Arsenic and mercury were analysed by hydride generator atomic absorption spectrometry (HG AAS). Mercury determination was realized in the solid samples by direct mercury analyzer (DMA). It was observed that 46% of the samples presented arsenic concentrations above Brazil’s legal limits, and 14% of samples exceeded the established mercury limit. The samples with high mercury content were also analysed by thermodesorption coupled to atomic absorption spectrometry (TDAAS) and only Hg(II) was identiied.
Keywords: arsenic, mercury, sediment samples, environmental monitoring, São Francisco River
Introduction
In most aquatic environments, dissolved metal concentrations in overlying water are low due to the precipitation of solids or the adsorption of suspended
particles and the deposition of these particles as sediments.1
Sediment is a matrix comprising inorganic and organic particles. It is relatively heterogeneous in terms of its physical, chemical, and biological characteristics. Sediments have an important role in the transport and storage of contaminants, being of high relevance in the identification of contaminant sources and in the determination of dispersion pathways. Sediment quality determines the biodiversity and the ecological health in
aquatic systems as well as being economically important
in the environmental assessment of coastal areas.2
São Francisco is the third largest hydrographic basin in Brazil. It is responsible for drainage of a 640.000 km² area, corresponding to 8% of land in the country of Brazil. About 40% of the basin is located in the state of Minas Gerais and it is divided in four regions: High São Francisco (where its source is located), Middle São Francisco, Sub Middle São Francisco, and Low São Francisco, which ends in the
Atlantic Ocean.3 According to IBGE4 (Instituto Brasileiro
population growth, are responsible for serious pollution problems, which can cause negative effects in the hydrologic regime, especially concerning to water quality and quantity. A crucial aspect of the degradation of the São Francisco Basin is the introduction of metals, which occurs via mining activities, the use of fertilizers, and the release of domestic and industrial efluents often without
any pretreatment.3,5
In aquatic systems, metals are distributed as colloids, species which are water soluble, and as materials in suspension and in sediments. Sediments have high capacity for adsorbing and retaining contaminants. Metal concentrations in sediments and in river waters can be easily altered by deposition and remobilization processes. It is estimated that less than 1% of these pollutants are water
soluble, so most are stored in sediments.6
Arsenic and mercury are recognizable toxic elements,
which can cause serious damages to the biota.7 The presence
of Hg as a pollutant comes from the use of its amalgamation
property to increase eficiency of gold extraction. InMinas
Gerais, mining began at the end of the 17th century although
this practice has been in decline recently due to actions by environmental inspection organizations. It is estimated that gold exploration represents almost 70% of Hg released
by anthropogenic sources in Brazil.8 Other anthropogenic
contribution occurs through prospecting, the electrolytic production of chlorine-soda, and the use of fossil fuels, waste incinerators, pigments, pesticides, mercury vapor
lamps, batteries, and dental products.9
All Hg compounds have high toxicity indexes concerning living organisms with organic Hg species
being the most toxic.10 Mercury occurs naturally with other
elements, mainly sulfur, forming the cinnabar mineral (HgS). Other natural Hg sources are volcanic eruptions,
natural evaporation, and Hg mines.9
Mercury determination in sediments is a useful tool to evaluate the impact in the aquatic environment. In some
studies,8,11-15 Hg determination in sediment samples showed
levels above of those allowed by the Brazilian legislation
(0.17 µg g-1), according to level 1 from 2004 CONAMA
Resolution 344 (Conselho Nacional do Meio Ambiente).16
Windmöller et al.,8 between October 2002 and March 2003,
studied sediment samples from the Iron Quadrangle area, obtaining values for Hg concentrations between 0.05 and
1.10 µg g-1. Mozeto et al.15 obtained Hg concentrations up
to 2.5 µg g-1 between June 2005 and January 2006 in the
Três Marias Dam area.
High As levels in soil, sediment, and water can also be observed near gold exploration areas where the
anthropogenic sources. The main anthropogenic sources include mining activities, glass and pesticide manufacturing, and the use of leather and wood preservatives. Two main natural As sources are volatilization and volcanic activity,
responsible for almost half of the total As released.18
Arsenic is often associated with minerals, especially Au, as arsenopyrite. Arsenic toxicity is related to the chemical species it forms, inorganic species are the
most toxic.18 Arsenic monitoring in sediments have been
studied for decades.18-21 Borba et al.20 accomplished As
measurements between 1997 and 1998 in Iron Quadrangle
area and obtained concentrations higher than 1000 µg g-1
in sediments from the Velhas River. Deschamps et al.18,21
studied the same area and found values up to 3300 µg g-1
between 1998 and 2003. According to CONAMA,16 the
legal limit of As at level 1 is 5.9 µg g-1.
In this work, the determination of As and Hg was realized in sediments from the High and Middle courses of the São Francisco River Basin. Sediment samples were submitted to sample preparation via aqua regia pseudo-total
digestion and 1.0 mol L-1 HCl partial extraction procedures.
Arsenic and mercury determination were carried out in a hydride generator atomic absorption spectrometry (HG AAS). Total mercury and Hg oxidation state were determined in a solid sample by direct mercury analyzer (DMA) and by thermodesorption coupled to atomic absorption spectrometry (TDAAS), respectively.
Experimental
Samples and reagents
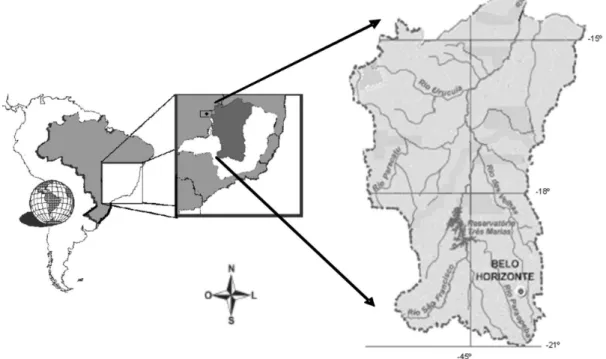
Sediment samples were collected in 28 points from the São Francisco River Basin (Figure 1) as described in Table 1. Sampling points were distributed as follows: seven in the Paraopeba River sub-basin, three in the Velhas River sub-basin, one in the Verde Grande River sub-basin, twelve in the Paracatu River sub-basin, one in the Abaeté River, and four in the São Francisco River, being one in the High São Francisco and three in the Middle São Francisco. Samples were collected from September 4, 2007, to August 28, 2008. Posterior sample collection was made at PTE 023 location. This sampling was done with an auger in three different depth intervals (0-30, 3-60, and 6-90 cm). Furthermore, three other samples from the same area were collected, one from each margin and the third one from the middle of the water low.
room temperature, manually desagregated and sieved into three different categories (< 0.063 mm, 0.063-2 mm, and > 2 mm). The fraction < 0.063 mm was used for As and Hg determinations for all experimental work.
All reagents used were of analytical grade (Merck, Darmstadt, Germany). All solutions and dilutions were
prepared using Milli-Q water (18.2 MΩ cm −1, Millipore
Direct-Q 3, France). The calibration curves were prepared
by adequate dilution of 1000 mg L-1 reference solutions
(Merck, Darmstadt, Germany).
Apparatus
Arsenic and mercury determinations were performed by a Perkin-Elmer AAnalyst FIAS 100 (Shelton, USA) hydride generator system coupled with a Perkin-Elmer AAnalyst
Table 1. Sampling points and principal pollutant sources
Sub-basins Rivers Sampling points Principal Pollutant Sources
Paracatu
Córrego Rico PTE 023
Agriculture; Extraction of jewel, sand, clay and limestone; Domestic sewage; Gold mining and clandestine prospecting; Mining activities efluents Paracatu PTE 007, PTE 033
Ribeirão Entre Ribeiros PTE 031 Ribeirão Escurinho PTE 013 Ribeirão São Pedro PTE 025, PTE 029
Escuro PTE 015
Preto PTE 027, PT 007
Santa Catarina PTE 003, PTE 005 Paraopeba
Maranhão BP 084 Food and steel industries; Extraction of slate, sand, clay and kaolin; Extraction of iron and manganese; Domestic sewage
Paraopeba BP 029, BP 036, BP 068, BP 070, BP 079
Sarzedo BP 086
São Francisco Norte
Abaeté SF 017 Agriculture; Cattle; Swine culture; Metallurgical activities; Extraction of limestone and manganese minerals; Food industries; Domestic sewage; Mining activities efluents
São Francisco SF 015, SF 019, SF 027, SF 033
Velhas Velhas BV 142, BV 149, BV 156
Agriculture; Aviculture; Cattle; Gold mining; Swine culture; Domestic sewage and urban expansion; Industrial efluents
200 (Shelton, USA) lame atomic absorption spectrometer (Shelton, USA). The instrumental conditions are described
inTable 2. For Hg speciation, a thermodesorption system
coupled to atomic absorption spectrometer Analitica GBC 932 AA (São Paulo, Brasil) with a deuterium lamp as background corrector was used. Direct mercury analyzer (DMA) instrument by Milestone DMA-80 TRI-CELL (Sorisole, Italy) was used to determine Hg in a solid sample.
Elemental characterization was done using CHNS 2400 Perkin Elmer (PE 2400 Series II CHNS/O Analyzer) (Shelton, USA).
Sample pretreatment procedures
Pseudo-total digestion procedure
It was used aqua regia as the extractor for the
pseudo-total digestion based on previous works.22,23 Therefore,
10 mL of recently prepared aqua regia were added to about 1000 mg of sediment (fraction < 0.063 mm). The mixture was kept for 16 h at room temperature, then reluxed for 2 h in a digestion block at 90 ºC. Next, the volume was increased to 40.0 mL using Milli-Q water. The sample was then centrifuged for 20 min at 3000 rpm and the supernadant analysed by HG AAS. Standard reference materials (SRM 1944 New Jersey - Waterway Sediment, and NIST SRM 2711 Montana Soil) received the same sample pretreatment. The procedure was performed three times for samples and certiied reference materials.
Partial extraction procedure
About 500 mg of sediment was directly and accurately weighted in a 50.0 mL centrifuge tube. Then 20 mL of
1.0 mol L-1 HCl solution was added. The mixture was
submitted to an ultrasound bath for 1 h. Next, the mixture was centrifuged, and the supernadant was analysed by HG AAS.
Direct mercury analysis (DMA)
About 100 mg of sediment was directly and accurately weighted in quartz boats. Then, samples were submitted
to a heating program (drying 80 s at 200 oC, thermal
decomposition at 650 ºC for 180 s, following to 100 s for analytical signal and cooling). An amalgamator selectively traps Hg and an oxygen stream remove any remaining gases or decomposition products (60 s); the amalgamator is rapidly heated (12 s), releasing Hg vapor. Atomic absorbance is measured at 253.7 nm. The instrument was calibrated in the range of 0 to 20 ng absolute of Hg. To check accuracy, two reference materials NIST-2711 (Montana Soil) and IAEA-336 (Trace Elements in Lichens) with Hg
concentrations of 6.25 ± 0.19 µg g-1 and 200 ± 40 ng g-1,
respectively were used. The limit of detection (LOD) was calculated by three times the average of the standard deviation of ten blanks and the slope of analytical curve. For the limit of quantiication (LOQ), the same average was multiplied by 10.
Mercury speciation by TDAAS
Sediment samples with the highest mercury contents (PTE 023 point) were submitted to the TDAAS analysis to identify the Hg species, as previously described by
Durão Jr. et al.24 The system consists of an electronically
controlled heating unit and one Hg detection unit. For Hg detection, a quartz tube through which the thermally released mercury is purged was placed in the optical system of an atomic absorption spectrometer. Detection was performed at 253.7 nm. Analyses were carried out
twice at a heating rate of 33 ºC min-1 under a nitrogen
gas low of 200 mL min-1. The system used continuous
deuterium background correction to reduce interferences. Sample weight was about 400-2000 mg, depending on the total mercury content previously determined by HG AAS. Results from this system are registered as thermodesorption curves called thermograms, which show the release of mercury vs. temperature. The principle of the technique is that different species are released thermally at different temperatures. Thermograms of the samples were compared to thermograms of
mercury standard substances (Hg(0), Hg2Cl2, HgCl2
and HgO).
Wavelength / nm 193.70 253.65
Flame composition Air-Acetylene –
Current / mA 400 180
Reductant - Flow NaBH4 = 4-6 mL min-1 NaBH4 = 4-6 mL min-1
Carrier Acid - Flow HCl = 8-12 mL min-1 HCl = 8-12 mL min-1
Carrier Gas - Flow Argon = 50 mL min-1 Argon = 50 mL min-1
Linear Calibration range / (µg L-1) 0-200 0-300
Data statistical analysis
Data was analyzed using MINITAB, Version 14, for linear correlation (Pearson correlation) among the variables showed in Table 3. Multivariate analysis through hierarchical cluster analysis (HCA) also was performed to classify the samples according to the values of the studied variables into clusters and generate dendogram. Ward linkage method and Euclidean distance were used. The data was previously mean centered and autoscaled to Variance 1, to ensure that all variables contributed equally to the model, independent of the scale which they were measured.
Results and Discussion
Organic matter content was determined by elemental analysis CHN. Arsenic and mercury contents after aqua regia, partial extraction, and DMA procedures are presented in Table 3.
As previously said, all experimental work was developed with fraction < 0.063 mm, but after sieving the samples, several of them presented predominantly fraction
0.063-2.0 mm, characterized as sandy.25
Organic matter contents shown in Table 3 ranged from 0.6 to 4.3%. The presence of organic matter is responsible for the capability of interactions with other components and for changing the physical, chemical, and biological properties of soils and sediments. Furthermore, organic matter can cause the immobilization or the release of toxic elements to the plants, inluencing the mobility, availability, volatility, and biodegradability of organic and inorganic
molecules.26
As and Hg contents in sediment samples
Aqua regia pseudo-total digestion procedure
The limits of detection and quantiication for As were
0.09 µg g-1 and 0.30 µg g-1, and for Hg were 0.02 µg g-1 and
Table 3. Arsenic, mercury and organic matter contents in the sediment samples from São Francisco basin (n = 3) Sampling
Point
OM / (%) As / (µg g-1) Hg / (µg g-1)
Aqua Regia HCl 1.0 mol L-1 Aqua Regia DMA HCl 1.0 mol L-1
BP029 1.1 3.16 ± 0.04 2.16 ± 0.17 < LOD 0.051 ± 0.001 < LOD
BP036 2.0 7.61 ± 0.19 4.77 ± 0.18 < LOD 0.053 ± 0.002 0.044 ± 0.005
BP068 4.3 2.92 ± 0.24 1.96 ± 0.11 < LOD 0.067 ± 0.005 < LOD
BP070 2.7 2.64 ± 0.08 < LOD 0.050 ± 0.003 0.114 ± 0.003 0.054 ± 0.008
BP079 2.1 7.86 ± 0.58 6.84 ± 0.14 0.050 ± 0.010 0.065 ± 0.001 0.057 ± 0.005
BP084 2.4 14.9 ± 0.5 13.0 ± 0.4 0.050 ± 0.006 0.114 ± 0.002 0.072 ± 0.006
BP086 3.5 3.27 ± 0.17 < LOD 0.25 ± 0.008 0.329 ± 0.013 0.20 ± 0.01
BV142 1.2 102 ± 3 31.3 ± 2.1 < LOD 0.069 ± 0.004 < LOD
BV149 1.2 53.9 ± 1.9 9.73 ± 0.60 0.047 ± 0.003 0.058 ± 0.001 0.045 ± 0.006
BV156 2.1 82.9 ± 0.9 14.2 ± 0.9 < LOD 0.122 ± 0.006 0.023 ± 0.004
PT007 2.0 2.15 ± 0.02 1.07 ± 0.07 0.11 ± 0.01 0.084 ± 0.003 < LOD
PTE003 2.4 4.87 ± 0.20 < LOD 0.054 ± 0.006 0.086 ± 0.001 0.053 ± 0.008
PTE005 2.7 3.90 ± 0.32 < LOD 0.030 ± 0.002 0.164 ± 0.007 0.034 ± 0.002
PTE007 1.4 4.28 ± 0.17 < LOD < LOD 0.063 ± 0.002 < LOD
PTE013 1.4 6.11 ± 0.11 2.28 ± 0.13 < LOD 0.052 ± 0.001 < LOD
PTE015 2.1 5.83 ± 0.02 2.69 ± 0.22 0.089 ± 0.025 0.069 ± 0.001 0.087 ± 0.011
PTE023 2.0 309 ± 15 59.8 ± 1.0 2.3 ± 0.1 2.04 ± 0.06 0.11 ± 0.01
PTE025 2.1 5.04 ± 0.24 2.85 ± 0.11 < LOD 0.036 ± 0.001 < LOD
PTE027 2.5 3.59 ± 0.14 2.04 ± 0.19 < LOD 0.077 ± 0.001 0.019 ± 0.002
PTE029 2.2 16.8 ± 0.30 6.58 ± 0.58 < LOD 0.059 ± 0.001 < LOD
PTE031 3.3 16.5 ± 0.13 9.85 ± 0.75 0.32 ± 0.014 0.207 ± 0.007 < LOD
PTE033 2.4 7.38 ± 0.22 6.62 ± 0.38 0.045 ± 0.003 0.153 ± 0.001 0.031 ± 0.003 SF015 2.0 3.13 ± 0.06 2.55 ± 0.06 0.082 ± 0.003 0.085 ± 0.001 0.015 ± 0.002
SF017 0.6 4.11 ± 0.03 < LOD < LOD 0.063 ± 0.001 < LOD
SF019 2.2 1.86 ± 0.07 < LOD 0.18 ± 0.01 0.105 ± 0.003 0.118 ± 0.004
SF027 1.7 6.44 ± 0.33 3.71 ± 0.28 < LOD 0.072 ± 0.003 < LOD
In Brazil, the 2004 CONAMA Resolution 344 established legal limits for some metals and organic compounds in sediments. This resolution is based on CCME (Canadian Council of Minister of the Environment)
values.27,28 Level 1 from CONAMA corresponds to the
TEL (Threshold Effects Level) index from CCME. Environmental damage is not expected to values below Level 1. The values between Level 1 and Level 2 indicate occasional adverse effects. Level 2 corresponds to the PEL (Probably Effects Level) index of CCME. Values above Level 2 frequently adversely affect the
environment.29 Although such guidelines are not deinitive
indicators of toxicity, they have a high predictability, and the TEL/PEL-type guidelines offer scientiic basis for
comparability.29
For Hg, four samples (BP 086, PTE 023, PTE 031 and SF 019) presented values above Level 1 for Hg at
0.17 µg g-1. For As, the Level 1 value is 5.9 µg g-1; thirteen
samples (BP 036, BP 079, BP 084, BV 142, BV 149, BV 156, PTE 013, PTE 023, PTE 029, PTE 031, PTE 033, SF 027 and SF 033) surpassed this threshold.
Sample area PTE 023 was found to have the highest concentrations of both elements, above Level 2 from
CONAMA (As = 17.0 µg g-1, Hg = 0.486 µg g-1). In a
subsequent sampling of PTE 023, the observed values that exceeded the limits level 2 for both As and Hg were
709 ± 64 µg g-1 and 0.59 ± 0.03 µg g-1, respectively.The
area where this sample was taken is located in the Córrego Rico, where gold mining activities have occurred since the
18th Century. This region has high arsenopyrite contents,
FeAsS.30,31 Frequently, gold is found associated to this
mineral, which explain high As and Hg levels in this place. The samples from BP 036, BP 079, and BP 084 points presented As values between Level 1 and Level 2. Data in 2008 from IGAM (Instituto Mineiro de Gestão das Águas) on the water quality demonstrated that the main contamination sources in these areas (Paraopeba sub-basin) are related to domestic sewage and industrial
efluents.5
The IGAM report also emphasized that BV 142, BV 149, and BV 156 points, located in the Velhas River presents water contamination due to the release of domestic
The Velhas River is the largest tributary, in extension, from the São Francisco River basin. Almost all urban sewage was thrown in the rivers without any treatment until 2001 when the irst sewage treatment station was installed. Nowadays, 60% of urban sewage from the capital city is treated before
being dumped into the rivers.5
The oldest gold mine active in the world, which began in 1834, is located in the Velhas River sub-basin; it is responsible for large residue deposits, mainly containing
As2O3.18 FEAM (Fundação Estadual do Meio Ambiente
- The State Environment Foundation of Minas Gerais) data and IGAM reports show that mining activities have increased As and Hg concentrations in water at levels above the CONAMA limits in some areas of the Velhas River sub-basin. The samples from Baixo Velhas (BV 142, BV 149 and BV 156) presented high As content, related to gold mining in this region.
Deschamps and Matschullat18 accomplished As
measurements in several matrices from the Iron Quadrangle between 1998 and 1999 and the contents found ranged
from 50 to 3200 µg g-1 in the Velhas River sediments, near
the oldest gold mine. In sediment samples from Paracatu,
de Andrade et al.31 found arsenic concentrations up to
1500 µg g-1. Based on last report from IGAM, As and Hg
in water were below the legal values.
Compared to those studies, the results obtained here show high concentrations in certain areas but suggest an overall reduction in As and Hg levels in sediments from the Minas Gerais state.
Results obtained for the certiied reference materials after pseudo-total digestion procedure are showed in Table 4. The results agreed with the certiied reference values at the 95% conidence level for Hg and at the 99% conidence level for As (only NIST 2711) applying the t-Student test. For SRM 1944, arsenic concentration measurements were in the conidence interval, but precision was affected.
High Hg levels were determined for samples from PTE 023 and two other samplings were made in this area. These samples were submitted to a pseudo-total digestion procedure in the inest granulometric fraction (< 0.063 mm). The analyses conirmed previous results
Table 4. Results for arsenic and mercury in standard reference materials after aqua regia pseudo-total digestion procedure
NIST 1944 (New Jersey Waterway Sediment) NIST 2711 (Montana Soil) Certiied value Obtained value Certiied value Obtained value
As / (µg g-1) 18.9 ± 2.8 16 ± 0.1 105 ± 8 89 ± 3
where Hg levels were above those established by CONAMA, as seen in Table 5. Mercury concentrations in
PTE 023 samples were between 0.16 µg g-1 and 2.3 µg g-1.
The results of the sample proile showed highest values in the supericial layer, indicating recent contamination and an irrelevant vertical migration.
Partial extraction procedure
The limits of detection and quantiication for As were
0.06 µg g-1 and 0.19 µg g-1, and for Hg were 0.01 µg g-1 and
0.04 µg g-1, respectively. Results are showed in Table 3. The
Hg contents obtained in the partial extraction were close to the pseudo-total values for almost all samples, except for PTE 023 and SF 015. The As percent composition after the partial extraction procedure ranged from 17% to 93%, compared to the pseudo-digestion. The samples that exceeded the CONAMA Level 2 presented extraction values lower than 40%. It should be noted that high values from pseudo-digestion were related to low values after partial extraction procedure, indicating the low mobility and availability for As in these points.
Minas Gerais soil contains abundant levels of iron oxides and hydroxides, which are known for their high adsorbitivity. Recent data show that As mobility
is reduced by high iron concentration.32-34 Therefore,
it can be presumed that the highest As concentrations obtained correspond to low mobility due to the iron oxide concentration in the soil.
Mercury forms less labile compounds with iron oxides and mainly with sulfur. Hg and sulfur are soft ligands and can form inner-sphere compounds. So, Hg often forms
stable complexes with humic substances.10 Some studies
report the importance of sulides in the control of releasing metals from sediments into the aquatic system. In general, an increase in sulides reduces a metal’s bioavailability to
water low.35 The samples from PTE 023, which presented
the highest As and Hg levels, are located in a region of
naturally occuring high sulides levels.30,31
Samples with low percentages in the partial extraction procedure might be due to partial imobilization of As and Hg from the iron oxides and sulides present in the sediments.
Data from Table 3 was submitted to a Pearson correlation test (P < 0.05 and N = 28). The test showed a positive and signiicant correlation for Hg and As (r = 0.62). This correlation can be explained by occurrence of arsenopyrite, associated with gold. The correlations
between the pseudo-total digestion and 1.0 mol L-1 HCl
extraction procedures were also signiicant, indicating that the diluted acid extraction is eficient for As and Hg in some cases.
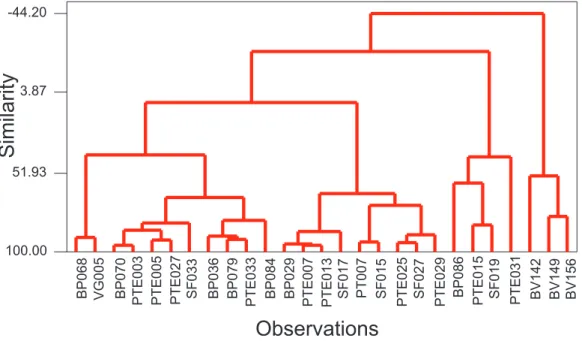
Figure 2 illustrates the dendogram obtained after aqua regia and partial extraction procedures for the samples. With this analyses, a group of samples is formed and linked through similarities. Three groups were observed. The BV’s samples formed one group due to elevated As levels and low mobility. The other groups were formed by samples with contents below Level 2 and by samples that presented high availability to water low.
Direct mercury analysis (DMA)
The DMA instrument uses thermal decomposition for Hg determination. Limits of detection and quantiication for
Hg were 0.005 and 0.0165 µg g-1, respectively. The results
of the reference materials were: NIST 2711 (Montana
Soil), certiied value 6.25 ± 0.19 µg g-1, obtained value
6.51 ± 0.05 µg g-1; IAEA336 (Trace Elements in Lichens),
certiied value 200 ± 40 ng g-1, obtained value 210 ± 6 ng g-1.
The maximum Hg concentration was found in the sample PTE 023, in accordance with wet procedures. All results presented in Table 3 showed good agreement with those obtained after wet sample pretreatment procedures. Solid sampling is advantageous due to minor sample handling and low risks of contamination.
Table 5. Mercury contents in the sediment samples from PTE 023 point after HG AAS determination
Sediment samples Hg / (µg g-1)
HG AAS DMA
PTE023 09/06/2007 supericial 2.30 ± 0.10 2.04 ± 0.06 PTE023 03/06/2008 supericial 0.59 ± 0.03 0.43 ± 0.01 PTE023 08/28/2008 supericial 0.49 ± 0.02 1.21 ± 0.08 PTE023 08/28/2008 (0-30 cm) 0.61 ± 0.01 0.55 ± 0.04 PTE023 08/28/2008 (30-60 cm) 0.25 ± 0.04 0.18 ± 0.03 PTE023 08/28/2008 (60-90 cm) 0.16 ± 0.01 0.19 ± 0.01
Mercury speciation
Chemical species determination is relevant to
bioavailability processes. The PTE 023 sediment samples
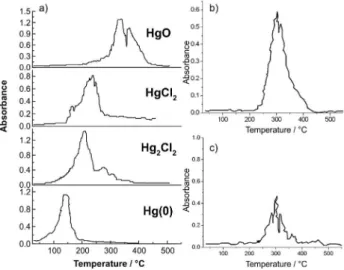
were submitted to TDAAS and the results are shown in Figure 3.
Figure 3a shows thermograms obtained from
Valle et al.35 in simulated samples containing different Hg
species, using the same equipment and under the same conditions used in this work. The Hg(0) begins to be
released between room temperature up to 200 oC, Hg(I)
is released at 100 oC up to 250 oC, and Hg(II) is released
at temperatures above 200 oC until approximately 350 oC.
The Hg bound to humic substances presents peaks at higher
temperatures, above 400 oC. At 600 oC, all of the Hg species
had been completely released. Thus, it is possible to make a qualitative study of the Hg species in solid samples using TDAAS. Representative thermograms obtained to the PTE 023 samples are presented in the Figures 3b and 3c.
In PTE 023 point, four samples were collected in three different periods. One of them was collected in three different depths (0-30 cm, 3-60 cm, 6-90 cm). Ten
thermograms were done, four of them “in natura” samples
and the others dried samples. Only one peak was observed for all of them, indicating that only one species was found. In all the thermograms, this peak occurs at the same
temperature range, between 200 oC and 400 oC. Therefore,
the Hg species present in all of the samples is Hg(II). Over the last three centuries, the area PTE 023 was a gold prospecting area, in which Hg(0) was used to improve the gold extraction eficiency. However, the thermograms presented peaks related to the Hg(II) contamination, indicating that Hg suffered a natural oxidation process over
to the water low.
Conclusions
The aqua regia pseudo-total digestion procedure was a simple and adequate strategy for sediment sample preparation. Results presented high precision and accuracy. The obtained results proved that some areas of the São Francisco Basin are degraded by anthropogenic activities. Thirteen samples demonstrated As levels above CONAMA Level 1, and four samples exceeded the CONAMA Level 2. Three samples exceeded the Level 1 Hg values, and one sample was higher than Level 2. Compared to the earliest research in this region, it is reasonable to conclude that contamination levels have been reduced, probably due to monitoring and inspection activities.
The partial extraction procedure produced results in agreement with those from aqua regia pseudo-total digestion for almost all samples. The partial extraction procedure was simple and fast, giving information about mobility and availability of toxic elements using diluted acid solutions as natural conditions. Therefore, samples with elevated As and Hg levels had low mobility into water low. Results for Hg determination in the samples submitted to wet pretreatment procedures showed good agreement with solid sampling using DMA.
The results obtained by TDAAS showed that only Hg(II) is present in the sediment samples. Hg(0) used in the gold prospection can be partially oxidize to Hg(II) in the environmental conditions, and this fact requires further attention once Hg(II) can be methylated and form more toxic species.
Supplementary Information
Supplementary data are available free of charge at http://jbcs.sbq.org.br as PDF ile.
Acknowledgments
L. M. C., C. C. N. and C. C. W. would like to thank the Conselho Nacional de Desenvolvimento Cientíico e Tecnológico (CNPq) and Fundação de Amparo à Pesquisa do Estado de Minas Gerais (FAPEMIG-ECT479/07) for their inancial support. P. S. R. acknowledges the fellowships provided by FAPEMIG, P. A. S. M. and W. A. D. Jr. acknowledge the fellowships provided by CNPq. Authors are also thankful to CETEC and IGAM for sample collections.
References
1. Atkinson, C. A.; Jolle, D. F.; Simpson, S. L.; Chemosphere
2007, 69, 1428.
2. Altug, G.; Balkis, N.; Env. Monit. Ass.2009, 149, 61. 3. www.ana.gov.br accessed in January 2009.
4. www.ibge.gov.br accessed in January 2009. 5. www.igam.mg.gov.br accessed in March 2009.
6. Salomons, W.; Stigliani, W.; Biogeodynamics of Pollutants in Soils and Sediments: Risk Assessment of Ddelayed and Non-Linear Responses, Springer-Verlag: Heidelberg, 1995. 7. Duffus, J. H.; Toxicologia Ambiental, Ediciones Omega:
Barcelona, 1983.
8. Windmöller, C. C.; Santos, R. C.; Athayde, M.; Palmieri, H. E. L.;
Quim. Nova 2007, 30, 1088.
9. Micaroni, R. C. C. M.; Bueno, M. I. M. S.; Jardim, W. F.; Quim. Nova2000, 23, 487.
10. Issaro, N.; Abi-Ghanem, C.; Bermond, A.; Anal. Chim. Acta
2009, 631, 1.
11. Furutani, A.; Rudd, J. W. M.; Appl. Environ. Microbiol.1980,
40, 770.
12. Murphy, J.; Jones, P.; Hill, S. J.; Spectrochim. Acta, Part B1996,
51, 1867.
13. Paraqueti, H. H. M.; Ayres, G. A.; Almeida, M. D.; Molisani, M. M.; Lacerda, L. D.; Water Res.2004, 38, 1439.
14. Bisinoti, M. C.; Sargentini Jr, E.; Jardim, W. F.; J. Braz. Chem. Soc.2007, 18, 544.
15. http://www.worldish.org/PPA/PDFs/Semi-Annual%20VII/E-6b%20UFSCar%20Metals%20Project%20Technical%20 Report-%20port.pdf acessed in March 2009.
16. http://www.mma.gov.br/conama/ acessed in January 2009. 17. Alloway, B. J.; Heavy Metals in Soils, John Wiley & Sons: New
York, 1990.
18. Deschamps, E.; Matschullat, J.; Arsênio Antropogênico e Natural: Um Estudo em Regiões do Quadrilátero Ferrífero, FEAM: Belo Horizonte, Brasil, 2007. ISBN 978-85-61029-00-5 19. Maher, W. A.; Anal. Chim. Acta1981, 126, 157.
20. Borba, R. P.; Figueiredo, B. R.; Rawlins, B.; Matschullat, J.;
Rev. Bras. Geoc.2000, 30, 558.
21. Deschamps, E.; Ciminelli, V. S. T.; Lange, F. T.; Matschullat, J.; Raue, B.; Schmidt, H.; J. Soils Sediments2002, 2, 216. 22. Larner, B. L; Seen, A. J.; Townsend, A. T.; Anal. Chim. Acta
2006, 556, 444.
23. Larner, B. L; Palmer, A. S.; Seen, A. J.; Townsend, A. T.; Anal. Chim. Acta2008, 608, 147.
24. Durão Jr., W. A.; Palmieri, H. E. L.; Trindade, M. C.; Branco, O. E. A.; Carvalho Fº, C. A.; Fleming, P. M.; Silva, J. B. B.; Windmöller, C. C.; J. Environ. Monit. 2009, 11, 1056. 25. EMBRAPA, Empresa Brasileira de Pesquisa Agropecuária;
Manual de Métodos de Análise de Solo, 2a.ed., EMBRAPA, Centro Nacional de Pesquisa de Solos: Rio de Janeiro, Brasil, 1997. ISBN 85-8586403-6.
26. Meurer, E. J.; Fundamentos de Química do Solo, 3a. ed.,
UFRGS: Porto Alegre, Brasil, 2008.
27. Canadian Council of Ministers of the Environment; Canadian Sediment Quality Guidelines for the Protection of Aquatic Life: Arsenic, In Canadian Environmental Quality Guidelines;
Canadian Council of Ministers of the Environment: Winnipeg, 1999. http://ceqg-rcqe.ccme.ca/download/en/230/ accessed in January 2009.
28. Canadian Council of Ministers of the Environment; Canadian Sediment Quality Guidelines for the Protection of Aquatic Life: Mercury, In Canadian Environmental Quality Guidelines;
Canadian Council of Ministers of the Environment: Winnipeg, 1999. http://ceqg-rcqe.ccme.ca/download/en/241/ accessed in January 2009.
29. Hubner, R.; Astin, K. B.; Herbert, R. J. H.; J. Environ. Monit.
2009, 11, 713.
30. de Andrade, R. P.; Santana Fº, S.; Mello, J. W. V.; Figueiredo, B. R.; Dussin, T. M.; Quim. Nova2008, 31, 1127.
31. de Andrade, R. P.; Figueiredo, B. R.; Mello, J. W. V.; Santos, J. C. Z.; Zandonadi, L. U.; J. Soils Sediments2008, 8, 123. 32. Deschamps, E.; Ciminelli, V. S. T.; Weidler, P. G.; Ramos, A. Y.;
Clays Clay Miner.2003, 51, 197.
33. Mello, J. W. V.; Talbott, J. L.; Scott, J.; Roy, W. R.; Stucki, J. W.;
Environ. Sci. Pollut. Res.2007, 14, 388.
34. Yu, K. C.; Tsai, L. J.; Chen, S. H.; Ho, S. T.; Water Res.2001,
35, 4086.
35. Valle, C. M.; Santana, G. P.; Windmöller, C. C.; Chemosphere
2006, 65, 1966.
S
I
*e-mail: [email protected]
Arsenic and Mercury Mobility in Brazilian Sediments fr
om São Francisco River Basin
Patrícia S. Rezende, Priscila A. S. Moura, Walter A. Durão Jr., Clésia C. Nascentes, Cláudia C. Windmöller and Letícia M. Costa*
Departamento de Química, ICEx, Universidade Federal de Minas Gerais, Avenida Presidente Antônio Carlos, 6627, Pampulha, 31270-901 Belo Horizonte-MG, Brazil