Article
J. Braz. Chem. Soc., Vol. 22, No. 5, 813-819, 2011. Printed in Brazil - ©2011 Sociedade Brasileira de Química
0103 - 5053 $6.00+0.00
A
*e-mail: [email protected]
A Multicommuted Flow System for Dissolution Studies of Captopril in
Pharmaceutical Preparations
Mariana A. Sanchez,a Diogo L. Rocha,a Wanessa R. Melcherta and Fábio R. P. Rocha*,b
aInstituto de Química, Universidade de São Paulo, CP 26077, 05513-970 São Paulo-SP, Brazil
bCentro de Energia Nuclear na Agricultura, Universidade de São Paulo, CP 96,
1340-970 Piracicaba-SP, Brazil
Um procedimento analítico em sistema de análises em luxo com multicomutação é proposto para a determinação de captopril e construção de curvas de dissolução de medicamentos. O método é baseado na reação do fármaco com Cu(II), com posterior complexação de Cu(I) com 4,4’-dicarboxi-2,2’-biquinolina (BQA) e detecção espectrofotométrica. Foi observada resposta linear entre 25 e 300 μmol L-1 captopril, com limite de detecção de 7 μmol L-1 (99,7% de coniança).
O coeiciente de variação (n = 20) e a frequência de amostragem foram 2,2% e 47 determinações por hora, respectivamente, com consumo de 290 μg de BQA e geração de 3,6 mL de resíduo por determinação. Os resultados para 7 amostras de preparações farmacêuticas concordaram com os obtidos pelo procedimento volumétrico de referência com 95% de coniança. Peris de dissolução obtidos com um aparato construído no laboratório foram concordantes com os relatados na literatura, com coeiciente de variação de 1,8% para três replicatas do produto de referência.
A low-based analytical procedure exploiting multicommutation is proposed for captopril determination and the construction of dissolution curves. The procedure is based on the redox reaction between Cu(II) and the drug with the subsequent complexation of Cu(I) with 4,4’-dicarboxy-2,2’-bichinoline (BCA) and spectrophotometric detection. A linear response was observed between 25 and 300 μmol L-1 captopril and the detection limit was estimated as
7 μmol L-1 (99.7% conidence level). The coeficient of variation (n = 20) and sampling rate were
2.2% and 47 determinations per hour, respectively, consuming 290 μg of BCA and generating 3.6 mL of waste per determination. The results for seven pharmaceutical samples agreed with those obtained by the reference volumetric procedure at the 95% conidence level. The dissolution proiles attained with a lab-made dissolution apparatus agreed with those reported in the literature, with a coeficient of variation of 1.8% for three replicates of the reference product.
Keywords:low analysis, multicommutation, dissolution proiles, captopril, spectrophotometry
Introduction
Tablets are the most commonly prescribed dosage forms of pharmaceuticals due to their wide acceptance by patients, the reliability of manufacturing processes and their stability in comparison to other forms.1 During the manufacturing
process, tests must be carried out to ensure the quality of tablets, their administration safety and the bioavailability of the pharmaceutical compounds.2,3 For this reason, assays
should mimic in vivo conditions for the dissolution and absorption of drugs.
Bioavailability studies of pharmaceuticals became usual after the detection of clinical ineficacy and intoxication
cases resulting from the administration of commercial formulations. Apparently harmless changes of excipients can alter dissolution proiles of pharmaceutical preparations, resulting in toxic plasma levels of the drug.4 The drug
release evaluation from solid dosage forms is one of the most important tests. In these assays, the amount of drug dissolved under standardized conditions of temperature, liquid/solid interface and medium composition is quantiied as a function of time.1,5 For this purpose, the analytical
procedures should consume low sample volumes, present a high sampling rate and allow sample processing under rigorously controlled experimental conditions.6,7
conditions (e.g., dissolution medium, total testing time and sampling time).8,9 These equipments are expensive,
fragile and require training to use. The results should be compared with those obtained using the commercially available reference product or its bioequivalent generic.9
Several works reported the implementation of dissolution studies of different drugs in low-based systems.6,7,10,11
Flow analysis provides several advantages when coupled to dissolution apparatus, namely easy interfacing, high sampling rate, real-time monitoring, low cost, simplicity and high portability. This process can be adapted to tablets with rapid or slow releases, making online derivatization, preconcentration, iltration and dilution of the sample feasible.3 Flow systems based on multicommutation
increase system versatility and minimize operational costs, analyst intervention, reagent consumption and waste generation.12
Captopril, 1-[(2S )-3-mercapto-2-methylpropionyl]-L-proline, is an angiotensin-converting enzyme (ACE) inhibitor widely used for the treatment of arterial hypertension and congestive heart failure.11,13 The
official methods for its determination are based on volumetry or chromatography,14 even though several
alternative procedures have been reported in the literature, employing fluorimetry,15 spectrophotometry,13,14,16
chemiluminescence,17 potentiometry18 and indirect atomic
absorption spectrometry.19 These methodologies are usually
time consuming, making the construction of dissolution proiles for solid pharmaceutical forms unfeasible.20
The main goal of this work was to develop a multicommuted flow-based procedure for captopril determination to construct dissolution curves. The procedure was based on the redox reaction between Cu(II) and captopril, followed by quantiication of Cu(I) ions by spectrophotometry in the presence of 4,4’-dicarboxy-2,2’-bichinoline (BCA). Previous works exploited this reaction for the determination of proteins in biological materials,21,22
tannins in beverages23 and uric acid in urine.24
Materials and Methods
Reagents and solutions
All solutions were prepared with deionized water (17.9 MΩ cm-1) and analytical grade chemicals. A
4.0 mmol L-1 CuSO
4 solution was prepared in 0.1 mol L -1
ammonium acetate buffer at pH 7.0 (R1 reagent). The
R2 reagent was prepared by the dissolution of BCA
(Na2C20H10N2O4) in water, yielding a 6.0 mmol L-1
solution. The carrier was a 20 mmol L-1 NH
4OH solution.
Captopril 2.3 mmol L-1 stock solutions were prepared
daily in 0.01 mol L-1 HCl, which is the dissolution medium
recommended by the USP.9 The reference solutions were
prepared by diluting the stock in 0.01 mol L-1 HCl. The
captopril samples (12.5 or 25 mg) were purchased at local drugstores.
Apparatus
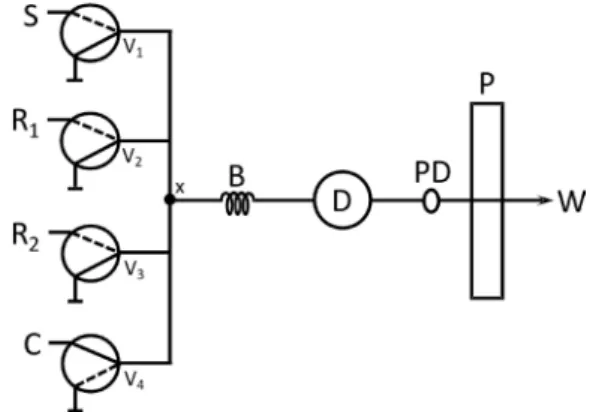
The manifold (Figure 1) was constructed with four computer-controlled three-way solenoid valves (NResearch), polyethylene tubes (0.7 mm i.d.) and an acrylic confluence point. A Pentium 166-MHz microcomputer equipped with an electronic interface (Advantech Corp., PCL-711S) was employed to control the valves and for data acquisition and processing. The electric potential and current required to switch on the devices (12 V and 100 mA, respectively) were supplied by a lab-made electronic interface based on an ULN2803 integrated circuit. The control software was developed in Microsoft Visual BasicTM. Fluid propelling was carried out
by a peristaltic pump (Ismatec, CP 78017-10) equipped with a TygonTM tube. Measurements were taken with a
spectrophotometer (Micronal, B342II) by using a quartz low-cell (1 cm optical path; 80 μL internal volume). The analog output of the spectrophotometer was connected to one of the input ports of the interface for data acquisition. A pulse dampener was designed with a closed polyethylene tube (4 cm long and 1 cm i.d.) to improve the repeatability. The device was vertically positioned, with the inlet at the top and the outlet at the bottom.
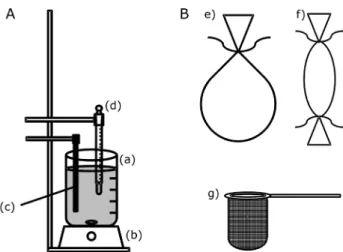
The apparatus employed for the dissolution studies (Figure 2A) was designed to simulate the device and experimental conditions recommended by the USP.9 This
Figure 1. Flow diagram of the multicommuted system for captopril determination and construction of dissolution curves. S = sample; R1 = 4.0 mmol L-1 Cu(II) in NH4Ac buffer (pH 7.0, 0.1 mol L-1); R2 = 6.0 mmol L-1 BCA; C = carrier solution (20.0 mmol L-1 NH
consists of a beaker (a) containing 500 mL of 0.01 mol L-1
HCl (dissolution medium) under constant magnetic stirring (b) and temperature controlled at (37.0 ± 0.5) oC. A relay
(not represented on the scheme) was employed to turn on and off the heater (c) according to the temperature set of the thermostat (d).
Procedures
The dissolution curves were obtained with a multicommuted low system (Figure 1) operated according to the switching course described in Table 1. Aliquots from the dissolution medium were sampled by illing the path between the vessel and joint point x (step 1). The analytical path was washed by the carrier stream (step 2) before the insertion of the sample and reagents. In step 3, aliquots of 80 μL of the sample, and 8 μL of each reagent were sequentially inserted into the reactor coil, exploiting the binary sampling approach12 with 10 sampling cycles
for solution handling. Mixing occurred by dispersion at the interfaces while the sample zone was transported
through a 100 cm reactor coil, being the complex monitored by spectrophotometry at 562 nm. Optimization of experimental conditions was carried out in order to improve sensitivity and precision, with minimum reagent consumption and waste generation. All measurements were based on peak height and made in triplicate. The dissolution assay was carried out individually with four tablets of each sample.
For the dissolution studies, three different materials were evaluated to support the tablets (Figure 2B). One of the supports was made with a ilter paper tied with a polyamide string (e). This support was ixed to the thermometer and kept fully submerged in the dissolution medium during the entire study. The second device was a cellulose ester membrane (12.4-kDa porosity, Sigma, D0530), which was used as a bag and similarly attached to the thermometer (f). Another gadget was made by a polyamide net ixed on a metallic ring (g), which was partially submerged maintain complete contact between the sample and the dissolution medium.
The effect of concomitant species was evaluated by considering the excipients found in commercially available tablets, namely microcrystalline cellulose, starch, lactose, stearic acid, colloidal silicon dioxide, croscarmellose sodium and magnesium stearate. Lactose was the only water-soluble species tested and its effect was evaluated at a concentration 100-fold higher than captopril (7.5 mmol L-1).
For the other compounds, the suspensions were prepared from 0.2 g of the solid in 50 mL of 0.01 mol L-1 HCl in
order to evaluate their effects on adsorption of the analyte. The suspensions were shaken for 15 min and centrifuged for 10 min before measurements.
In order to evaluate the accuracy of the proposed procedure, ifteen tablets of each sample were weighed and inely powdered. An appropriate amount was then suspended in 50 mL of 0.01 mol L-1 HCl so that the inal
captopril concentration was 7.5 mmol L-1 according to the
values on the label. These suspensions were kept under constant stirring for 15 min and then centrifuged for 10 min. Measurements were carried out with the supernatant.
Figure 2. (A) Apparatus for dissolution studies. (a) recipient containing the dissolution medium (0.01 mol L-1 HCl); (b) magnetic stirrer; (c) heating device with thermostat (d) set to (37.0 ± 0.5) oC; (B) tablet supports evaluated. (e) ilter paper tied with polyamide string; (f) dialysis membrane with both borders tied with polyamide string; (g) polyamide net ixed on a metallic ring, which was supported at the edge of dissolution medium container.
Table 1. Valves switching sequence for captopril determinationa
Step Description V1 V2 V3 V4 time (s)
1 Sampling 1 0 0 1 3.3
2 Analytical path washing 0 0 0 0 30.0
1 0 0 1 2.0
3 Sample and reagent insertionb 0 1 0 1 0.2
0 0 1 1 0.2
4 Transport of sample zone and measurement 0 0 0 0 160.0
The iodimetric procedure recommended by the USP9
was used as the reference for sample analyses. It is based on the titration of captopril in an acidic medium containing excess of iodide with iodate as the titrant and starch as the indicator.
Results and Discussion
The sulfhydryl group bonded to molecules such as captopril can reduce copper(II) ions (reaction 1), and Cu(I) reacts with BCA (reaction 2) to yield a stable purple complex.25 The analyte concentration can be then indirectly
determined by spectrophotometry.
2 Cu2+ + 2 C
8H14O3NC–SH → 2 Cu + + (C
8H14O3NC–S–)2 + 2 H + (1)
2 BCA2−
+ Cu+ [Cu(BCA) 2]3
−
(2)
System optimization
The multicommuted low system showed in Figure 1 was employed for captopril determination and construction of the dissolution curves. A summary of the ranges of variables studied in the optimization step and the selected values is presented in Table 2.
The concentration and volume of the Cu(II) solution were critical for the development of the flow-based analytical procedure. Although an excess of the metal ion is required, formation of the green insoluble salt Cu(BCA) can lead to solid deposition in the reactor and low cell, thus causing memory effects and baseline drift.24 The
analytical signal increased with the Cu(II) concentration up
to 4.0 mmol L-1. For higher Cu(II) concentrations, the blank
signal increased about 135 times in view of precipitation. The analytical signal reached a plateau from 8 μL of R1
without signiicant variation of the blank value. In order to avoid the formation of Cu(BCA) during the sampling step, the Cu(II) solution was prepared in 0.1 mol L-1 ammonium
acetate medium at pH 7.0, which provided acetate ions and a low concentration of free ammonia yielding stable complexes with Cu(II).24 In addition, a NH
4OH solution was
used as carrier to avoid solid deposition in the analytical path. This strategy was previously employed in the low systems for tannin23 and uric acid24 determinations, and
successfully overcame this drawback. In this work, the baseline drift was evaluated through 100 measurements using different NH4OH concentrations. Baseline drift
measured as absorbance was 0.030 with 7.5 mmol L-1
NH4OH and negligible with 20.0 mmol L-1, which was
selected for further studies.
The volume and concentration of BCA were optimized to guarantee reagent excess with minimum consumption. The volume of the complexing solution did not affect signiicantly the analytical or blank signals. Absorbance values increased with BCA concentration up to 6.0 mmol L-1, without affecting the magnitude of the blank.
In order to minimize sample dispersion, the sample volume was varied from 40 to 140 μL. The effect was signiicant up to 125 μL; however for a sample volume of 80 μL, 75% of the steady state signal was achieved, ensuring a 6-fold excess of copper and a lower washing time.
Variation of pH from 6.0 to 8.0 did not affect the analytical response signiicantly and pH 7.0 was chosen due to buffering capacity of NH4Ac. These results agreed with
the obtained in a previous work,24 in which the variation
of pH in the same range was not critical for copper redox reaction and formation of [Cu(BCA)2]3–.
The analytical signal increases with the number of sampling cycles due to the effect of the total volume on the dispersion of the sample zone.12 The effect of this parameter
was evaluated by reducing sample and reagent volumes by half (R1 = R2 = 4 μL; sample = 40 μL) in order to improve
mixing at the interfaces. The effect was signiicant for up to 10 sampling cycles yielding an analytical signal 10-fold higher than that achieved with one sampling cycle. The reactor coil length, which affects both residence time and sample dispersion, was ixed at 100 cm as a compromise. By considering the total sample zone volume (480 μL) and the reactor volume (500 μL), the measurements were carried out close to the ininite volume condition (dispersion coeficient close to 1).
The low rate was evaluated from 1.5 to 3.0 mL min-1
and 2.5 mL min-1 was selected due to the difference between
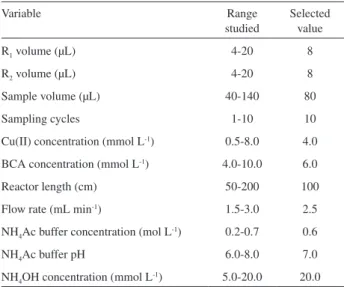
Table 2. Ranges of the studied variables and optimized conditions for captopril determination
Variable Range
studied
Selected value
R1 volume (μL) 4-20 8
R2 volume (μL) 4-20 8
Sample volume (μL) 40-140 80
Sampling cycles 1-10 10
Cu(II) concentration (mmol L-1) 0.5-8.0 4.0
BCA concentration (mmol L-1) 4.0-10.0 6.0
Reactor length (cm) 50-200 100
Flow rate (mL min-1) 1.5-3.0 2.5
NH4Ac buffer concentration (mol L-1) 0.2-0.7 0.6
NH4Ac buffer pH 6.0-8.0 7.0
the analytical and blank signals. For this low rate, the sample residence time was estimated as 12 s.
Analytical features and application
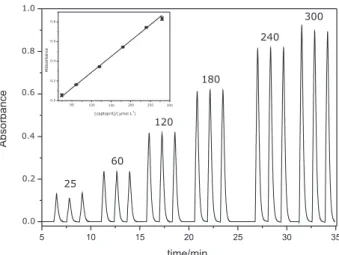
A calibration curve was constructed (Figure 3) within the range 25 to 300 μmol L-1, which showed a linear relation
between absorbance (A) and captopril concentration (c, μmol L-1), represented by the equation A = −3.40×10⁻²
+ 3.20×10³ c (r = 0.999). The detection limit was estimated
as 7 μmol L-1 (99.7% conidence level) and the repeatability
was evaluated with a 120 μmol L-1 captopril reference
solution, yielding a coefficient of variation of 2.2% (n = 20). The consumptions of copper sulfate and BCA were estimated as 80 μg and 290 μg, respectively, which generated 3.6 mL of waste per determination. The unit cost was estimated as US$ 0.03.
The effect of the execipients commonly present in captopril formulations was evaluated. The analytical signal variations were lower than 5% for concomitant amounts higher than those expected in pharmaceutical preparations.
The samples were analyzed by the proposed and reference9 procedures and the results are shown in Table 3.
The results obtained by both methodologies agreed at the 95% conidence level. Besides this, the developed procedure showed advantages over the reference one,9
such as a higher sample throughput and 85% lower waste generation.
Dissolution studies
For the dissolution studies, three types of tablet supports were compared as schematically shown in Figure 2, being
the results presented in Figure 4. The best results were obtained with the polyamide net (Figure 4a). The time required to reach the dissolution plateau was longer for the cellulose ester membrane (Figure 4b) and the ilter paper (Figure 4c) because the process was limited by diffusion of the analyte through the material instead of by the rate of dissolution. The process was slowest for the ilter paper and the concentration increased linearly with time. The supports constructed with ilter paper and the cellulose membrane could be used to detect differences between samples and unconformities in relation to the reference product. However, the polyamide net support was selected for the dissolution studies to avoid the dependence on diffusion and to maintain concordance with the standard procedures recommended by the Pharmacopoeias.9,26
Transient signals obtained with the proposed system are shown in Figure 5 as well as three dissolution curves for the reference pharmaceutical formulation. The results were highly reproducible, indicating that the proposed system is suitable for the real-time monitoring of drug dissolution. The obtained dissolution curves of captopril
Figure 3. Transient analytical signals for captopril reference solutions measured in triplicate. Numbers at the top of peaks indicate concentrations in μmol L-1. The inset shows the correspondent calibration curve.
Table 3. Mean values and uncertainties (n = 3) for captopril determination by proposed and reference procedures
Sample Proposed procedure (mg per tablet)
Reference procedure9 (mg per tablet)
1 10.5 ± 0.2 11.3 ± 0.1
2 11.5 ± 0.2 12.1 ± 0.1
3 11.3 ± 0.2 11.7 ± 0.1
4 22.2 ± 0.1 23.4 ± 0.1
5 23.5 ± 0.1 23.9 ± 0.1
6 23.6 ± 0.3 23.4 ± 0.1
7 26.5 ± 0.2 24.4 ± 0.1
samples presented proiles in agreement with those obtained in previous works.20,27 The time for complete solubilization
was estimated as 7.4 min, which is close to that reported by Tomšůet al.20 (7.2 min) who used a commercially
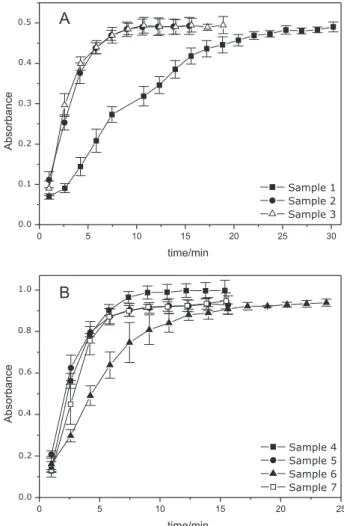
available dissolution apparatus. For the other samples, the mean concentration values presented in Figure 6 show a striking difference between the dissolution proile of sample 1 in relation to samples 2 and 3 (Figure 6A). It should be emphasized that the latter depicts the reference product. In the case of formulations containing 25 mg (Figure 6B), a slight difference was observed between sample 6 and the other samples. The differences in the rate of dissolution are due to the presence of the excipient croscarmellose, found only in samples 1 and 6. The mean times required for complete dissolution were 22.1 (sample 1), 7.3-7.5 (samples 2-4), 5.9 (sample 5), 12.4 (sample 6) and 5.8 (sample 7). It is important to note that, according to the USP, at least 80% of labeled amount of captopril should be dissolved in 20 min.9 Although all of the analyzed samples
met this requirement, the dissolution proiles of some samples were quite different from the reference preparation, which could result in different in vivo performances.
In comparison to the proposed procedure, the chromatographic method developed by Azevedo and co-workers27 is time consuming (5 min per measurement),
which is a drawback for dissolution studies. Besides this, a high amount of toxic waste was generated due to the use of methanol in the mobile phase (ca. 3 mL per determination) and the aliquots of dissolution medium containing the dissolved drug were collected manually, increasing the susceptibility to errors. Another procedure for the construction of dissolution proiles exploited a low system with derivative spectrophotometry.20 Mathematical
data treatment is required to correct interference from concomitant species. The proposed procedure is an alternative to these studies due to its good accuracy and precision, high sampling rate, as well as low reagent consumption and waste generation. The quantiication limit is suitable for measurements at the initial stages of the dissolution curves while samples containing higher amounts of the drug can be diluted online24,28 for
measurements during the inal stages.
Conclusions
This work describes a multicommuted flow-based analytical procedure for captopril determination which exploits the reduction of Cu(II) by the sulfhydryl groups of the drug, followed by complexation with BCA and spectrophotometric quantiication. The developed procedure presents favorable analytical features such as improved precision and low reagent and sample consumption, which are extremely important for experiments involving
Figure 5. Dissolution curves for reference captopril tablets with the lab-made dissolution system showed in Figure 2. The inset shows transient analytical signals for one sample.
quality control of pharmaceutical preparations, including dissolution studies. The results of captopril determination in commercial samples agreed with those obtained by the time-consuming reference volumetric procedure. For dissolution curves construction, three different sample supports were evaluated; the polyamide net was chosen because the process was not limited by diffusion of the dissolved drug. The proposed procedure was effective at detecting nonconformities for some samples that presented different dissolution proiles and thus time to achieve the steady state condition. The lab-made apparatus is then very suitable for dissolution studies of pharmaceutical preparations due to the high repeatability between replicates, agreement with results reported in the literature and the low cost of the devices.
Acknowledgments
The authors acknowledge fellowships and inancial support from the Brazilian agencies Conselho Nacional de Pesquisa e Desenvolvimento (CNPq) and Fundação de Amparo à Pesquisa do Estado de São Paulo (FAPESP).
References
1. Paakkunainen, M.; Matero, S.; Ketolainen, J.; Lahtela-Kakkonen, M.; Poso, A.; Reinikainen, S. P.; Chemom. Intell. Lab. Syst.2009, 97, 82.
2. Chowhan, Z. T.; Amaro, A. A.; Chow, Y.P.; Drug Dev. In. Pharm. 1982, 8, 145.
3. Castro, M. D. L.; Valcárcel, M.; J.; Pharm. Biomed. Anal.1990, 8, 329.
4. Storpirtis, S.; Consiglieri, V. O.; Farm. Bioquim. Univ. S. Paulo 1995, 31, 63.
5. Legnerová, Z.; Huclová, J.; Thun, R.; Solich, P.; J. Pharm. Biomed. Anal.2004, 34, 115.
6. Solich, P.; Polydorou, C. K.; Koupparis, M. A.; Efstathiou, C. E.; Anal. Chim. Acta2001, 438, 131.
7. Vranic, E.; Icardo, M. C.; Calatayud, J. M.; J. Pharm. Biomed. Anal.2003, 33, 1039.
8. Melia, C. D.; Davis, S. S.; Aliment. Pharmacol. Therap.1989, 3, 513.
9. The United States Pharmacopoeia, 30th ed.; The United States Pharmacopoeial Convention: Rockville, 2007.
10. Koupparis, M.; Macheras, P.; Reppas, C.; Int. J. Pharm.1984, 20, 325.
11. Çomoğlu, T.; Gönül, N.; Şener, E.; Dal, A. G.; Tunçel, M.; J. Liq. Chromatogr. Relat. Technol.2006, 29, 2677.
12. Rocha, F. R. P.; Reis, B. F.; Zagatto, E. A. G.; Lima, J. L. F. C.; Lapa, R. A. S.; Santos, J. L. M.; Anal. Chim. Acta2002, 468, 119.
13. Suarez, W. T.; Madi, A. A.; Figueiredo-Filho, L. C. S.; Fatibello-Filho, O.; J. Braz. Chem Soc.2007, 18, 1215.
14. Schmidt Jr., E.; Melchert, W. R.; Rocha, F. R. P.; J. Braz. Chem. Soc.2009, 20, 236.
15. Cavrini, V.; Gatti, R.; Roveri, P.; Cesaroni, M. R.; Analyst1988, 113, 1447.
16. Albero, M. I.; Sánchez-Petreño, C.; García, M. S.; Ródenas, V.; J. Pharm. Biomed. Anal.1993, 11, 887.
17. Economou, A.; Themelis, D. G.; Theodoridis, G.; Tzanavaras, P. D.; Anal. Chim. Acta2002, 463, 249.
18. Ribeiro, P. R. S.; Santini, A. O.; Pezza, H. R.; Pezza, L.; Ecl. Quim.2003, 28, 39.
19. El Walily, A. F. M.; Razak, O. A.; Belal, S. F.; Bakry, R. S.; J. Pharm. Biomed. Anal.1999, 21, 439.
20. Tomšů, D.; Icardo, M. C.; Calatayud, J. M.; J. Pharm. Biomed. Anal.2004, 36, 549.
21. Smith, P. K.; Krohn, R. I.; Hermanson, G. T.; Mallia, A. K.; Gartner, F. H.; Provenzano, M. D.; Fujimoto, E. K.; Goeke, N. M.; Olson, B. J.; Klenk, D. C.; Anal. Biochem.1985, 150, 76. 22. Kessler, R. J.; Fanestil, D. D.; Anal. Biochem.1986, 159, 138. 23. Moya, H. D.; Dantoni, P.; Rocha, F. R. P.; Coichev, N.;
Microchem. J.2008, 88, 21.
24. Rocha, D. L.; Rocha, F. R. P.; Microchem. J.2010, 94, 53. 25. Hill, H. D.; Straka, J. G.; Anal. Biochem.1988, 170, 203. 26. Brazilian Pharmacopoeia, 4th ed., Atheneu: São Paulo, Brazil,
1996.
27. Azevedo, R. C. P.; Ribeiro, G. P.; Araújo, M. B.; Braz. J. Pharm. Sci.2008, 44, 261.
28. Rocha, F. R. P.; Infante, C. M. C.; Melchert, W. R.; Spectrosc. Lett.2006, 39, 651.
Submitted: September 9, 2010
Published online: January 27, 2011