Article
J. Braz. Chem. Soc., Vol. 24, No. 6, 1057-1063, 2013. Printed in Brazil - ©2013 Sociedade Brasileira de Química
0103 - 5053 $6.00+0.00
A
*e-mail: [email protected], [email protected]
Phonon Confinement Model to Measure the Average Sizes of Anatase Nanoparticles
Synthesized by a Solvothermal Method Using H
2O
2Bartolomeu C. Viana,*,a Juliana Sousa Gonçalves,a Valdemir dos Santos,b
Maria Rita de M. C. Santos,a Elson Longo,c Francisco E. P. Santos,a and
José Milton Elias de Matos*, a
aLIMAV/Centro de Ciências da Natureza, Departamento de Química and Departamento de Física,
Universidade Federal do Piauí, Campus Ministro Petrônio Portela, 64049-550 Teresina-PI, Brazil
bLIEC, Departamento de Química, Universidade Federal de São Carlos,
CP 676, 13565-905 São Carlos-SP, Brazil
cLIEC, Departamento de Físico-Química, Instituto de Química, Universidade Estadual Paulista,
CP 355, 14801-907 Araraquara-SP, Brazil
Neste trabalho, nanopartículas de dióxido de titânio (TiO2) cristalino, com um tamanho de
cristalito médio (e.g., 8 nm) e área de superfície (e.g., 192 m2 g−1) variáveis, foram sintetizadas
em fase anatase pura, utilizando H2O2 como agente de redução da taxa de hidrólise dos íons de
titânio, em solução de isopropanol (IP) como meio de reação. As nanopartículas de TiO2 foram
caracterizadas por meio das técnicas de difratometria de raios X de pó (XRD), espectroscopia Raman e microscopia eletrônica de transmissão (TEM). A alteração dos parâmetros de síntese permitiu o controle do tamanho das nanopartículas e evitou o processo de coalescência. Foi determinada uma dependência entre o número de onda Raman e o tamanho dos nanocristais, o que é bastante útil para uma rápida verificação do tamanho de nanocristais de TiO2.
In this work, crystalline titanium dioxide (TiO2) nanoparticles with variable average crystallite
sizes (e.g., 8 nm) and surface areas (e.g., 192 m2 g−1) were synthesized in pure anatase phase using
H2O2 to reduce the hydrolysis rate of the titanium ions. An isopropanol (IP) solutionwas employed
as the reaction medium. The TiO2 nanoparticles were characterized by powder X-ray diffraction
analysis (XRD), Raman spectroscopy and transmission electron microscopy (TEM). By changing the synthesis parameters it was possible to control nanoparticle size and avoid the coalescence process. A dependence of the Raman wavenumber on the nanocrystal sizes was determined, which is quite useful for a quick check of the size of TiO2 nanocrystals.
Keywords: anatase, nanoparticles, solvothermal method, H2O2, Raman spectroscopy.
Introduction
Titanium dioxide (titania, TiO2) is used in different environmental-related applications, such as photocatalytic degradation for purification of polluted air and wastewater treatment.1,2 Other technological applications of TiO
2 are
in pigments, wet-type solar cells,3 sensors,4 photocatalysts5
and electronic material.6
There are three main crystallographic forms of TiO2: rutile (tetragonal), anatase (tetragonal), and brookite (orthorhombic).7,8 Rutile is thermodynamically stable and
the other two forms are metastable.9 The anatase form is
very important because it has been used in photocatalysis and various other applications with good efficiency.10
Various methods for synthesizing anatase TiO2 have
been extensively described in the scientific literature including sol-gel, precipitation, aerosol synthesis and solvothermal techniques, among others.9,11,12,13 In some of
influence on the reaction process but they are relatively easy to control, and the cost is low. Some of the advantages of the solvothermal method over other preparation techniques include the purity, homogeneity and stoichiometry control of the obtained particles.
The synthesis of TiO2 nanocrystals also allows the
investigation of size-induced effects such as the softening and broadening of Raman modes, lattice expansion and shift in the optical absorption band edge.14 The softening
and broadening of the Raman allowed modes are directly correlated with the nanocrystal size, so that Raman spectroscopy can be used to readily estimate the average size of TiO2 nanocrystals.14,15
In this study, the synthesis of anatase titanium dioxide nanoparticles employing different reaction parameters is reported. Hydrogen peroxide (H2O2) was
used for slowing the hydrolysis rate of the titanium ions in solution. Hydrogen peroxide is an ideal environmentally friendly solvent and oxidant, and has been widely used in the synthesis of nanostructured inorganic materials.16
Considering that the synthesis of TiO2 nanocrystals is based
on a nucleation and growth process, the presence of H2O2
modifies crystallization by increasing the nucleation rate. The presence of peroxides can inhibit the hydrolysis of the titanium ions in solution (in fact a titanium oxyanion). As a result, a colloidal dispersion with a crystallite size smaller than that obtained in the absence of H2O2 was obtained.
Moreover, by analyzing the Raman data we determined an empirical relationship that correlates the Raman frequency with the anatase nanocrystal diameter. The Raman scattering data is analyzed based on the phonon confinement model.17 This is of practical interest for using
Raman spectroscopy as a quick check of TiO2 nanocrystal
sizes. This evaluation is readily available, non-destructive, does not require any special preparation of the sample and can be applied to different kinds of TiO2-based samples.
Experimental
All chemicals (reagent grade) were used as received, without further purification processes.
Titania Nanoparticle Synthesis
Synthesis with variation of time and temperature
Titania nanoparticles were produced by mixing 2.5 mL of titanium isopropoxide (TIP, Ti[OCH(CH3)2]4, > 99%,
Acros Organics (Pittsburg, USA)) and 8.0 mL of hydrogen peroxide solution (H2O2 10% v/v, > 99%, Acros Organics)
diluted in 50 mL of isopropanol (IP, 99.5%, Vetec (Duque de Caxias, Brazil)). The solution was poured into an
autoclavable bottle and was then placed in a regular furnace. The TiO2 nanocrystals were prepared using different times
(6.0, 12, 24 and 72h at 100 oC) and temperatures (80, 90
and 100 °C for 72h of reaction).
Synthesis with variation of pH
Titania nanoparticles were produced by mixing 2.5 mL of titanium isopropoxide and 8.0 mL hydrogen peroxide solution diluted in a mixture of H2O (25 mL)/isopropanol
(25 mL). The solution was poured into an autoclavable bottle and was then placed in a regular furnace at 100 oC
for 72h. The TiO2 nanocrystals were prepared using
different pHs (2.0, 7.0 and 12) controlled by addition of HCl or NaOH.
Sample Calcination
In the study of grain size as a function of calcination temperature, the sample powders produced by solvothermal reaction for 72h at 100 ºC were heated in the temperature range from 100 to 900 ºC. The calcination was performed in a muffle furnace in which the heating rate was equal to 10 ºC min−1. Samples were kept at the selected temperatures
for 3h.
Characterization
X-Ray diffraction (XRD) patterns were recorded with a Rigaku diffractometer (D-Max 2500PC, Japan), employing Cu-Kα radiation in the 2θ range from 5° to 75° and a scan
rate of 0.2 degree min-1. The surface area was determined by
the BET multi-point method using a Micromeritics ASAP 2000 equipment (Norcross, USA) for analysis of adsorption/ desorption. The pH of the solutions was measured with a digital pH meter (Sentron Model 1001 pH System (Roden, Netherlands)). For the transmission electron microscopy (TEM) measurements, a Philips microscope model CM200 (Eindhoven, Netherlands) was used with 200 kV of voltage acceleration. A drop of the aqueous suspension was deposited on a carbon-covered copper grid. Raman spectra were obtained using a Bruker RFS-100/S FT-Raman spectrometer (Ettlingen, Germany). All measurements in this work were made at room temperature.
Results and Discussion
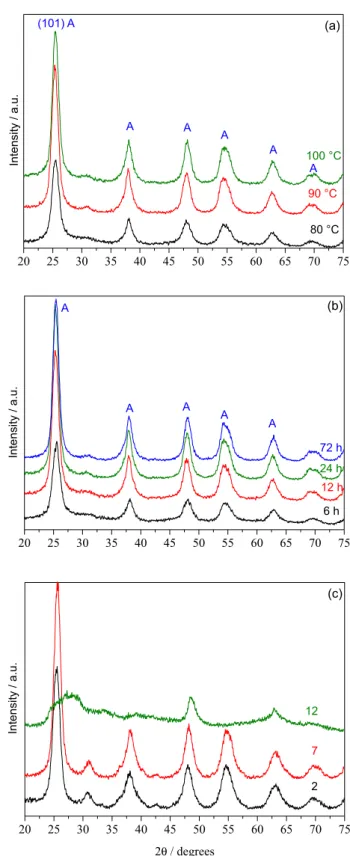
In this solvothermal synthesis, crystalline powders were produced. Neither rutile nor brookite phases were observed in the XRD patterns shown in Figure 1a and 1b, thus indicating that the obtained TiO2 nanoparticles are a
structure of the TiO2 nanoparticles was not affected by
changing the reaction temperature and time. Thus, pure anatase nanoparticles were obtained without annealing.
Figure 1c shows that the sample produced in alkaline pH 12 has an XRD pattern of a not well crystallized rutile phase. By increasing the reaction temperature and time, the obtained anatase samples presented a much better crystallization. The line width of the diffraction peaks suggests that the obtained anatase TiO2 is nanometric
because the peaks are very large.
An estimation of the average crystalline size (D) of anatase phase TiO2 particles can be made by using the
well-known Scherrer equation, D = kλ/B cosq, where k is the constant related to the shape of the crystallites and the indices of the reflecting plane (anatase 101 diffraction peak). Based on Scherrer’s equation, we calculated, as shown in Figure 1a, 1b and 1c, the average sizes of the anatase nanoparticles, thus obtaining 7.0, 7.5 and 6.1 nm for samples prepared at 80, 90 and 100 ºC, respectively. The average sizes of the particles synthesized by varying the reaction time and pH were also calculated, thus giving 7.8, 7.4, 9.3 and 13.1 nm for samples heated during 6, 12, 24 and 74h and 35, 10 and 22 nm for samples prepared at pH equal to 2, 7 and 12, respectively.
Figure 2 shows that TiO2 nanoparticles remained in the
anatase phase up to about 700 ºC; after this temperature, a transition phase to rutile was initialized. The anatase nanoparticle average sizes were calculated, based on Scherrer’s equation, for each calcination temperature (see Table 1).
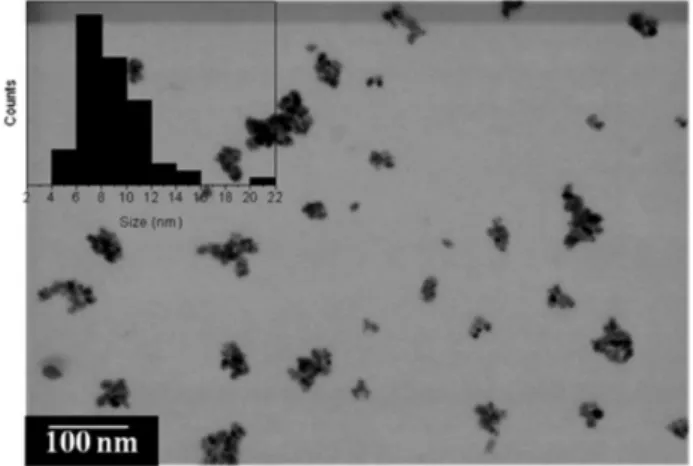
The morphology and average size of some synthesized pure nanocrystalline anatase TiO2 were investigated in
detail by transmission electron microscopy (TEM) as a function of the reaction parameter. Figure 3 shows the TEM micrograph of the anatase TiO2 samples prepared at 100 ºC
by solvothermal treatment for 72h. The TEM images of the samples show an irregular spherical shape. The average diameter of the nanocrystals was estimated by inspection to be about 8.8 nm, as shown in the inset of Figure 3 below.
In order to further characterize the crystalline phase
and sizes of the TiO2 samples, Raman measurements
were performed. Before discussing the Raman spectra of the TiO2 nanocrystals, we briefly recall the vibrational
properties of bulk anatase and rutile TiO2. The anatase
(rutile) phase is tetragonal with two formulas per unit cell, belonging to the space group D4h
19 (D 4h
14). Standard
group theory analysis suggests that the Raman active modes are distributed into the irreducible representations as A1g+2B1g+3Eg and A1g+B1g+B2g+Eg for anatase and
rutile, respectively.18 The spectral signatures of anatase and
rutile are distinct and Raman spectroscopy can be used for
Figure 1. X-ray diffraction patterns recorded for TiO2 samples prepared with different reaction (a) temperatures (80, 90 and 100 °C for 72h), (b) times (6.0, 12, 24 and 72h at 100 °C) and (c) pHs (2.0, 7.0 and 12 at 100 °C for 72h)
unambiguously identifying them. The Raman spectrum recorded for TiO2 samples obtained with variable parameters
143 cm−1 and four other bands at 197, 399, 513 and 639 cm−1,
which are from the optical vibration modes belonging to the Eg(ν6), Eg(ν5), B1g(ν4), A1g+B1g(ν3+ν2) and Eg(ν1) irreducible
representations.15 These spectra can be assigned to the
anatase phase without the presence of the rutile or brookite phases,16 in agreement with the XRD analysis. The two
most intense peaks located at about 143 and 639 cm−1 are
the spectral signatures of anatase. However, the TiO2 sample
produced in alkaline pH 12 shows (see Figure 4c) that the predominant phase is rutile, since the most intense modes are located at 451 and 615 cm−1.15
It is clear that the vibrational mode features (wavenumber, peak width and relative intensity) associated
with the modes assigned to TiO2 nanocrystals do change as
a function of reaction parameters. The lowest frequency Eg
mode experiences an upshift and becomes broader as the reaction time, temperature and pH decrease (see the inset to Figures 4a, 4b and 4c), for example as the nanocrystal size decreases. This is a size-induced phenomena observed in nanocrystals and it has been described based on a phonon confinement model.17 The lack of long-range order in
nanocrystals breaks down the q~0 selection rule valid for a first-order Raman scattering. Broad and asymmetric modes are observed because phonons with q ≠ 0 are also allowed to contribute to the Raman profile.
The Raman profile is not a Lorentzian curve and it depends on the nanocrystal size. The model used for fitting the Raman profile yields the following Equation 1:
(1)
where Γ
0 is the linewidth of the Raman peak and ω(q) is
the phonon dispersion curve. For spherical nanocrystals,
the equation is: , where d stands for
the nanocrystal diameter.17 The integration in Equation 1
is performed over the Brillouin zone of bulk TiO2. The
phonon confinement is evident for the lowest frequency Eg
mode located at about ω
0 = 143 cm−1 for bulk anatase TiO2
in this work. For simplicity, we approximated the phonon dispersion of this mode using a linear chain model, e.g., (18) ω(q) = ω
0 + 28[1 – cos(0.3768q)].
19 As the nanocrystal
size gets smaller the phonon confinement involves large q values and the maximum of the Raman peak follows the same trend for ω(q) that is positive in the case of the E
g
mode for bulk anatase TiO2.
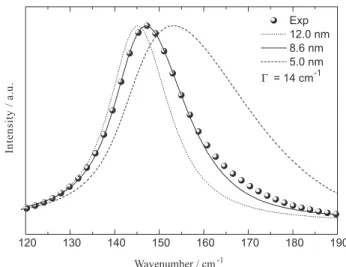
In Figure 5 we plot the Raman profile of the Eg mode
according to Equation 1 for 12 (dashed line), 8.3 (solid line) and 5 nm (dotted line) diameters and considering
Γ
0 = 16 cm
−1. The experimental data (solid circles) for the
sample obtained at 100 ºC for 72h were best described by the solid line in which the nanocrystal size was estimated to be 8.3 nm. We can see that the size estimated by the Raman measurement is in better agreement with the TEM image than with that estimated by XRD (not shown here). By adjusting the experimental data for the other samples we have obtained the nanocrystal diameter as a function of
Figure 3. TEM image of TiO2 nanocrystals obtained by solvothermal
method at 100 ºC and 72h of reaction. The inset shows the size dispersion curve.
Table 1. Average crystallite sizes (dXRD) of calcined TiO2 nanocrystals determined by the use of Scherrer’s equation applied to the anatase (101) diffraction
peak. The sample powders were produced by solvothermal reaction for 72h at 100 ºC
T / oC 100 200 300 400 450 500 600 700
dXRD / nm 6.1 6.6 − 8.5 9.4 11.4 bulk bulk
Figure 2. XRD patterns of TiO2 samples submitted to calcination. The sample powders were produced by solvothermal reaction for 72h at 100 ºC.
Figure 4. Raman spectra of TiO2 samples recorded with different reaction (a) temperature (b) time and (c) pH. The inset shows the shift of the Eg mode at 145 cm−1 as a function of nanocrystal sizes, which in turn depend
on the reaction parameters.
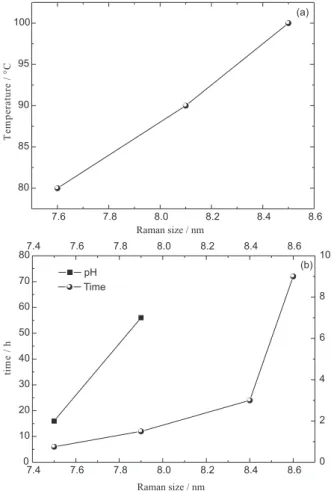
the reaction time, temperature and pH. The obtained results are shown in Figure 6. It can be seen in Figure 6a that the decreasing reaction temperature promotes the reduction
of the TiO2 nanoparticles average sizes. Moreover, in
Figure 6b, the decreasing reaction time also promotes the TiO2 nanoparticle size decrease. Regarding the reaction pH,
which is controlled by addition of either HCl or NaOH, we produced anatase nanoparticles in pH 2 and 7 with 7.5 and 7.9 nm grain sizes, respectively. The estimate of the TiO2 nanocrystal diameter through Raman spectroscopy is
important because this method is fast and it is not necessary to prepare the TiO2 nanocrystals for analysis. Based on the
average sizes obtained by the Raman measurements, we can state that the mechanisms of crystal growth are influenced by the reaction parameters and presence of hydrogen peroxide. In the presence of H2O2, the starting material
is titanium peroxide, the OH− concentration around Ti4+
decreases, and the nucleation rate of Ti(OH)x slows down.
Figure 7 shows the Raman spectra of calcined samples. We can observe that TiO2 nanoparticles remained in the
anatase phase up to about 700 ºC. After this temperature, a transition phase to rutile occurred, confirmed by XRD measurements (as shown above). The narrowing and red shift of the Eg peak with rising calcination temperatures may
show that the increasing size of the anatase nanoparticles is promoted by calcination. Based on the phonon confinement model, the anatase nanoparticle average sizes were calculated for each calcination temperature (see Table 2) up to the anatase-rutile transition phase. Sample calcination promoted the coalescence of the anatase nanoparticles that led to increasing grain sizes.
The discrepancies between the nanocrystal sizes obtained by TEM, Raman, and X-ray diffractometry are inherent to the different phenomena involved in these techniques (Table S1).
Figure 5. Size dependent Raman scattering profile of the lowest frequency Eg mode. The solid points stand for the experimental data resulting from the
The changes in lattice parameters and different strain levels along the nanoparticle induce small changes in position and
Figure 6. TiO2 nanocrystal sizes as a function of the reaction parameters as obtained from Raman data.
Figure 7. Raman spectra of TiO2 samples submitted to calcination. Sample powders were produced by solvothermal reaction for 72h at 100 ºC. The inset shows the wavenumber red shift as a function of calcination temperature.
also broaden the peak, which in turn affects the estimation of the nanocrystal size decrease. The direct observation of the nanoparticle by TEM is the most effective method for determining the average nanoparticle size, but the cost and availability of the TEM equipment and the agglomeration of particles can prevent its appropriate use and causes contrast at the interfaces, preventing their direct observation and a precise analysis of their size. Thus, estimates of anatase nanocrystal size using Raman spectroscopy are useful and the results obtained regarding the nanocrystal sizes should be interpreted as being values close to the true average diameter size of the particle distribution. Also, the differences in the values are much smaller than the width of the TEM particle size distribution.
Conclusions
Summarizing, this study reports on the structural and vibrational properties of TiO2 nanocrystals synthesized by a
solvothermal method with different reaction parameters and using H2O2 in the solution. X-ray diffraction and transmission
electron microscopy analyses were employed as structural characterization tools and revealed that TiO2 nanocrystals
were grown in the anatase phase. The nanocrystal sizes exhibited a linear behavior as a function of the increasing values of the reaction parameters. Both softening and broadening of the Raman modes confirmed the very small size of the TiO2 nanocrystals. A dependence of the Raman
peak wavenumber on the TiO2 nanocrystal diameter was
observed, which can be used as a prompt characterization tool for estimating average nanocrystal sizes. This observation is also supported by TEM micrograph evidence. The presence of the H2O2 in the solvothermal reaction mixture produces
anatase TiO2 nanoparticles with uniform and smaller size
due to its role as a retardant of grain size increase at a low cost. During the crystallization process, the nucleation rate of TiO2 is increased because the presence of peroxides can
inhibit the hydrolysis of the titanium ions in solution. As a result, uniformly shaped anatase particles with nanometric grain sizes smaller than those obtained in the absence of H2O2 were produced.
Supplementary Information
Supplementary information (Table S1) is available free of charge at http://jbcs.sbq.org.br as a PDF file.
Table 2. Calcined TiO2 nanocrystal average sizes (dRaman) calculated from the phonon confinement model by fitting the Eg Raman mode. Sample powders were produced by solvothermal reaction for 72h at 100ºC
T / oC 100 200 300 400 450 500 600 700
Acknowledgements
The present work was financially supported by Conselho Nacional de Desenvolvimento Científico e Tecnológico (CNPq) / Fundação de Amparo à Pesquisa do Piauí (FAPEPI) (Proc. Inst: 68.0093/2003-6) and CNPq (Proc. 304261/2009-2). B. C. Viana personally acknowledges the support from FAPEPI/MCT/CNPq/CT-INFRA (process number 010/2009).
References
1. Carp, O.; Huisman, C. L.; Reller, A.; Prog. Solid State Chem. 2004, 32, 33.
2. Li, X. Z.; Liu, H.; Environ. Sci. Technol.2003, 37, 3989. 3. Michael, G.; J. Sol-Gel Sci. Technol. 2001, 22, 7.
4. Hiroshi, M.; Takeo, H.; Yasuhiro, S. H.; Makoto, E.; Sensors Actuat., B2005, 108, 467.
5. Fu, G.; Vary, P. S.; Lin. C. H. Y.; J. Phys. Chem., B2005, 109, 8889.
6. Li, C. P.; Wang, J. F.; Su, W. B.; Chen, H. C.; Wang, Y. J.; Zhuang, D. X.; Mater. Lett. 2003, 57, 1400.
7. Li, Y.; White, T.; Lim, S. H.; Rev. Adv. Mater. Sci. 2003, 5, 211. 8. Hu, Y.; Tsai, H. L.; Huang, C. L.; J. Eur. Ceram. Soc.2003, 23,
691.
9. Gopal, M.; Chan, W. J. M.; De Jonghe, L. C.; J. Mater. Sci. 1997, 32, 6001.
10. Watson, S. S.; Betdoun, D.; Scott, J. A.; Amal, R.; Chem. Eng. J. 2003, 95, 213.
11. Pacheco, F.; Gonzalez, M.; Medina, A.; Velumani, S.; Ascencio, J. A.; Appl. Phys. A2004, 78, 531.
12. Ahonen, P. P.; Tapper, U.; Kauppinen, E. I.; Joubert, J. C.; Deschanvres, J. L.; Mater. Sci. Eng., A2001, 315, 113. 13. Bokhimi, X.; Pedraza, F.; J. Solid State Chem.2004, 177, 2456. 14. Spanier, J. E.; Robinson, R. D.; Zhang, F.; Chan, S. W.; Herman,
I. P.; Phys. Rev. B2001, 64, 245407
15. Mazali, I. O.; Souza Filho, A. G.; Viana, B. C.; Mendes Filho, J.; Alves, O. L.; J. Nanopart. Res.2006, 8, 141.
16. Li , G.; Pang, S.; Jiang, L.; Guo, Z.; Zhang, Z.; J. Phys. Chem., B
2006, 110,:9383.
17. Richter, H.; Wang, Z. P.; Ley, L.; Solid State Commun.1981,
39, 625.
18. Bersani, D.; Lottici, P. P.; Ding, X. Z.; Appl. Phys. Lett.1998,
72, 73.
19. Zhu, K.-R.; Zhang, M. -S.; Chen, Q.; Yin, Z.; Phys. Lett. A2005,
340, 220.
Submitted: January 16, 2013
Published online: June 5, 2013
Supplementary Information
Printed in Brazil - ©2013 Sociedade Brasileira de Química0103 - 5053 $6.00+0.00S
I
*e-mail: [email protected], [email protected]
Phonon Confinement Model to Measure the Average Sizes of Anatase Nanoparticles
Synthesized by a Solvothermal Method Using H
2O
2Bartolomeu C. Viana,*,a Juliana Sousa Gonçalves,a Valdemir dos Santos,b
Maria Rita de M. C. Santos,a Elson Longo,c Francisco E. P. Santos,a and
José Milton Elias de Matos*, a
aLIMAV/Centro de Ciências da Natureza, Departamento de Química and Departamento de Física, Universidade Federal do Piauí, Campus Ministro Petrônio Portela, 64049-550 Teresina-PI, Brazil
bLIEC, Departamento de Química, Universidade Federal de São Carlos,
CP 676, 13565-905 São Carlos-SP, Brazil
cLIEC, Departamento de Físico-Química, Instituto de Química, Universidade Estadual Paulista, CP 355, 14801-907 Araraquara-SP, Brazil
Table S1. Nanoparticle sizes of different TiO2 nanocrystals
Conditions Anatase nanoparticle size / nm
XRD Raman TEM
Calcination temperature / °C
100 6.1 8.6 8.8
200 6.6 8.8 –
300 7.4 9.8 –
400 8.5 12.2 –
450 9.4 13.4 –
500 11.4 15.3 –
600 Bulk Bulk –
700 Bulk Bulk –
Temperature of synthesis / °C
80 7.0 8.5 –
90 7.5 8.1 –
100 6.1 7.6 –
Time of synthesis / h
6 7.8 7.5 –
12 7.4 7.9 –
24 9.3 8.4 –
72 13.1 8.6 –
pH of synthesis
2 35 (bulk) 7.5 –
7 10 7.9 –