A
r
ti
c
le
*e-mail: [email protected]
A Comparative Study between Least-Squares Support Vector Machines and
Partial Least Squares in Simultaneous Spectrophotometric Determination of
Cypermethrin, Permethrin and Tetramethrin
Ali Niazi,* Mohammad Goodarzi and Ateesa Yazdanipour
Department of Chemistry, Faculty of Sciences, Azad University of Arak, Arak, Iran
Máquinas de vetor de suporte por mínimos quadrados (LS-SVM) e mínimos quadrados parciais (PLS) têm recebido atenção considerável em quimiometria para análise multicomponente. Foi realizada uma comparação entre os métodos LS-SVM e PLS aplicando-os na determinação espectrofotométrica simultânea de cipermetrina, permetrina e tetrametrina. Os espectros de absorbância no UV de soluções metanólicas foram medidas nas faixas de concentração 0,1-12,9, 0,1-24,9 e 0,1-13,8 mg mL-1 para cipermetrina, permetrina e tetrametrina, respectivamente. A
determinação simultânea por espectrofotometria no UV desses analitos representa um problema em química analítica devido às interferências espectrais. Dessa forma foi realizada a resolução da mistura por métodos quimiométricos. As raízes quadradas do erro quadrático médio de previsão (RMSEP) para cipermetrina, permetrina e tetrametrina por PLS e LS-SVM foram 0,1629, 0,2828, 0,1984 e 0,0766, 0,0907, 0,0467, respectivamente. A habilidade do método para análise de amostras em matrizes sintéticas e reais apresentou resultados satisfatórios. Os dados obtidos mostraram que o LS-SVM produziu melhores resultados que o PLS.
Least-squares support vector machines (LS-SVM) and partial least squares (PLS) have received considerable attention in the chemometrics for multicomponent analysis. A comparison was made between LS-SVM and PLS methods by applying them to simultaneous spectrophotometric determination of cypermethrin, permethrin and tetramethrin. The UV absorbance spectra of the methanolic solutions of the analytes were measured in the concentration ranges, 0.1-12.9, 0.1-24.9 and 0.1-13.8 mg mL-1 for cypermethrin, permethrin and tetramethrin, respectively. The
simultaneous determination of cypermetrin, permetrin and tetrametrin by UV spectrophotometry is a difficult problem in analytical chemistry, due to spectra interferences. The resolution of mixture of cypermetrin, permetrin and tetrametrin by chemometrics methods was performed. The root means square error of prediction (RMSEP) for cypermetrin, permetrin and tetrametrin by PLS and LS-SVM models were 0.1629, 0.2828, 0.1984 and 0.0766, 0.0907, 0.0467, respectively. The capability of the method for the analysis of synthesis and real matrix samples were evaluated by the determination of cypermethrin, permethrin and tetramethrin with satisfactory results. The resultant data explained that LS-SVM produced better results than PLS.
Keywords: cypermethrin, permethrin, tetramethrin, spectrophotometric, least squares-support vector machines, partial least squares
Introduction
The simultaneous determination of several components in a mixture can be difficult task, especially when their analytical characteristics are not very different. In recent years attention has been directed toward methods of analysis
involving multicomponent systems based on chemometrics
methods.1 Nowadays, multivariate calibration has become
methods including partial least squares (PLS) regression has received considerable attention in the chemometrics
literatures.1-3 It is based on linear models and is used
as satisfactory solution in most cases, where a linear relationship is present between the analytical signal and the property to be determined. However, PLSR is not always the best option, especially in situations where a nonlinear model is clearly required. Theory and application of PLSR
have been discussed in previous studies.4-8
Support vector machine (SVM) introduced by Vapnik9,10
is a valuable tool for solving pattern recognition and classification problem. SVMs can be applied to regression problems by the introduction of an alternative loss function. Due to its advantages and remarkable generalization performance over other methods, SVM has attracted
attention and gained extensive application.9 SVM shows
outstanding performances because it can lead to global models that are often unique by embodies the structural
risk minimization principle,9 which has been shown to
be superior to the traditional empirical risk minimization principle. Furthermore, due to their specific formulation, sparse solutions can be found, and both linear and nonlinear regression can be performed. However, finding the final SVM model can be computationally very difficult because it requires the solution of a set of nonlinear equations (quadratic programming problem). As a simplification,
Suykens and Vandewalle11 proposed a modified version
of SVM called least-squares SVM (LS-SVM), which resulted in a set of linear equations instead of a quadratic programming problem, which can extend the applications of the SVM. There exist a number of excellent introductions
of SVM,12-24 and the theory of LS-SVM has also been
described clearly by Suykens et al.11,12 and application of
LS-SVM in quantification and classification reported by
some of the workers.25-32 So, we will only briefly describe
the theory of LS-SVM.
In principle, LS-SVM always fits a linear relation (y = wx + b) between the regression (x) and the dependent
variable (y). The best relation is the one that minimizes
the cost function (Q)containing a penalized regression
error term:
(1)
subject to:
(2)
where φ denotes the feature map. The first part of this cost
function is a weight decay which is used to regularize weight sizes and penalize large weights. Due to this regularization, the
weights converge to similar value. Large weights deteriorate the generalization ability of the LS-SVM because they can cause excessive variance. The second part of cost function is the regression error for all training data. The relative weight of this part as compared to the first part indicated by the parameter
γ , which has to be optimized by the user.
Similar to other multivariate statistical models, the performances of LS-SVMs depends on the combination of several parameters. The attainment of the kernel function is cumbersome and it will depend on each case. However, the kernel function more used is the radial basis function
(RBF), exp(–(||x
i – xj
2||)/2s2) a simple Gaussian function,
and polynomial functions 〈xi, xj〉d where s2 is the width
of the Gaussian function and d is the polynomial degree,
which should be optimized by the user, to obtain the support
vector. For σ of the RBF kernel and d of the polynomial
kernel it should be stressed that it is very important to do a careful model selection of the tuning parameters, in
combination with the regularization constant γ, in order to
achieve a good generalization model.
Pyrethroid insecticides are used to control a number of insect species on economic crops. Pyrethroids are effective pest control chemicals and have low mammalian toxicity. Cypermetrin, permetrin and tetrametrin have been identified as highly effective contact insecticides. Owing to its availability, insecticides are misused in homicidal/ suicidal poisoning cases. Consequently, detection and determination of these insecticides is necessary in forensic
toxicology.33,34 In this project, least-squares support
vector machines in conjugation with UV absorbance was used to simultaneous determination of cypermethrin, permethrin and tetramethrin in synthetic and real samples. A comparison was also made between LS-SVM and PLS regression to extent the approach existed in the filed. The proposed methodology is fast, simple and does not generate hazardous chemical wastes, thus makes it easily possible to be used in control analysis of cypermethrin, permethrin and tetramethrin in environmental.
Experimental
Reagents and solutions
All reagents were of analytical reagent grade. Stock standard solutions of cypermethrin, permethrin and
tetramethrin, 1000 µg mL-1, were prepared by dissolving
appropriate amount of solutes in methanol. Working solutions of lower concentrations were prepared by proper dilution with methanol from the stock standard solutions.
This solution was stored in the dark at 4 °C and was found
Apparatus and software
A Hewlett-Packard 8453 diode array spectrophotometer controlled by a Hewlett-Packard computer and equipped with a 1-cm path length quartz cell was used for UV spectra acquisition. Data acquisition between 200 and 260 nm were performed with UV-Visible ChemStation program (Agilent Technologies), running under Windows XP.
The quantitative evaluations were carried out by using the PLS program from PLS-Toolbox version 2.0 for use with Matlab from Eigenvector Research Inc. The LS-SVM optimization and model results were obtained using the LS-SVM lab toolbox (Matlab/C Toolbox for Least-Squares
Support Vector Machines).11 All programs were run on a
Pentium IV (CPU at 3.0 GHz and RAM 1.0 GB) personal computer with windows XP operating system was used.
Procedure
Standard calibration and prediction set
A mixture design was used to maximize statistically
the information content in the spectra.35 According to 21
experimental design (Table 1) solutions were used to construct the models (calibration set) and another 10 solutions to validate them (prediction set) in that these were not included in the calibration set but were employed for independent tests (Table 2). The concentrations of cypermethrin, permethrin and tetramethrin were varied between 0.1-12.9, 0.1-24.9 and
0.1-13.8 mg mL-1, respectively. The mixed standard solutions
were placed in a 10 mL volumetric flask and completed to the final volume with methanol. The absorption spectra were recorded between 200 and 260 nm against blank of methanol. The spectra region between 200 and 260 nm, which implies working with 61 experimental points for each spectra (as
the spectra are digitized each 1.0 nm), was selected for analysis, because this is the zone with the maximum spectral information from the mixture components of interest.
Procedure for the determination of cypermethrin, per-methrin and tetraper-methrin in groundwater
After addition amounts of cypermethrin, permethrin and tetramethrin to water samples, double extraction with n-hexane was used as below. Water samples
Table 1. Concentration data of the different mixtures used in the calibration
set for the determination of cypermethrin, permethrin and tetramethrin (µg mL-1)
Mixture Cypermethrin Permethrin Tetramethrin
M1 0.1 0.1 13.8
M2 2.7 0.1 10.9
M3 5.3 0.1 8.2
M4 7.9 0.1 5.5
M5 10.5 0.1 2.8
M6 12.9 0.1 0.1
M7 10.5 5.1 0.1
M8 7.9 10.1 0.1
M9 5.3 15.1 0.1
M10 2.7 20.1 0.1
M11 0.1 24.9 0.1
M12 0.1 20.1 2.8
M13 0.1 15.1 5.5
M14 0.1 10.1 8.2
M15 0.1 5.1 10.9
M16 2.7 5.1 8.2
M17 5.3 5.1 5.5
M18 7.9 5.1 2.8
M19 2.7 10.1 5.5
M20 5.3 10.1 2.8
M21 2.7 15.1 2.8
Table 2. Composition of synthetic mixtures and predicted values for determination of cypermethrin, permethrin and tetramethrin (µg mL-1)
Added Found (PLS) Error (%) Found (LS-SVM) Error (%)
Cyp. Per. Tet. Cyp. Per. Tet. Cyp. Per. Tet. Cyp. Per. Tet. Cyp. Per. Tet.
0.5 3.5 5.0 0.53 3.72 5.08 6.00 6.29 1.60 0.51 3.53 4.99 2.00 0.75 −0.16
5.5 10.0 3.0 5.62 9.23 2.97 2.18 −7.70 −0.92 5.52 9.75 3.07 0.36 −2.53 2.35
0.3 2.0 11.0 0.29 2.11 10.56 −4.94 5.50 −4.00 0.31 2.03 10.93 3.33 1.53 −0.68
8.0 0.3 2.5 7.83 0.28 2.64 −2.09 −6.67 5.60 7.95 0.29 2.54 −0.68 −3.33 1.78
2.0 2.0 2.0 2.09 1.89 1.91 4.50 −5.50 −4.50 2.02 2.05 2.03 1.05 2.55 1.38
4.2 3.5 0.3 4.34 3.34 0.29 3.44 −4.57 −3.33 4.20 3.53 0.30 −0.02 0.97 0.00
6.5 12.0 10.0 6.53 11.87 9.74 0.50 −1.07 −2.59 6.44 12.03 9.94 −0.97 0.23 −0.57
11.5 2.0 5.0 11.10 2.08 4.94 −3.48 4.00 −1.20 11.28 2.02 4.94 −1.92 1.00 −1.25
3.8 18.0 6.5 3.94 17.74 6.61 3.68 −1.46 1.75 3.81 17.90 6.48 0.16 −0.58 −0.27
(500 mL) were shaken with 50 mL of n-hexane for 2 min. The collected organic phases were dried by passing
them through anhydrous Na2SO4 and evaporated using
a rotary vacuum evaporator. The concentrated samples were eluted with 1 mL acetonitrile and cypermethrin, permethrin and tetramethrin were determined as described above.
Statistical parameters
For the evaluation of the predictive ability of a multivariate calibration model, the root mean square error of prediction (RMSEP) can be used:
(3)
where y
pred is the predicted concentration in the sample, yobs
is the observed value of the concentration in the sample and
n is the number of samples in the validation set. The square
of correlation coefficient (R2), which indicates the fitting
of data in a straight line, was calculated as:
(4)
where –y is the mean of actual concentration in the
prediction set.
Selection of optimum number of factors
The selection of the number of factors in the factor analysis-based methods is very important for achieving the best prediction. The model refinement procedure used the predicted residual errors sum of squares (PRESS) of the leave-one-out cross-validation (LOO-CV) to select the optimal number of PLS factors. The PRESS was computed, which is defined as follows:
(5)
where y
i is the reference concentration for the ith sample
and ^y
i represents the estimated concentration. To select
the optimum number of factors, the criterion of Haaland
and Thomas36 was used. The maximum number of factors
used to determine the optimum PRESS was selected as 11
(half the number of standards plus one). The F-statistic
was used to make the significance determination. As the difference between the minimum PRESS and the other PRESS values becomes smaller, the probability that each additional factor is significant also decreases. Haaland and
Thomas empirically determined that an F-ratio probability
of 0.75 is a good choice. We selected as the optimum the
number of factors for the first PRESS value whose F-ratio
probability drops below 0.75.
Results and Discussion
Figure 1 shows the absorption spectra for the individual methanolic solution of cypermethrin, permethrin and tetramethrin. As this figure shows, there is a clear overlapping of the three spectra. This prevents the simultaneous determination of the cypermethrin, permethrin and tetramethrin by direct UV absorbance measurements. This problem was overcome by the use of least-squares support vector machines.
Mixture design
The standard solutions used in the multivariate calibration methods are mixtures of analytes. The quality of the multivariate calibration methods is dependent on the standard mixture solutions and presence or absence of outliers. Some important parameters should be inserted in preparing these standard solutions. First, the concentration of each analyte must be in its linear dynamic range; second, the concentration of analytes in the calibration samples must be orthogonal in order to give the most information from the analytical system; third, the sum of the concentrations of the analytes in a given mixture must be so that its absorbance does not exceed the maximum absorbance reading of the instrument; finally, the concentration of the prediction mixtures should span the same space as that of calibration mixtures.
Individual calibration curves were constructed with several points as absorbance versus cypermethrin,
Figure 1. Absorption spectra of 8.5 mg mL-1 methanolic solutions of the
permethrin and tetramethrin concentrations. For constructing the individual calibration lines, the absorbencies were measured at 212, 214 and 222 nm against a blank for cypermethrin, permethrin and tetramethrin, respectively. The linear regression equation for the calibration graph for cypermethrin for the concentration range of
0.1-12.9 mg mL-1 was A = 0.0462 + 0.0852C
cypermethrin
(r2 = 0.9912, n = 16), for permethrin for the concentration
range 0.1-24.9 mg mL-1 was A = 0.0840 + 0.0634C
permethrin
(r2 = 0.9956, n = 16) and for tetramethrin for the
concentration range 0.1-13.8 mg mL-1 was A = 0.0115 +
0.0499Ctetramethrin (r2 = 0.9925, n = 15). The limits of detection
were 0.04, 0.07 and 0.05 mg mL-1 for cypermethrin,
permethrin and tetramethrin, respectively, and these were calculated according to calibration line characteristics.
According to procedure section, the calibration matrix was designed. In Table 1, the compositions of the ternary mixtures used in the calibration matrices are summarized. For prediction set, ten mixtures were prepared according to procedure section (see Table 2). Principal component analysis (PCA) was used to check the standard mixtures for the presence of outlier and also to ensure the homogeneity between the calibration and prediction samples. To do so, the absorbance data matrices of the calibration and prediction samples were subjected to PCA, separately, and the standard mixtures were plotted in the factor space.
Partial least squares analysis
Firstly, the PLS regression was applied on the spectral data for simultaneous determination of the analytes. Leave-one-out cross-validation procedure was used to select the optimum number of PLS-latent variables for each analyte and the number of factors that produced the least PRESS was selected as optimum value. A plot of PRESS for cypermetrin, permetrin and tetrametrin as a function of the number of factors is shown in Figure 2. Table 3 shows the optimum
number of factors and PRESS values for cypermetrin, permetrin and tetrametrin. The number of PLS-latent variables used to model absorbance-concentration is higher than the number of analytes, which can be attributed to the interaction between the compounds in the mixtures.
To investigate the prediction ability of the resulted PLS model and to compare with least-squares support vector machines, the calibrated PLS model were used for quantization of the analytes in a separate prediction set mixtures that did not have contribution in the model building steps. The resulted predicted concentrations along with the statistical quantities are represented in Table 2 and 3.
Least-squares support vector machines
LS-SVM was performed with radial basis function (RBF) as a kernel function. In the model development
using LS-SVM and RBF kernel, γ and σ2 parameters
were a manageable task, similar to the process employed to select the number of factors for PLS models, but in this case for a two-dimensional problem. In Figure 3 is
Figure 2. Plots of PRESS of cross-validation for (a) cypermethrin, (b)
permethrin and (c) tetramethrin as a function of the number of factors.
Table 3. Statistical parameters for the PLS and LS-SVM calibration models
Method PLS LS-SVM
Compound Cypermethrin Permethrin Tetramethrin Cypermethrin Permethrin Tetramethrin
NFa 5 6 5
PRESS 0.1230 0.3214 0.4223
γ 100 100 100
σ2 10 10 10
RMSEP 0.1629 0.2828 0.1984 0.0766 0.0907 0.0467
R2 0.9401 0.9748 0.9267 0.9631 0.9861 0.9799
LOD(mg mL-1)b 0.065 0.057 0.071 0.042 0.038 0.046
aNumber of factors; bLOD (limit of detection) = 3.3 s(0) where s(0) is the S.D. in the predicted concentration of cypermethrin, permethrin and tetramethrin
for the determination of these three substances and their reported figure of merits are reported in the Table 3. Table
3 also shows the RMSEP and R2 for synthetic series of
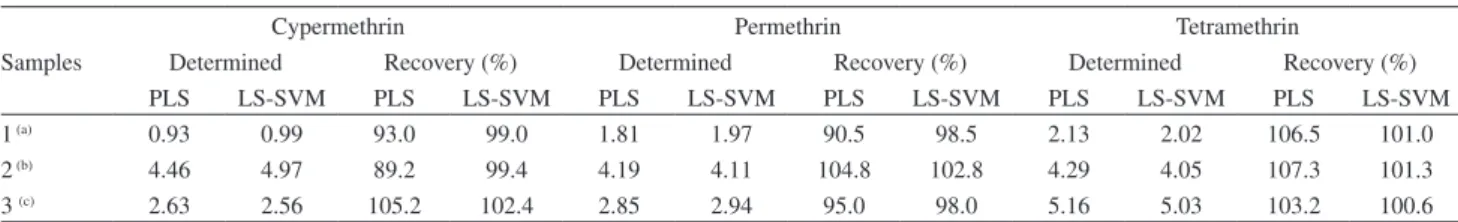
cypermethrin, permethrin and tetramethrin mixtures. The proposed procedure was successfully applied for the assay of cypermethrin, permethrin and tetramethrin simultaneously in real samples. For this purpose, diverse spiked samples and reference materials were analyzed. Samples were treated and analyzed as described under procedure section. Table 4 summarizes the results obtained for real matrix samples. Table 4 shows that satisfactory recovery values were obtained for the samples assayed. Therefore, the LS-SVM model is able to predict the concentrations of cypermethrin, permethrin and tetramethrin in the real matrix sample.
Conclusion
PLS and LS-SVM as two powerful and the most widely used multivariate calibration methods were employed for simultaneous spectrophotometric determination of cypermethrin, permethrin and tetramethrin. The cypermethrin, permetrin and tetramethrin mixture is an extremely difficult complex system due to the high spectra overlapping observed between the spectra for shown the optimized surface result for the LS-SVM and
RBF kernel, using the spectra calibration sets for three pyrethroid insecticides. These parameters were optimized
generating models with values of γ in the range of 1-500
and σ2 in the range of 1-100 with adequate increments.
These ranges were selected from previous studies where it was establish the magnitude of the parameters to be
optimized. For each combination of γ and σ2 parameters,
root mean square error of cross-validation (RMSECV) was calculated and the optimum parameters were selected produced the smaller RMSECV. The cross-validation procedure was used to determine an average RMSECV between the three RMSCEV of the components, using the following equation:
(6)
In Table 3 the optimum γ and σ2 parameters for the
LS-SVM and RBF kernel are shown, using the calibration set for ternary mixtures of cypermethrin, permethrin
and tetramethrin. Table 3 also shows RMSEP and R2 for
comparison.
Determination of cypermethrin, permethrin and tetram-ethrin in synthetic and real samples
The proposed method was successfully applied for determination of cypermethrin, permethrin and tetramethrin in several synthetic samples (their compositions are given in Table 2). The results obtained from simultaneous determination of cypermethrin, permethrin and tetramethrin by PLS and LS-SVM methods are listed in Table 2 and 3. Table 2 also shows the percentage error for synthetic series of cypermethrin, permethrin and tetramethrin mixtures. As can be seen, the percentage error was also quite acceptable. Good results were achieved in LS-SVM
model with percentage error ranges from −1.92 to 3.33%,
−3.33 to 2.55% and −1.25 to 2.35% for cypermethrin,
permethrin and tetramethrin, respectively. Figures of merit are regularly employed for method comparison. The results
Figure 3. Parameter optimization response surface for LS-SVM model.
Table 4. PLS and LS-SVM results applied on the real matrix samples (µg mL-1)
Samples
Cypermethrin Permethrin Tetramethrin
Determined Recovery (%) Determined Recovery (%) Determined Recovery (%)
PLS LS-SVM PLS LS-SVM PLS LS-SVM PLS LS-SVM PLS LS-SVM PLS LS-SVM
1 (a) 0.93 0.99 93.0 99.0 1.81 1.97 90.5 98.5 2.13 2.02 106.5 101.0
2 (b) 4.46 4.97 89.2 99.4 4.19 4.11 104.8 102.8 4.29 4.05 107.3 101.3
3 (c) 2.63 2.56 105.2 102.4 2.85 2.94 95.0 98.0 5.16 5.03 103.2 100.6
Added of cypermethrin, permethrin and tetramethrin: (a) 1.0, 2.0 and 2.0 mg mL-1, (b) 5.0, 4.0 and 4.0 mg mL-1 and 2.5, 3.0 and 5.0 mg mL-1,
their components. For overcoming the drawback of spectrophotometric interferences, PLS and LS-SVM multivariate calibration approaches are applied. According
to the obtained results (percentage of error, RMSEP, R2
and figure of merit), LS-SVM is better than PLS. LS-SVM gives a low limit of detection. The results of this study clearly show the potential and versatility of this method, which could be applied to simultaneous determination of cypermethrin, permethrin and tetramethrin in synthetic and real matrix samples.
Acknowledgment
The authors gratefully acknowledge the support to this work from Azad University of Arak research council, especially Mr. H. Malekhossieni for preparation of reagents.
References
1. Martens, M.; Naes, T.; Multivariate Calibration, Wiley: Chichester, 1989.
2. Geladi, P.; Kowalski, B. R.; Anal. Chim. Acta1986, 185, 1. 3. Brereton, R. G.; Chemometrics; Data Analysis for the
Laboratory and Chemical Plant, Wiley: England, 2003. 4. Niazi, A.; Ghasemi, J.; Yazdanipour, A.; Anal. Lett.2005, 38,
2377.
5. Niazi, A.; Soufi, A.; Mobarakabadi, M.; Anal. Lett.2006, 39, 2359.
6. Niazi, A.; Sadeghi, M.; Chem. Pharm. Bull.2006, 54, 711. 7. Niazi, A.; J. Braz. Chem. Soc.2006, 17, 1020.
8. Niazi, A.; Croa. Chim. Acta2006, 79, 573.
9. Vapnik, V.; Statistical Learning Theory, John Wiley: New York, 1998.
10. Cortes, C.; Vapnik, V.; Mach. Learn.1995, 20, 273.
11. Suykens, J. A. K.; Vandewalle, J.; Neural Process. Lett.1999, 9, 293.
12. Suykens, J. A. K.; van Gestel, T.; de Brabanter, J.; de Moor, B.; Vandewalle, J.; Least-Squares Support Vector Machines, World Scientifics: Singapore, 2002.
13. Vapnik, V.; In Nonlinear Modeling: Advanced Black-Box Techniques; Suykens, J. A. K.; Vandewalle, J., eds.; Kluwer Academic Publishers: Boston, 1998.
14. Suykens, J. A. K.; Eur. J. Control2001, 7, 311. 15. Burges, C. J. C.; Data Min. Knowl. Discov.1998, 2, 121.
16. Smola, A. J.; Scholkopf, B.; Stat. Comput.2004, 14, 199. 17. Zomer, S.; Brereton, R. G.; Carter, J. F.; Eckers, C.; Analyst
2004, 129, 175.
18. Belousov, A. I.; Verzakov, S. A.; Frese, J. V.; J. Chemom.2002, 16, 482.
19. Pierna, J. A. F.; Volery, P.; Besson, R.; Baeten, V.; Dardenne, P.; J. Agric. Food. Chem.2005, 53, 6581.
20. Thissen, U.; Ustun, B.; Melssen, W. J.; Buydens, L. M. C.; Anal. Chem.2004, 76, 3099.
21. Chauchard, F.; Cogdill, R.; Roussel, S.; Roger, J. M.; Bellon-Maurel V.; Chemom. Intell. Lab. Syst.2004, 71, 141. 22. Thissen, U.; van Brakel, R.; de Weijer, A. P.; Melssen, W. J.;
Buydens, L. M. C.; Chemom. Intell. Lab. Syst.2003, 69, 35. 23. Zhao, J.; Chen, Q.; Huang, X.; Fang, C. H.; J. Pharm. Biomed.
Anal.2006, 41, 1198.
24. Zou, T.; Dou, Y.; Mi, H.; Zou, J.; Ren, Y.; Anal. Biochem.2006, 355, 1.
25. Ke, Y.; Yiyu, C.; Chinese J. Anal. Chem.2006, 34, 561. 26. Borin, A.; Ferrao, M. F.; Mello, C.; Maretto, D. A.; Poppi, R.
J.; Anal. Chim. Acta2006, 579, 25.
27. Kovalenko, I. V.; Rippke, G. R.; Hurburgh, C. R.; J. Agric. Food. Chem.2006, 54, 3485.
28. Kovalenko, I. V.; Rippke, G. R.; Hurburgh, C. R.; J. Am. Oil Chem. Soc.2006, 85, 421.
29. Li, J.; Liu, H.; Yao, X.; Liu, M.; Hu, Z.; Fan, B.; Anal. Chim. Acta2007, 581, 333.
30. Arfken, G. B.; Weber, H. J.; Mathematical Methods for Physicists, 4th ed., Academic Press: New York, 1995.
31. Li, Y.; Shao, X.; Cai, W.; Talanta2007, 72, 217.
32. Niazi, A.; Ghasemi, J.; Yazdanipour, A.; Spectrochim. Acta Part A2007, 68, 523.
33. Vitthal, B. P.; Murlidhar, T. S.; Sudhakar, V. P.; Analyst1992, 117, 75.
34. Janghel, E. K.; Rai, J. K.; Rai, M. K.; Gupta, V. K.; J. Braz. Chem. Soc.2007, 18, 590.
35. Cornel, J. A.; Experiments with Mixtures, Wiley: New York, 1981.
36. Haaland, D. M.; Thomas, E. V.; Anal. Chem.1988, 60, 1193. 37. Boque, R.; Ferre, J.; Faber, N. M.; Rius, F. X.; Anal. Chim. Acta
2002, 451, 313.
Received: August 2, 2007