International
Journal
of
Industrial
Chemistry
www.ijichem.org
Islamic Azad University
Quchan Branch ISSN (online): 2228-5547 ISSN (print): 2228-5970
Derivative- Ratio Spectrophotometric, Chemometric and HPLC
Validated methods for Simultaneous Determination of Amlodipine and
Atorvastatin in Combined Dosage Form
Ola Moustafa Abdallaha,*, Amr Mohamed Badaweyb
aAnalytical Chemistry Department, Faculty of Pharmacy, October University for Modern Sciences and Arts (MSA), 26 July
Mehwer Road intersection with Wahat Road, 6th October City, Egypt bAnalytical Chemistry Department, Faculty of Pharmacy, Cairo University, Cairo, Egypt
*Email: [email protected]
Received: 5 December 2010; Accepted: 20 December 2010
Abstract
Three methods were developed for simultaneous determination of amlodipine and atorvastatin without previous separation. The first method depends on first derivative of the ratios spectra by measurements of the amplitudes at 228 and 245 nm for amlodipine using 25 μg/mL of atorvastatin as a divisor and at 284 and 295 nm for atorvastatin using 80 μg/mL of amlodipine as a divisor. Calibration graphs were established in the range of 10-100 μg/mL and 2.5-30 μg/mL for amlodipine and atorvastatin, respectively. The second method describes the use of multivariate spectophotometric calibration for the simultaneous determination of the analyzed binary mixture, where the resolution is accomplished by using partial least squares (PLS) regression analysis. In the third method (HPLC), separation was performed by using C18 reversed phase column and a mobile phase of acetonitrile: 0.05 M KH2PO4 (60:40v/v) adjusted by phosphoric acid to pH 3.5 at flow rate of 1 mL/min. All proposed methods were extensively validated and the results obtained by adopting the three methods were statistically analyzed and compared with those obtained from a reported method.
Keywords: Amlodipine, atorvastatin, derivative ratio, PLS, HPLC
1. Introduction
Amlodipine (AM) is a long acting calcium channel blocker (dihydropyridine class) used as antihypertensive and in the treatment of angina. Like other calcium channel blockers, amlodipine acts by relaxing the smooth muscle in the arterial wall, decreasing total peripheral resistance and hence reducing blood pressure; in angina it increases blood flow to the heart muscle [1].
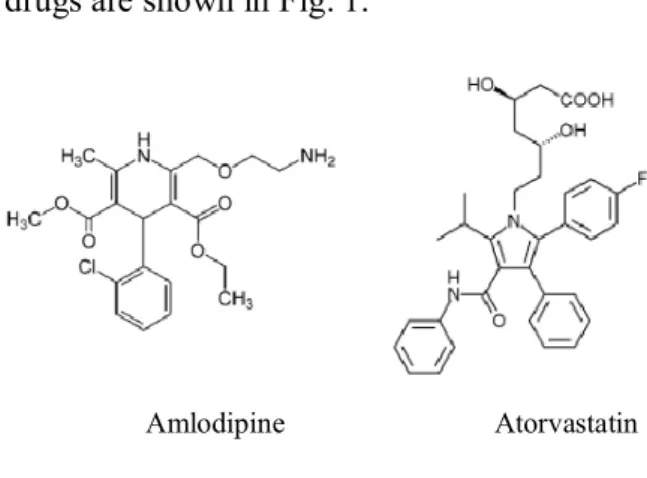
The chemical structures of the examined drugs are shown in Fig. 1.
Amlodipine Atorvastatin
Fig. 1. Chemical structures of amlodipine and atorvastatin
Literature survey revealed that HPLC [5-11], HPTLC [12, 13], MS [14], LC-MS/MS [15] and simultaneous UV – spectrophotometric methods [16-17] are reported for the estimation of amlodipine alone or in combination with other anti-hypertensive agents. Published analytical methods for the quantitative estimation of atorvastatin alone or in combination with other agents include; spectrophotometry [18-20], colorimetry via ion pair complexes [21], FT- Raman spectroscopy [22], HPLC [6, 23-26], LC-MS [27, 28], HPTLC [29, 30], voltammetric [31], capillary electrophoresis [32]. Quantitative spectroscopy has been greatly improved by the use of multivariate statistical methods [33-35]. Multivariate calibrations are useful in spectral analysis because of the simultaneous inclusion of multiple spectral intensities which can greatly improve the precision and applicability of quantitative spectral analysis [36]. The aim of the present study is to investigate the utility of derivative ratio spectrophotometry, multivariate methods in addition to a fast and sensitive HPLC technique in the assay of AM and AT in pharmaceutical preparation without the necessity of sample pre-treatment. The proposed methods were optimized and validated for this purpose. According to the ICH description, the developed methods were accurate and precise [37].
2. Experimental
2. 1. Drug Substances and Dosage Form
2. 1. 1. Amlodipine and atorvastatin pure
substances. were kindly supplied by EPICO and Novartis Pharma, respectively.
2. 1. 2. Caduet® Tablets labeled to contain 10
mg of both drugs, Batch No. 0795049.
2. 2. Reagents
Acetonitrile (Fisher Scientific, UK). Potassium dihydrogen phosphate (KH2PO4)
(Sigma-Aldrich Chemie, Germany). Orthopho- sphoric acid (H3PO4) (Sigma-Aldrich Chemie,
Germany). Methanol (Sigma-Aldrich Chemie, Germany). Acetonitrile is HPLC grade and all other chemicals are analytical reagent grade.
2. 3. Instrumentation
Agilent 1200 series isocratic quaternary pump HPLC instrument connected to 1200 multiple wavelength UV detector. Separation was performed on 150 x 4.6 mm Zorbax Extend-C18 column 5 µm particle size. Chromatographic peaks were electronically integrated and recorded using Chemstation software (Germany). A Shimadzu (Japan) 1601 PC double-beam UV-visible spectrophoto-meter. PLS was modeled using PLS toolbox 2.0 software under MATLAB® 6.5. pH/mv
Meter with double junction glass electrode (Fisher, USA).
2. 4. Procedure
2. 4. 1. Preparation of stock solutions and calibration
2. 4. 1. 1. For derivative ratio method (DD1)
standard spectrum of AT (30 μg/mL). The first derivative was calculated for the obtained spectra with Δλ= 5. The amplitudes at 228 and 245 nm were measured. For AT, the stored UV absorption spectra of standard solutions of AM were divided wavelength-by-wavelength by a standard spectrum of amlodipine (80 μg/mL). The first derivative was calculated for the obtained spectra with Δλ= 5. The amplitudes at 284 and 295 nm were measured.
2. 4. 1. 2. For multivariate method
In order to obtain the calibration matrix for applying PLS analysis fifteen solutions of each of the pure components (amlodipine and atorvastatin) were prepared in a concentration range of 40-80 μg/mLand 5-25 μg/mLfor AM and AT, respectively. These ranges were previously verified to obey Beer's law for each of the studied drugs in methanol. The absorption data in the range of 220-450 nm (digitized every 0.5 nm) of 15 different laboratory prepared mixtures containing amounts of amlodipine and atorvastatin in different proportions according to the multilevel multifactor design were subjected to partial least squares analysis in order to obtain the calibration matrix. A Validation set composed of 7 different laboratory prepared mixtures containing different concentrations of the two drugs were prepared in order to assess the prediction ability of the proposed PLS method for the analysis of such mixture.
2. 4. 1. 3. For HPLC method
Amlodipine and atorvastatin stock solutions in methanol were prepared by dissolving 10 mg of both drugs in 10 mL volumetric flasks (0.1 μg/mL). Series of working solutions of AM and AT were prepared by the appropriate dilution of the stock solutions with same solvent to reach the concentration ranges of 10-40 μg/mL for amlodipine and 5-40 μg/mLfor atorvastatin. Triplicate 20 μL injections were made for each concentration using the following chromatographic conditions:
Mobile phase consisting of acetonitrile: 0.05M KH2PO4 (60:40 v/v) adjusted by
phosphoric acid to pH 3.5. Detector wavelength: 238 nm for AM and 210 nm for AT, flow rate: 1 mL/min, Column temperature: ambient temperature (20-22°C).
Peak area of each concentration was plotted against the corresponding concentration for the construction of calibration graph.
2. 4. 2. Accuracy Study
To study the accuracy of the proposed methods, and to check the interference from excipients present in the dosage form, recovery experiments were carried out by standard addition method. This study was performed by addition of different amounts of amlodipine and atorvastatin to a known concentration of the commercial tablets. The resulting mixtures were analyzed as described under section (calibration).
2. 4. 3. Application to Pharmaceutical Dosage Form
Five tablets were powdered. An aliquot equivalent to one tablet content was accurately weighed, transferred into 100 mL volumetric flask containing about 50 mL methanol, sonicated for 10 min then filtered and diluted to volume with additional methanol. Working solutions were prepared by transferring suitable aliquots of clear filtrate and diluting with appropriate solvent. The assay was completed as under section (calibration). For the three proposed methods, concentrations of amlodipine and atorvastatin were calculated from the corresponding regression equations.
3. Results and Discussion
3. 1. Optimization of conditions 3. 1. 1. For DD1 method
mixture at the wavelengths corresponding to a maximum or minimum. The main advantage of DD1 method is the chance of easy measurements in correspondence to peaks so it permits the use of the wavelength of highest value of analytical signals (maximum or minimum). Moreover, the presence of a lot of maxima and minima is another advantage by the fact that these wavelengths give an opportunity for the determination of active compounds in presence of other active compounds or excipients which possibly interfere with the analysis. The influence of Δλ for obtaining the first derivative of the ratio spectra as well as, the effect of divisor concentration on the calibration graphs for the proposed mixture was studied in order to select the best factors affecting the determination. Results indicated that Δλ = 5 nm was the most suitable one.
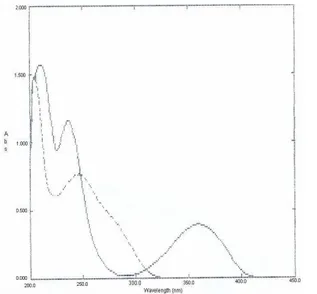
Fig. 2. Absorption spectra of amlodipine ( ), 40 μg/mL and atorvastatin (----), 20 μg/mL in methanol.
Determination of both drugs was done by dividing the absorption spectra of AM by that of standard solution of AT (25 μg/mL) while the absorption spectra of AT were divided by that of standard solution of AM (80 μg/mL). The first derivative of the developed ratio spectra were calculated with Δλ = 5 nm. Fig. 3, shows that AM can be determined by measuring the amplitude at 228 and 245 nm. AT can be determined by measuring the
amplitude at 284 and 295 nm, Fig. 4. The proposed method is applicable over a concentration range of 10-100 μg/mL for AM and 2.5-30 μg/mL for AT. The characteristic parameters and necessary statistical data of the regression equation, limit of quatitation (LOQ), limit of detection (LOD), repeatability and reproducibility data are collected in Table 1.
Fig. 3. First derivative of the ratio spectra of amlodipine (10-100 μg/mL). Divisor is 30 μg/mL atorvastatin spectrum.
Fig. 4. First derivative of the ratio spectra of atorvastatin (2.5-30 μg/mL). Divisor is 80 μg/mL of amlodipine spectrum.
3. 1. 2. For multivariate method
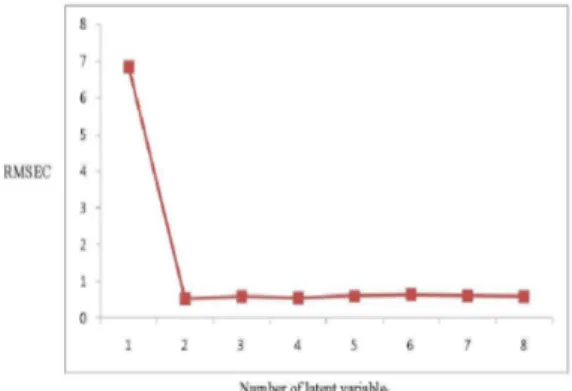
number of factors was a very important pre-construction step because if the number of factors retained was more than required more noise would be added to the data. On the other hand, if the number retained was too small meaningful data that could be necessary for the calibration might be discarded. Different methods can be used to determine the optimum number of factors [41, 42]. In this study, the leave–one-out cross-validation method was used and the root mean square error of calibration (RMSEC) values of different developed models was compared. The model selected was that with the smallest number of factors such that RMSEC for that model was not significantly greater than RMSEC from the model with additional factor. As the difference between the minimum RMSEC and other RMSEC values became smaller, the probability that each additional factor was significant became smaller. Two factors were found suitable, Fig. 5.
The characteristic parameters and necessary statistical data of the regression equation, limit of detection (LOD), repeatability and reproducibility data are collected in Table 1.
Seven laboratory-prepared mixtures containing different ratios of both drugs were subjected to the PLS analysis in order to confirm the suitability of the calibration model for determination of studied drugs in the pharmaceutical sample solutions, where satisfactory results were obtained (Table 2).
Fig. 5. RMSEC plot of the cross validation results of the training set as a function of number of principal components used to construct the PLS calibration for AT and Am.
3. 1. 3. For HPLC Method
In order to perform the simultaneous elution of amlodipine and atorvastatin peaks, different chromatographic conditions were optimized. The composition of the mobile phase was studied by trying acetonitrile and KH2PO4
(5x10⁻² M) in different ratios using gradient
elution, The best peak shape and adequate separation of the two drugs was obtained by a final composition of acetonitrile-KH2PO4
(60:40 v/v) adjusted by phosphoric acid to pH 3.5.
Different flow rates (0.5-1.2 mL/min) were tested; good resolution was obtained using 1 mL/min. Four wavelengths were tried (210, 230, 238 and 280 nm); much sensitive detector response was obtained at 238 nm for AM and 210 nm for AT.
System suitability parameters were calculated and the retention times were found to be 1.48 min for AM and 2.64 min for AT, Fig. 6. Resolution and selectivity factors for this system were found to be 2.22 and 2.51 for AM and AT, respectively. Tailing and capacity factors were obtained as 1.21 and 0.91 for AM and 1.51 and 1.55 for AT. Results obtained from system suitability tests are in agreement with the USP requirements.
Fig. 6. Representative Chromatogram of amlodipine and atorvastatin.
addition to LOQ, LOD repeatability and reproducibility data are presented in Table 1.
3. 2. Application to Pharmaceutical Dosage form
The three proposed methods were successfully applied for the simultaneous determination of both drugs in Caduet® tablet
without interference of the excipients present and without prior separation. The utility of the three proposed methods was verified by replicate estimations of the pharmaceutical preparation and results obtained are evaluated statistically (Table 2).
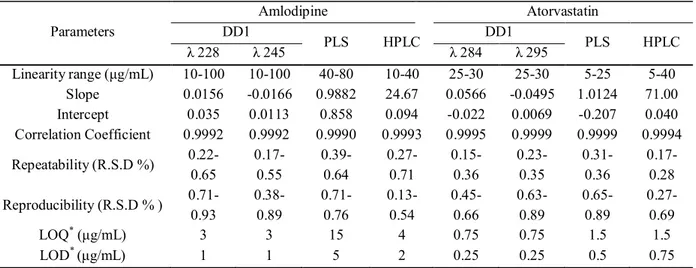
Table 1. Selected Validation Data for the Determination of Amlodipine and Atorvastatin by the Proposed Methods
Parameters
Amlodipine Atorvastatin
DD1 PLS HPLC DD1 PLS HPLC
λ 228 λ 245 λ 284 λ 295
Linearity range (μg/mL) 10-100 10-100 40-80 10-40 25-30 25-30 5-25 5-40 Slope 0.0156 -0.0166 0.9882 24.67 0.0566 -0.0495 1.0124 71.00 Intercept 0.035 0.0113 0.858 0.094 -0.022 0.0069 -0.207 0.040 Correlation Coefficient 0.9992 0.9992 0.9990 0.9993 0.9995 0.9999 0.9999 0.9994 Repeatability (R.S.D %) 0.22-0.65 0.17-0.55 0.39-0.64 0.27-0.71 0.15-0.36 0.23-0.35 0.31-0.36 0.17-0.28
Reproducibility (R.S.D % ) 0.71-0.93 0.38-0.89 0.71-0.76 0.13-0.54 0.45-0.66 0.63-0.89 0.65-0.89 0.27-0.69
LOQ* (μg/mL) 3 3 15 4 0.75 0.75 1.5 1.5
LOD* (μg/mL) 1 1 5 2 0.25 0.25 0.5 0.75
* LOD and LOQ were estimated based on practical approaches to the proposed methods. For the DD1 and PLS methods, they were estimated using linear regression method [37], where LOD = 3Sa/b and LOQ = Sa/b. Where Sa is the standard deviation of the response and b is the slope of the calibration curve. For HPLC method LOD and LOQ were determined by using the signal-to-noise method [37], a signal-to-noise ratio (S/N) of three is used for estimating LOD and signal-to-noise ratio of ten is used for estimating LOQ.
3. 3. Validity of the Proposed Methods
In order to demonstrate the validity and applicability of the proposed DD1 method, recovery studies were performed by analyzing laboratory prepared mixtures of AM and AT with different composition ratio. The validity of the method was further assessed by applying the standard addition technique; results are presented in Table 2. A statistical comparison of the results obtained by the proposed methods and the reported HPLC method [6] is shown in Table 2. The values of the calculated t and F are less than the tabulated ones, which reveals that there is no significant difference with respect to accuracy and precision between the proposed and reported method.
4. Conclusions
their analysis. The proposed HPLC method is very comparable to the reported HPLC one regarding retention times and limit of quantitation of both drugs. In addition to that, the C18 column used in the proposed HPLC
method is more preferred than that used in the reported HPLC method due its availability and lower cost.
Table 2. Determination of AM and AT in Authentic, laboratory Prepared Mixtures and Pharmaceutical Dosage Form Using DD1, PLS, HPLC and Reported Method [6].
HPLC PLS
DD1 Reported*
Analyzed Solution λ 228 λ 245
99.38±1.36 100.01±1.06 99.32±1.09 99.35±0.86 100.13±1.24 Authentic AM 5 15 5 3 5 N 1.04(1.83)** 0.21 (1.73)** 1.18(1.83)** 1.02(1.89)** - t 1.20(5.05)** 1.36 (4.62)** 1.29(5.05)** 2.07(9.01)** - F λ 295 λ 284 100.25±0.84
Authentic AT 99.23±1.48 99.77±0.66 100.01±1.49 99.94±1.18
7 15 6 4 5 N 0.51 (1.83)** 1.09 (1.73)** 0.92(1.81)** 1.43(1.86)** - t 1.97 (4.88)** 3.14 (4.62)** 1.61(4.39)** 3.10(5.19)** - F 99.75±0.98 98.86±1.48 99.68±0.39 99.72±0.64 - AM in laboratory prepared mix.
99.50±0.88 98.80 ±2.55
100.31±0.31 99.76±0.36
- AT in laboratory prepared mix.
99.39±0.34 99.92±0.87
99.82±0.61 99.53± 0.52
- AM in Caduet® tablet
99.61±0.20 99.80±0.72
100.12±0.72 99.73±0.61
- AT in Caduet® tablet
100.57±0.58 99.87±0.72
99.83±0.67 100.19± 0.60
- Standard addition technique for Am
99.31±0.15 99.88±0.75
100.12±0.63 100.21±0.81
- Standard addition technique for AT
* Reported method used is an isocratic reversed-phase stability-indicating HPLC assay for the simultaneous determination of AT and AM in commercial tablets. Separation was achieved on a Perfectsil® Target ODS-3, 5 μm, 250 mm × 4.6 mm i.d. column using a mobile phase consisting of acetonitrile–0.025 M NaH2PO4 buffer (pH 4.5) (55:45, v/v) at a flow rate of 1 mL/min and UV detection at 237 nm. Retention times were 1.55 min for AM and 3.32 min for AT. The limits of quantitation were 2 μg/mL and 1 μg/mL for AM and AT, respectively.
** Theoretical values at 95% confidence limit
References:
[1] D. Murdoch, R. C. Heel, Drugs 41 (1991) 478. [2] E. J. Schaefer, B. F. Asztalos, Curr Opin Cardiol 22
(2007) 373.
[3] T. Pearson, Am J Cardiol 99 (2007) 1706. [4] T. Yamada, Am Heart J 153 (2007)1055.
[5] A. Remuzzi, N. Perico, G. Remuzzi, Drugs of Today 34 (1998) 973.
[6] A. Mohammadi, N. Rezanour, M. Ansari Dogaheh, F. Ghorbani Bidkorbeh, M. Hashem, R. B. Walker, J Chromatogr, B: Anal Technol Biomed Life Sci 846 (2007) 215.
[7] G. Bahrami, S. H. Mirzaeei, J Pharm Biomed Anal 36 (2004)163.
[8] B. Chaudhari, N. M. Patel, J Pharm Research 5 (2006) 141.
[9] C. Mustafa, Hacettepe University Journal of the Faculty of Pharmacy 28 (2008) 15.
[10] A. P. Agrekar, S. G. Powar, J Pharm Biomed Anal 21 (2000) 1137.
[11] B. Chaudhari, N. M. Patel N. M., P. B. Sham, Chem Pharm Bull (Tokyo) 55 (2007) 241.
[12] S. S. Chitlange, B. Kiran, D. M. Sakarkar, Asian J Research Chem 1 (2008) 15.
[13] K. K. Pandya, K. K., J Chromatogr Biomed Appl 667 (1995) 315.
[14] S. N. Meyyanthan, B. Suresh, J Chromatogr Sci 43 (2005) 73.
[15] Y. Feng, J Chromatogr Sci 40 (2002) 49. [16] J. Bhatt, J Biomed Chromatogr 21 (2007) 169. [17] M. D. Malesuik, J AOAC Int 89 (2006) 359. [18] B. Stanisz, W. Rafa, Chem Anal (Warsaw, Pol) 53
(2008) 417.
[19] J. Nagara, K. Vipul, M. Rajshree, Anal Sci 23 (2007) 445.
[20] S. S. Sonawane, Eurasian J Anal Chem 1 (2006) 31. [21] N. Erk, Anal Lett 36 (2003) 2699.
[22] D. Skorda, C. G. Kontoyannis, Talanta 74 (2008) 1066.
[23] U. Seshachalam, C. B. Kothapally, C. B., J Liq Chromatogr Relat Technol 31 (2008) 714.
[24] T. G. Altuntas, N. Erk, J Liq Chromatogr Relat Technol 27 (2004) 83.
[26] R. M. Petkovska, C. Cornett, A. Dimitrovska, Anal Lett 41 (2008) 992.
[27] R. Gerber, J. D. Ryan, D. S. Clark, Anal Biochem 329 (2004) 28.
[28] V. Borek-Dohalsky, Anal Bioanal Chem 386 (2006) 275.
[29] S. S. Dhaneshwar, Acta Chromatogr 19 (2007) 141. [30] A. Jamshidi, A. R. Nateghi, Chromatographia 65
(2007) 763.
[31] N. Erk, Crit Rev Anal Chem 34 (2004) 1. [32] J. M. Miller, Electrophoresis 23 (2002) 2833. [33] A. Espino-Mansilla, A. Munoz de la pena, F.
Salinaz, Anal Chim Acta 27 (1993) 141. [34] D. M. Haland, Anal Chem 60 (1988) 1193.
[35] H. C. Goicoechea, A. C. Olivieri, J Pharm Biomed Anal 20 (1999) 255.
[36] Y. NI, X. Gong, Anal Chim Acta 354 (1997) 163. [37] ICH, Q2B In proceedings of The International
Conference on Harmonization, Geneva (1993). [38] C. F. Mónica, M. Patricia, S. Teodoro, Anal Bioanal
Chem 377 (2003) 1159.
[39] M. Patricia, E. Silvana, M. Rubén, S. Teodoro, Anal Bioanal Chem 382 (2005) 1711.
[40] M. Rubén, M. Patricia, Anal Bioanal Chem 391 (2008) 2949.
[41] R. Kramer, Chemometric Techniques for Quantitative Analysis Marcel Dekker (1998) Inc , New York.
![Table 2. Determination of AM and AT in Authentic, laboratory Prepared Mixtures and Pharmaceutical Dosage Form Using DD1, PLS, HPLC and Reported Method [6]](https://thumb-eu.123doks.com/thumbv2/123dok_br/18163878.329113/7.892.89.830.294.624/determination-authentic-laboratory-prepared-mixtures-pharmaceutical-dosage-reported.webp)
