Nota Técnica
*e-mail: [email protected]
SIMULTANEOUS SPECTROPHOTOMETRIC DETERMINATION OF LAMIVUDINE AND ZIDOVUDINE IN FIXED DOSE COMBINATIONS USING MULTIVARIATE CALIBRATION
Severino Grangeiro Jr., Miracy M. Albuquerque e Davi P. Santana
Departamento de Ciências Farmacêuticas, Universidade Federal de Pernambuco,50740-540Recife – PE, Brasil Maria Fernanda Pimentel e Reniere H. da Silva
Departamento de Engenharia Química, Universidade Federal de Pernambuco, 50740-540 Recife – PE, Brasil Simone S. Simões*
Laboratório Farmacêutico do Estado de Pernambuco, 58051-320 Recife – PE, Brasil
Recebido em 12/3/10; aceito em 17/11/10; publicado na web em 25/2/11
The simultaneous determination of two or more active components in pharmaceutical preparations, without previous chemical separation, is a common analytical problem. Published works describe the determination of AZT and 3TC separately, as raw material or in different pharmaceutical preparations. In this work, a method using UV spectroscopy and multivariate calibration is described for the simultaneous measurement of 3TC and AZT in ixed dose combinations. The methodology was validated and applied to determine the AZT+3TC contents in tablets from ive different manufacturers, as well as their dissolution proile. The results obtained employing the proposed methodology was similar to methods using irst derivative technique and HPLC.
Keywords: multivariate calibration; lamivudine (3TC); zidovudine (AZT).
INTRODUCTION
Lamivudine (3TC) and zidovudine (AZT) are nucleoside analo-gues and potent selective inhibitors of the HIV-1 and HIV-2 viruses. 3TC has shown to be synergistic to AZT, inhibiting the replication of HIV in cellular cultures.1 3TC induces its own viral resistance,
causing the AZT to become sensitive again in a reverse transcriptase in many patients who present a process of resistance associated with AZT through mutation, weakening the virulence and the HIV capa-city for viral replication and decreasing the genetic diversiication of this enzyme.2 Because AZT+3TC is a combination of drugs used
to treat a disease that is dificult to treat, the drugs produced for this purpose require producing laboratories to use methodologies capa-ble of monitoring the stages of production, ensuring a high quality product.
The simultaneous determination of two or more active compo-nents in different pharmaceutical preparations, without previous chemical separation, is a common analytical problem.3 Oficial
monographs, such as The Brazilian Pharmacopoeia and The United States Pharmacopoeia,4,5 describe the determination of AZT and
3TC separately, either as raw material or in different pharmaceutical preparations. No oficial monograph has been found that describes how this association in tablets can be determined.4-9 At the present,
high performance liquid chromatography – HLPC is the technique commonly employed in the pharmaceutical industry to monitor the quality of the end products and the processes, especially when the product has an association of active compounds. A method using HPLC with ultraviolet (UV) detection for the determination of AZT+3TC has recently been described.10 HPLC with Uv detection
and mass spectrometry has also been employed to determine the as-sociation of AZT+3TC in biological luids.11-14 These techniques are,
however, expensive, laborious, present high reagent consumption, and require many analytical manipulations. They also generate a number of chemical residues that must be treated properly. Conse-quently, the development of simpler and cheaper methods for the quality control of processes and end products is important. Uv-vis spectrophotometry can be used in pharmaceutical laboratories for a number of applications.15-21 Few works have been found using this
te-chnique to determine antiretroviral ixed dose combinations. Uslu et al. developed methods for the determination of AZT+3TC in binary mixtures,22 using irst derivate and irst derivative of the ratiospectra
Uv-spectrophotometry, as well as high performance liquid chroma-tography. Methanol has been employed as a solvent for standard solutions and preparation of samples. These methods were validated using synthetic mixtures and tablets from only one pharmaceutical industry. Kapoor et al. have employed derivative spectrometry for the simultaneous determination of Estavudina (d4T) e lamivudine (3TC) antiretroviral in ixed dose combinations.23
Multivariate calibration has also been used to solve the problems of overlapping Uv spectra in mixtures of two or more components and when there is interference from the formulation matrix.24-28 Inverse calibration methods such as Partial Least Square
(PLS) are widely used. In these methods the pure analyte spectrum is not required for modeling.
EXPERIMENTAL
Standard, reagents and solutions
All 3TC and AZT stock solutions (concentrations of 250 mg L-1
3TC and 500 mg L-1 AZT) were prepared from reference standards
produced by the United States Pharmacopoeia.5 The solutions were
prepared with dilutions using ultra-pure water. AZT+3TC tablets with nominal concentrations of 300 e 150 mg, respectively, were kindly provided by ive pharmaceutical manufactors: LAFEPE, Farmanguinhos, IQUEGO, FURP e GlaxoSmithKline. In this work, these manufacturers will be denominated (randomly) A, B, C, D and E. The placebo was formulated according to the procedure used by the LAFEPE in the production of their commercial tablets, and was composed of the following: amide, amide glycolate, microcrystalli-ne cellulose, polivinilpirrolidomicrocrystalli-ne, silicon dioxide, and magmicrocrystalli-nesium stearate. In all the analyses, the commercial samples were prepared by diluting them with ultrapure water. Twenty tablets from each manufacturer were weighed, inely powdered and then the solutions were prepared with 3TC and AZT concentrations of 7.5 e 15 mg L-1,
respectively.
Multivariate calibration and validation set
For the construction of multivariate calibration models, binary mixtures of AZT +3 TC were produced in the laboratory covering a range of 80 and 120% of the nominal value, according to the ANVISA guide (Resolution - RE n º 899, of May 29, 2003) requirements. This guide contains the rules for validation of analytical and bionalytical methods for the quantitative determination of analyte in raw materials or in dosage forms.
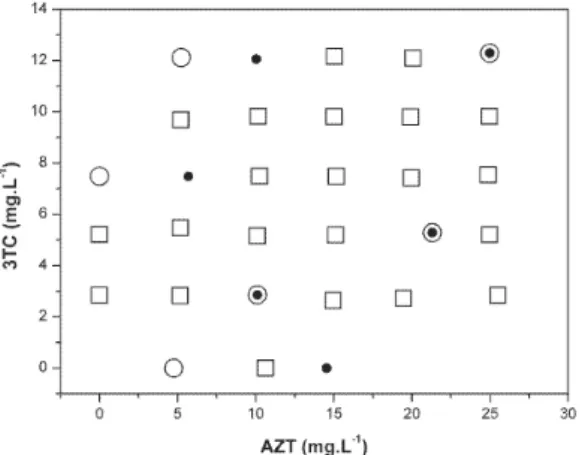
The SPXY algorithm (Sample set Partioning based on joint X-y distances algorithm) was used to select the samples for the calibration and prediction sets.29 22 samples were selected for the calibration set
(). 6 samples were selected to predict the AZT concentration () and 6 samples to predict the 3TC concentration (O). Figure 1 shows the distribution of samples into the calibration and prediction sets of samples; note that two samples were selected to predict the content of both 3CT and AZT. Thirty-nine commercial samples were also used in the validation set.
Partial least square regression (PLS) was employed to build the multivariate calibration models. All the computations were carried out using Unscrambler® 9.8 (CAMO Process A.S) and MVC1 software.30
UV-VIS spectra
A double beam UV-vis spectrometer, Shimadzu®, model UV-2401
PC, using a scanning speed of 8.3 nm s-1 and a quartz cuvette (10
mm optical path), was employed to acquire UV-vis spectra, in the spectral range of 200 to 300 nm. These spectra were used to build the calibration models using derivative spectrometry and PLS.
Reference method
The content of AZT + 3 TC in the samples was determined by a method based on HPLC and validated according to ICH and RE in 899/2003.10,31 The values obtained were used to build calibration
models and to assess the predictive capacity of the models. Reference analyses were performed employing a chromatogra-phic system, Shimadzu®, consisting of binary pumps LC-10 ADvp,
a UV/vis detector SPD 10 Avp in 270 nm, a CTO-10ASvp furnace (30 oC), a SCL-10ADvp controller system and a SIL-10ADvp auto
injector. The stationary phase was a C18 column 125 x 4.6 cm, with a porosity of 5 x 10⁻³ mm and a mobile phase ammonium acetate
(J.T.Baker®) buffer of pH 5.4 and methanol, Merck® (65:35). The low
was 1.0 mL min-1 and injection volume 20 x 10-3 mL. Chromatograms
were obtained and analyzed using Class-VP software.
Dissolution proile
The dissolution proile of the samples was determined using a dilutor, model VK 7010, equipped with a dissolution sampling station (model VK 8000), both from Vankel®. Eight vessels, each containing
900 mL of ultrapure water, rotated at 50 rpm with an apparatus pa-ddle, at a temperature of 37 ± 0.5 oC, were employed in this assay. 2
mL aliquots were collected at time intervals of 3, 6, 10, 15, 20 and 30 min. Each aliquot was transferred to a volumetric lask of 50 mL, so that the theoretical concentrations were 13.33 mg L-1 of AZT and
6.66 mg L-1 of 3TC.
Validation
The methods were validated according to the procedures required by the Speciic Brazilian Resolution RE nº 899 based on the ICH and IUPAC guide.32
RESULTS AND DISCUSSION
UV spectra
Figure 2 shows the aqueous solutions UV Spectra of (A) binary mixture (15 mg L-1 of AZT and 7.5 mg L-1 of 3TC); (B) commercial
tablet, (C) AZT 15 mg L-1; (D) 3TC 7.5 mg L-1 and (E) placebo.
Ob-serving the placebo (E), binary mixture (A) and commercial tablet (B) spectra, there is no evidence of placebo interference in the range of 230 to 300 nm. The calibration set, thus, could be composed of binary mixtures only. A strong band overlap between AZT and 3TC can be seen.
Derivative spectroscopy
The analysis using UV-derivative was carried out based on the work by Uslu et al.. However, water was used as solvent instead of methanol due to its low cost and because it is not harmful to the environment. As a result of the molar absorptivity change, the absorption peaks were different.
Different scan speeds and Savitzky-Golay windows were evaluated. The best conditions obtained were: spectral range of 200 to 300 nm, with
Figure 1. Concentrations of the binary mixtures used in the calibration and
validation sets for the PLS models. Calibration samples (), AZT validation
a scan 8.3 nm s-1 and ∆λ equal to 1.0 nm. The Savitzky-Golay windows
with 11 and 17 points were selected for the irst and second derivatives, respectively. For lamivudine, the values of D1, amplitudes were measured
at 267.3 nm (zero-crossing of zidovudine). D1 amplitudes were measured
at 249.3 nm (zero-crossing of lamivudine) to determine zidovudine. In the second derivative spectra, the amplitudes were measured at 250.7 nm (zero-crossing of AZT) to determine 3TC, and 239.0 and 229.0 nm (zero-crossing of 3TC), to determine AZT.
Spectra of pure component solutions were acquired to build the analytical curves. Linearity was also evaluated employing analytical curves with 8 concentration levels and three authentic replicates, using ANOVA and the lack of it test (at 95% conidence level).31 The linear
ranges for D1 method were: 0.60 to 50.0 and 0.12 to 100 mg L-1, for 3TC
and AZT, respectively. For D2 method the linear ranges were: for λ =
250.7 nm, 0.34 to 50 mg L-1 (3TC); for λ = 229 nm, 0.33 to 0.10 mg L-1
(AZT) and for λ = 239 nm, 1.66 to 0.10 mg L-1 (AZT). The validation
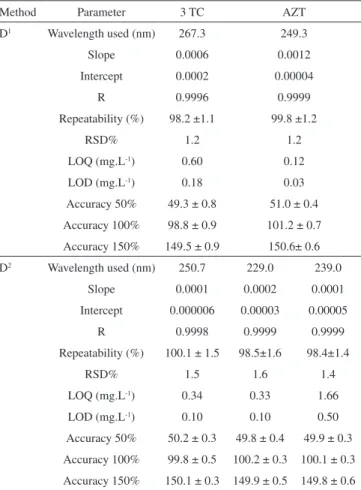
parameters are presented in Table 1. The speciicity of the method was evaluated and no interference from the excipients was found when the method was applied to placebo samples. The accuracy, precision, detection and quantiication limits were validated according to the re-quirements of Brazilian Resolution RE no 899.33 The variables tested for
robustness were: ultra-pure/deionized water; sonication time; iltered and non-iltered samples; and stability (0, 24 e 48 h). No signiicant variation, at 95% conidence level, was observed.
Multivariate calibration
Partial least squares models were built using the UV spectra of the calibration mixtures, the AZT and 3TC content of which had been pre-viously determined by the HPLC reference method. A full cross valida-tion was employed to select the number of PLS factors. A spectral range from 200 to 300 nm was employed irst. When the model was applied to predict the AZT+3TC content in commercial tablets, however, high RMSEP values were obtained, as expected, as can be seen in Figure 2. This problem was attributed to interference from one of the excipients (polivinilpirrolidone), which absorbs in the range of 200-230 nm. This region was excluded and then new models were built using the range of 230 to 300 nm. The igures of merit for univariate methods are well established in the ICH guidelines.31 They are not clearly deined, however,
for multivariate calibration methods, although the literature indicates various strategies.32,34,35 In this work, similar to Blanco,36 validation was
performed to evaluate these parameters: sensibility, selectivity, limit of detection, robustness, accuracy and precision. In the robustness test the same variables were evaluated as in the derivative methods. No signiicant variation, at 95% conidence level, as can be seen in Table 2.
The calibration and validation parameters are presented in Table 3.
The number of latent variables (VL) used in PLS model was determined based on the lower RMSECV, using the Haaland and Tomas criterion. Two latent variables were selected for both models, which is in accor-dance with the number of APIs. Sensitivity (SEN), selectivity (SEL), and limit of detection (LOD) were calculated based on the NAS theory, using the MVC1 algorithm.31 For multivariate calibration, the
selecti-Figure 2. Aqueous solutionUV spectra of (A) Binary mixture of AZT
(15 mg L-1) and 3TC (7.5 mg L-1); (B) commercial tablet, (C) AZT 15 mg L-1;
(D) 3TC 7.5 mg L-1 and (E) placebo
Table 1. Validation of the irst (D1) and second (D2) derivative method
Method Parameter 3 TC AZT
D1 Wavelength used (nm) 267.3 249.3
Slope 0.0006 0.0012
Intercept 0.0002 0.00004
R 0.9996 0.9999
Repeatability (%) 98.2 ±1.1 99.8 ±1.2
RSD% 1.2 1.2
LOQ (mg.L-1) 0.60 0.12
LOD (mg.L-1) 0.18 0.03
Accuracy 50% 49.3 ± 0.8 51.0 ± 0.4 Accuracy 100% 98.8 ± 0.9 101.2 ± 0.7 Accuracy 150% 149.5 ± 0.9 150.6± 0.6 D2 Wavelength used (nm) 250.7 229.0 239.0
Slope 0.0001 0.0002 0.0001 Intercept 0.000006 0.00003 0.00005
R 0.9998 0.9999 0.9999
Repeatability (%) 100.1 ± 1.5 98.5±1.6 98.4±1.4
RSD% 1.5 1.6 1.4
LOQ (mg.L-1) 0.34 0.33 1.66
LOD (mg.L-1) 0.10 0.10 0.50
Accuracy 50% 50.2 ± 0.3 49.8 ± 0.4 49.9 ± 0.3 Accuracy 100% 99.8 ± 0.5 100.2 ± 0.3 100.1 ± 0.3 Accuracy 150% 150.1 ± 0.3 149.9 ± 0.5 149.8 ± 0.6 LOQ – Limit of Quantiication; LOD – Limit of Detection; RSD – Relative Standard Deviation
Table 2. Variables tested for method robustness. t = 2.77 and n = 3 Robustness variables AZT (%) 3TC (%) Water Ultra-pure 96.44 ± 1.58 99.97 ± 0.79
Deionized 95.36 ± 1.19 98.95 ± 0.92 tcalculated 1.0920 1.6823
Soniction time (min)
10 96.84 ± 1.36 97.46 ± 1.71 15 96.54 ± 1.52 97.12 ± 1.40 tcalculated 0.2942 0.3077
Solution type Filtered 97.31 ± 1.03 98.73 ± 1.08 Non-iltered 96.93 ± 0.93 98.11 ± 0.40
tcalculated 0.5476 1.0767
Stability (h) 0 96.77 ± 0.42 99.53 ± 0.33 24 97.03 ± 0.65 99.76 ± 0.84 tcalculated 0.6719 0.5097
vity indicates the part of the total signal that is not lost due to spectral overlap. The sensitivity measures the changes in response as a function of the concentration of a particular the sensitivity measures the changes in response as a function of the concentration of a particular analyte.31,32
Considering the values presented in Tables 2 and 3, the methods were va-lidated, as recommended by the Speciic Brazilian Resolution RE nº 899 based on ICH and IUPAC guide.32
Determination of AZT + 3TC in ixed dose combinations of tablets from different manufacturers
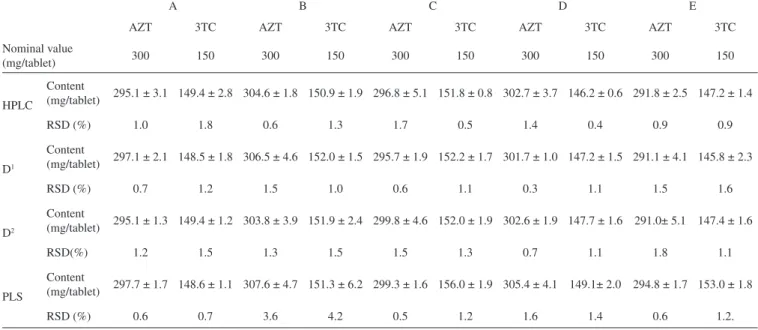
After being validated, three methods (irst and second derivative spectrometry, UV-VIS/PLS and HPLC) were employed to determine the content of AZT+3TC in tablets (nominal concentrations of 150 mg of AZT and 300 mg of 3TC) produced by 5 different manufacturers in Brazil. These pharmaceutical industries are denominated here as A, B, C, D and E. Eight replicates were performed. The results are presented in Table 4. There was no signiicant difference between the results of AZT+3TC content when using derivative and PLS methods and the refe-rence HPLC method, at a 95% conidence level. The RSD are also similar.
Dissolution proile
A dissolution proile is useful to select formulations during the development of the pharmacotechnique process; to evaluate stability; to optimize formulations, to investigate the effects of variations in products that are in use, as well as to present a tool for lot quality control monitor-ing. This assay is also employed to determine the similarity between a generic formulation and its reference product.37 The derivative and PLS
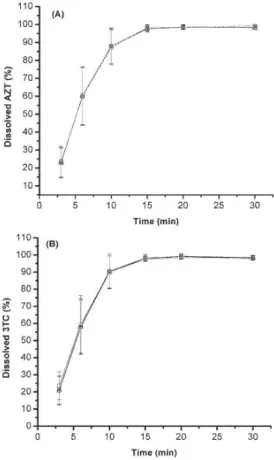
methods were also evaluated and compared with the reference HPLC method in the dissolution proile test. Dissolution tests were carried out on tablets produced by the ive different manufacturers. To compare methods, a t-test was applied at each point of the dissolution proile. No statistically signiicant differences (at 95% conidence level) were found among the results of the methods. This result demonstrates that the derivative and PLS methods may be applied to an extended range of concentrations. Figure 3 shows the proile for laboratory A, as an example. For all methods, the similarity of the results is evident. Results from the irst sampling time showed a large variability due to the technological aspects inherent to the manufacturing process of tablets. Among these,
we may mention the variability of the thickness of the coating layer, particle size and compression force applied. Moreover, irregularities in sampling position may interfere in the results. These factors are most critical in the irst sampling time by the fact that it is realized in 3 min, a time not long enough for the total disintegration of the tablet.
Table 3. Calibration and validation parameters for multivariate calibration
Parameters 3 TC AZT
Calibration (n=22)
RMSEC (mg L-1) 0.14 0.34
RMSECV (mg L-1) 0.17 0.39
Number of latent variables (LV) 2 2 R2 (predicted versus reference values) 0.9977 0.9973
Intercept* (predicted versus reference values) 0.01±0.14 0.03±0.36
Slope* (predicted versus reference values) 0.998±0.020 0.998±0.022
Validation (n=47)
RMSEP (mg L-1) 0.41 0.34
SEL 0.269 0.300
SEN 0.091 0.062
LOD (mg L-1) 0.12 0.16
R2 (predicted versus reference values) 0.9768 0.9947
Intercept* (predicted versus reference values) 0.14±0.23 0.24±0.31
Slope* (predicted versus reference values) 0.976±0.024 0.995±0.022
Repeatability (%) (n=6) 98.0 ±0.9 99.1±0.9
RSD% 0.9 0.9
Accuracy 50% (n=3) 50.3 ± 0.2 50.3 ± 0.2 Accuracy 100% (n=3) 98.4 ± 0.3 100.4 ± 0.4 Accuracy 150% (n=3) 149.0± 1.0 148.9 ± 0.9 * Slope and intercept ±95% conidence interval. RMSECV- Root Mean Standard Error of Calibration; RMSECV - Root Mean Standard Error of Cross Validation; RMSEP- Root Mean Standard Error of Prediction; SEL – Selectivity ; SEN – Sensibility; LOD – Limit of Detection; RSD – Relative Standard Deviation
Table 4. Results for the analysis of tablets from ive different manufacturers, A, B, C, D and E (n = 8)
A B C D E
AZT 3TC AZT 3TC AZT 3TC AZT 3TC AZT 3TC
Nominal value
(mg/tablet) 300 150 300 150 300 150 300 150 300 150
HPLC
Content
(mg/tablet) 295.1 ± 3.1 149.4 ± 2.8 304.6 ± 1.8 150.9 ± 1.9 296.8 ± 5.1 151.8 ± 0.8 302.7 ± 3.7 146.2 ± 0.6 291.8 ± 2.5 147.2 ± 1.4
RSD (%) 1.0 1.8 0.6 1.3 1.7 0.5 1.4 0.4 0.9 0.9
D1
Content
(mg/tablet) 297.1 ± 2.1 148.5 ± 1.8 306.5 ± 4.6 152.0 ± 1.5 295.7 ± 1.9 152.2 ± 1.7 301.7 ± 1.0 147.2 ± 1.5 291.1 ± 4.1 145.8 ± 2.3
RSD (%) 0.7 1.2 1.5 1.0 0.6 1.1 0.3 1.1 1.5 1.6
D2
Content
(mg/tablet) 295.1 ± 1.3 149.4 ± 1.2 303.8 ± 3.9 151.9 ± 2.4 299.8 ± 4.6 152.0 ± 1.9 302.6 ± 1.9 147.7 ± 1.6 291.0± 5.1 147.4 ± 1.6
RSD(%) 1.2 1.5 1.3 1.5 1.5 1.3 0.7 1.1 1.8 1.1
PLS
Content
(mg/tablet) 297.7 ± 1.7 148.6 ± 1.1 307.6 ± 4.7 151.3 ± 6.2 299.3 ± 1.6 156.0 ± 1.9 305.4 ± 4.1 149.1± 2.0 294.8 ± 1.7 153.0 ± 1.8
CONCLUSION
In this work, the spectrophotometric multivariate calibration method was validated and successfully applied to the simultaneous determination of lamivudine and zidovudine in ixed dose combinations for tablets from different manufacturers. Multivariate calibration method produced results similar to the reference HPLC method but was simpler, faster, and cheaper to use. The results of the multivariate method were also similar to the derivative methods. The zero-crossing derivative methods, however, may produce a considerable loss of accuracy and sensitivity because the measurements were taken at a very critical wavelength.22 Thus, the
mul-tivariate calibration method could be considered advantageous in relation to the derivative method. The use of multivariate calibration methods associated with spectroscopic methods, as an alternative to traditional univariate methods, has the advantage of simultaneous determination, which saves labor and considerably reduces the cost of the experiment (in terms of reagent consumption, time and waste generation). They can be very useful in product development and for process monitoring.
Despite these advantages, multivariate methods are not acceptable as an oficial method for the analysis of the inal product. One of the reasons for this could be attributed to the need of a representative calibration set containing samples with a concentration range larger than the nominal content of the tablets produced by the industry. This is a practical critical aspect when near infrared spectroscopy is employed. In this work, using UV spectroscopy, as there is no evidence of placebo interference in the range of 230 to 300 nm, the calibration set was composed only by binary mixtures covering ± 20% of the nominal content.
Figure 3. Dissolution proiles for AZT+3TC tablet from laboratory A,
em-ploying HPLC, PLS, irst (D1) and second (D2) derivative methods
REFERENCES
1. Physicians’ Desk Reference, 42nd ed.; N.J.: Medical Economics Co.: New Jersey,
1988.
2. Moore, K. H.; Shaw, S.; Laurent, A. L.; Lloyd, P.; Duncan, B.; Morris, D. M.; O’mara, M. J.; Pakes, G. E.; J. Clin. Pharmacol.1999, 39, 593.
3. Özgür; M. Ü.; Alpdogan, G.; Koyuncu, I.; Anal. Lett.2002, 35, 721. 4. Farmacopéia Brasileira, IV ed.; Atheneu: São Paulo, 2002.
5. The United States Pharmacopeia, 31th ed.; NF-26, Rockville, 2008.
6. British Pharmacopoeia, The Stationery Ofice: London, 2008. 7. Farmacopéia Portuguesa, 8a ed.; Infarmed: Lisboa, 2005.
8. Farmacopea de Los Estados Unidos Mexicanos, 8a ed.; FEUM: Mexico, 2004.
9. The Japanese Pharmacopoeia, available at http://jpdb.nihs.go.jp/jp14e/contents. html, accessed April 2008.
10. Beck, R. C. R; Cardoso, S. G.; Athayde, M. L.; Codevilla, C.; Kreutz, O.; Dalmora, S. L.; Quim. Nova2007, 30, 1225.
11. Wissen, C. P. W. G. M. V.; Aernoutse, R. E.; Burgern, D. M.; J. Chromatogr., B: Anal. Technol. Biomed. Life Sci.2005, 816, 121.
12. Fan, B.; Stewart, J. T.; J. Pharm. Biomed. Anal. 2002, 28, 903.
13. Nascimento, J. E.; Magalhães, N. S. S.; Ribeiro, P. A.; Alves, A. J.; Braz. J. Pharm. Sci.2004, 40, 60.
14. Kenney, K. B.; Wring, S. A.; Carr, R. M.; Wells, G. N.; Dunn, J. A.; J. Pharm. Biom. Anal.2000, 22, 967.
15. Karpiska, J.; Sokól, A.; Skoczylas, M.; Spectrochim. Acta, Part A2008, 71, 1562. 16. Benamor, M.; Aguerssif, N.; Spectrochim. Acta, Part A2008, 69, 676 17. Hadad, G. M.; El-Gindy, A.; Mahmoud, W. M. M.; Spectrochim. Acta, Part A
2008, 70, 655.
18. El-Yazbi, F. A.; Hammud, H. H.; Sulaf, A. A.; Spectrochim. Acta, Part A2007,
68, 275.
19. Busaranon, K.; Suntornsuk, W.; Suntornsuk, L.; J. Pharm. Biom. Anal.2006,
41, 158.
20. Shehata, M. A. M.; El Sabed, M. A; El Tarras, M. F.; El Bardicy, M. G.; J. Pharm. Biom. Anal.2005, 38, 72.
21. Garcia, P. L.; Santoro, M. I. R. M.; Kedor-Hackman, E. R. M.; Singh, A. K.; J. Pharm. Biom. Anal. 2005, 39, 764.
22. Uslu, B.; Ozkan, S. A.; Anal. Chim. Acta 2002, 466, 175.
23. Kapoor, N.; Khandavilli, S.; Panchagnula, R.; J. Pharm. Biom. Anal.2006, 41, 761.
24. Markopoulou, C. K.; Malliou, E. T.; Koundourellis, J. E.; Il Farmaco2004, 59, 627.
25. Yongnian, N.; Zhengbao, Q.; Kokot, S.; Chem. Intell. Lab. Syst.2006, 82, 241. 26. Khoshayand, M. R.; Abdollahi, H.; Shariatpanahi, M.; Saadatfard, A.;
Moham-madia, A.; Spectrochim. Acta, Part A2008, 70, 491. 27. Metwally, F. H.; Spectrochim. Acta, Part A2008, 69, 343. 28. Nian, N. Y.; Xiao, W. Q.; Chin. Chem. Lett.2008, 19, 981.
29. Galvão, R. K. H.; Araujo, M. C. U.; Jose, G. E.; Ponte, M. J. C.; Silva, E. C.; Saldanha, T. C. B.; Talanta2005, 67, 736.
30. Olivieri, A. C.; Goicoechea, H. C.; Iñón, F. A.; Chem. Intell. Lab. Syst. 2004, 73, 189.
31. ICH Guidelines: Q2(R1) Text on Validation of Analytical Procedures; at http:// www.ich.org/LOB/media/MEDIA417.pdf, accessed May 2009.
32. Olivieri, A. C.; Faber, N. M.; Ferré, J.; Boqué, R.; Kalivas, J. H.; Mark, H.; Pure Appl. Chem.2006,78, 661.
33. Brasil. Resolução RE nº899 de 29/5/2003; Diário Oicial da União, Brasília, DF, 02/06/2003, seção 1 - Agência Nacional de Vigilância Sanitária (ANVISA) aprova o Guia para validação de métodos analíticos e bioanalíticos.
34. Metwally, F. H.; Spectrochim. Acta, Part A2008, 69, 343. 35. Braga, J. W. B.; Poppi, R. J.; Quim. Nova2004, 27, 1004.
36. Blanco, M.; Eustaquio, A.; González, J. M.; Serrano, D.; J. Pharm. Biom. Anal.
2000, 22, 139.