BRAZILIAN JOURNAL OF OCEANOGRAPHY, 58(1):53-70, 2010
BRAZILIAN OFFSHORE WAVE CLIMATE BASED ON NWW3 REANALYSIS
Cássia Pianca1*, Piero Luigi F. Mazzini2and Eduardo Siegle1**
1Instituto Oceanográfico da Universidade de São Paulo
(Praça do Oceanográfico, 191, 05508-120 São Paulo, SP, Brasil) *[email protected]; **[email protected]
2Oregon State University
PhD student - Physical Oceanography - College of Oceanic & Atmospheric Sciences (104 COAS Admin Bldg - Corvallis, OR 97331-5503 - Office: Burt 293 – United States)
A
B S T R A C TThis paper provides a description of the wave climate off the Brazilian coast based on an eleven-year time series (Jan/1997-Dec/2007) obtained from the NWW3 operational model hindcast reanalysis. Information about wave climate in Brazilian waters is very scarce and mainly based on occasional short-term observations, the present analysis being the first covering such temporal and spatial scales. To define the wave climate, six sectors were defined and analyzed along the Brazilian shelf-break: South (W1), Southeast (W2), Central (W3), East (W4), Northeast (W5) and North (W6). W1, W2 and W3 wave regimes are determined by the South Atlantic High (SAH) and the passage of synoptic cold fronts; W4, W5 and W6 are controlled by the Intertropical Convergence Zone (ITCZ) and its meridional oscillation. The most energetic waves are from the S, generated by the strong winds associated to the passage of cold fronts, which mainly affect the southern region. Wave power presents a decrease in energy levels from south to north, with its annual variation showing that the winter months are the most energetic in W1 to W4, while in W5 and W6 the most energetic conditions occur during the austral summer. The information presented here provides boundary conditions for studies related to coastal processes, fundamental for a better understanding of the Brazilian coastal zone.
R
E S U M OO presente trabalho apresenta o clima de ondas da região ao largo da costa brasileira com base em uma série temporal de onze anos (Jan/1997-Dez/2007) obtida através de dados de reanálise do modelo operacional NWW3. Informações sobre o regime de ondas no Brasil são escassas e baseadas em observações ocasionais de curto período, sendo a presente análise inédita na escala espaço-temporal apresentada. Para a definição do clima de ondas foram definidos e analisados seis setores ao longo da quebra da plataforma continental brasileira: Sul (W1), Sudeste (W2), Central (W3), Leste (W4), Nordeste (W5) e Norte (W6). W1, W2 e W3 possuem os regimes de ondas controlados pela Alta Subtropical do Atlântico Sul (ASAS) e pela passagem de frentes frias sinóticas; W4, W5 e W6 são controlados pela Zona de Convergência Intertropical (ZCIT) e sua oscilação meridional. As ondas mais energéticas são de S, geradas por ventos intensos associados à passagem de frentes frias, afetando principalmente a região sul e sudeste do país. A energia das ondas apresenta um decréscimo de sul para norte, com a sua variação anual mostrando que o período de inverno as ondas são mais energéticas nos setores W1 a W4, enquanto que nos setores W5 e W6 as condições mais energéticas ocorrem nos meses de verão do hemisfério sul. As informações aqui apresentadas fornecem condições de contorno para diferentes estudos relacionados a processos costeiros, fundamentais para a melhor compreensão da zona costeira do Brasil.
Descriptors: Sea state, waves, Brazilian Coast, WaveWatch III. Descritores: Estado do mar, Ondas, costa brasileira, WaveWatch III.
I
NTRODUCTIONThe offshore wave field defines the amount of wave-generated energy delivered to the coastal zone; its characterization is, therefore, of prime importance for the study of coastal processes. These waves are generated by winds that blow over the sea __________
Contr. No. 885 do Inst. oceanogr. da Usp.
the coast, being responsible for controlling the morphological features of the coastline. When waves approach the coast and break on a sloping beach, they generate a variety of currents in the nearshore, determining the direction of the movement of beach sediments (KOMAR, 1998).
Additionally to the coastal morphodynamic processes, the knowledge of the wave climate of a region becomes increasingly important due to the use of coastal areas by humans. Being home for 70 % of all human beings (CHERFAS, 1990), activities in coastal areas depend on the understanding of the regional forcing conditions.
The objective of this paper is to describe the general wave climate off the Brazilian coast thus providing boundary conditions for regional studies of wave-generated processes. In spite of their importance, wave measurements in Brazil are very scarce, and only a few studies assessed regional wave characteristics based on short-term observations (e.g.: CANDELLA, 1997; PEREIRA et al., 2000; ARAÚJO et al., 2003;
BENSI et al., 2005). However, with the development
of accurate ocean-atmosphere interaction models such as the NOAA WAVEWATCH-III - NWW3
(TOLMAN, 1999), it has become possible to obtain
long term time series data from model hindcast. This paper aims to present basic wind generated wave characteristics for the whole offshore region of Brazil, based on an eleven-year time series (Jan/1997-Dec/2007) of wave data extracted from the NWW3 operational wave model hindcast reanalysis. This analysis, on such temporal and spatial scale, provides new information on the wave climate of the Brazilian coast. Offshore wave data are very useful as boundary conditions for coastal wave models (e.g. SEBASTIÃO et al., 2000; SIEGLE et al., 2004; SIEGLE; ASP, 2007; SIEGLE et al., 2007; BITTENCOURT et al., 2007; RUSU et al., 2008). The frequency tables used in the analysis shown here will be made available at the Oceanographic Institute of the University of São Paulo (IO/USP) Coastal Dynamics
Lab.website (http://ldc.io.usp.br/waves).
The NOAA WAVEWATCH-III model was developed at the National Center for Environmental Prediction (NCEP) of the National Oceanic and Atmospheric Administration (NOAA) of the United States of America (TOLMAN, 1999). The model solves the spectral action density balance equation for wave number-direction spectra. The growth, refraction, and decay of each component of the complete sea state, for each specific frequency and direction are solved, giving complete and realistic characteristics of the transient wave field. The physical processes included in the model are: refraction and straining of the wave field due to temporal and spatial variations of the mean water depth and of the mean current, wave growth and decay due to the actions of
wind, nonlinear resonant interactions, dissipation by white-capping, and bottom friction. Further details of the WAVEWATCH-III model can be found in Tolman (1999).
The global model includes the entire globe as its domain, with a spatial resolution of 1° × 1.25°, in latitude and longitude respectively, with the grid ranging from 78°N to 78°S, and uses wind fields and air–sea temperature differences as input. The NWW3 operational model has as input 3 hourly winds from the operational Global Data Assimilation Scheme (GDAS) and the aviation cycle of the Medium Range Forecast model (KANAMITSU, 1989; KANAMITSU
et al., 1991; DERBER et al., 1991; CAPLAN et al.,
1997), called now the Global Forecast System or GFS. Sea Surface Temperatures are also obtained from the GDAS, as they are needed in the stability correction for wave growth.
M
ETHODSAvailable Data
The data used in this paper are available from the NOAA/NCEP wave generation model WAVEWATCH III (TOLMAN, 1997, 1999). These model runs based on the NCEP wind data reanalysis for an eleven-year period are used here to define the wave climate for the Brazilian coast. Significant wave height, period and direction, ranging from January/1997 to December/2007, were extracted from the NWW3 operational wave model hindcast reanalysis (archived), available for downloading at the internet website http://polar.ncep.noaa.gov/waves. The data are provided at 3-hour intervals, at 00:00h, 03:00h, 06:00h, 09:00h, 12:00h, 15:00h, 18:00h and 21:00h every day. This dataset constitutes the basis of the analyses conducted in this paper.
Coastal Sectors
The Brazilian coastline has an extension of
approximately 9,200 km, presenting a very diverse
suite of coastal environments (DOMINGUEZ, 2009). In order to define the wave climate acting on these varying environments, we defined six wave data extraction points off the Brazilian coast (Fig. 1). Central grid points based on the model grid (1º latitude x 1.25º longitude) have, therefore, been defined off each coastal sector close to the shelf break (at water depths greater than 200 m), as follows:
• W1 (32oS, 48.75oW) - Southern Sector;
• W2 (26oS, 45oW) - Southeastern Sector;
• W3 (19oS, 36.25oW) - Central Sector;
• W4 (9oS, 33.75oW) - Eastern Sector;
• W5 (3oS, 37.5oW) - Northeastern Sector;
Fig. 1. Study area with the grid points used in the analysis. The 200-meter isobath indicates the shelf break.
Data Validation
Since only limited measured wave time series are available for the region of interest, we make a qualitative comparison of the data from the NWW3 hindcast reanalysis with the data measured by the LAHIMAR/UFSC off Florianópolis (Santa Catarina Island) and presented by Araújo et al. (2003). Data from the NWW3 was, therefore, extracted from the
closest grid point to the waverider, at 28oS 47.5oW
(Fig. 2). The period selected for comparison is that from December 2001 to January 2003, which is covered by the measured data.
Data Analysis
Wave climate may be defined as the set of prevailing wave conditions that reach a particular oceanic or coastal region over a defined time interval
(INMAN; MASTERS, 1994).Therefore, based on the
available dataset, the simple statistical analysis presented here aims to describe the general wave climate for each sector of the Brazilian coast. The wave climate is given based on seasonal directional histograms and basic statistics, such as minimum, maximum, mean, range, standard deviation and
variance for the significant wave height and period. In the plotted wave roses, their bars point in the direction from which waves travel.
49oW 30' 48oW 30' 47oW 29oS
30' 28oS 30' 27oS 30'
-50 -100
-200
-1000 Florianopolis
Longitude
L
a
ti
tu
d
e
Waverider
NWW3
Fig. 2. Locations of the waverider buoy used by Araújo et al. (2003) and the NWW3 grid point used for model validation.
Further, in order to quantify the synergy of
wave height and period in each sector, wave power P
was calculated by:
π
ρ
2 2 /32T H g
P= (1)
where
ρ
is water density (1,027 kg/m3), g theacceleration due to gravity, H the wave height (m) and
T the wave period (s). P is given in W/m.
R
ESULTSData Validation
Hindcasts from global wave generation models such as NWW3 have been verified by comparing their outputs with measured data (e.g. WANG; SWAIL, 2001; GRAHAM; DIAZ, 2001; TOLMAN et al., 2002; CAIRES et al., 2004). These studies show that although some uncertainties are involved in the modeling process due to model limitations and wind data, they prove to be very useful for examining the wave climate and particular wave events. For example, Tolman et al. (2002) compared the NWW3 output with several buoy measurements and concluded that the model overestimates the wave heights by about 10 %.
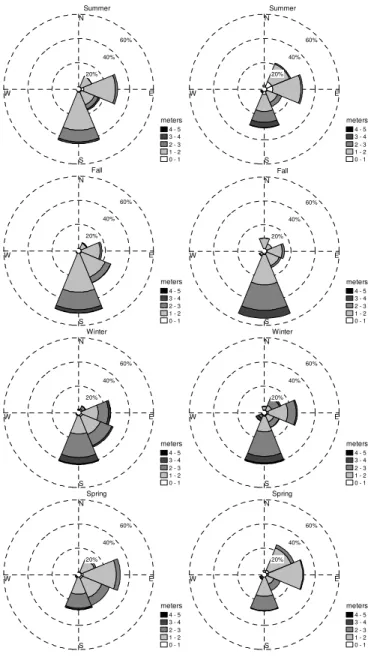
Qualitative comparisons between seasonal waves characteristics, based on observations by Araújo et al. (2003) and NWW3 hindcast reanalysis,
are presented in Figure 3. The overall comparison shows similar wave patterns for both the measured and modeled data. Comparing the seasonal wave climate, during summer the directions are very similar, with the main direction of incidence being from the south (42% in the observations; 30% in the model). The model slightly overestimates the occurrence of higher waves (3-4 m) from the south. Easterly waves are well represented by the model, including the height classes. The occurrence of the northeasterly waves is overestimated by the modeled data. This might be a result of the distance between the more protected
(inshore) measurement and the exposed grid node in
the model (approximately 80km offshore).
Southeasterly waves are well represented by the model, with only small differences in wave heights. During fall months, with the exception of a modeled underestimation of the southeasterly waves, the overall wave climate is well represented by the model. During winter, the dominant southerly waves are well represented, with the main differences being related to the model´s underestimation of the occurrence of southeasterly waves and its overestimation of that of northeasterly waves.
60% 40% 20%
W E
S N
0 - 1 1 - 2 2 - 3 3 - 4 4 - 5
Summer
meters
60% 40% 20%
W E
S N
0 - 1 1 - 2 2 - 3 3 - 4 4 - 5
Summer
meters
60% 40% 20%
W E
S N
0 - 1 1 - 2 2 - 3 3 - 4 4 - 5
Fall
meters
60% 40% 20%
W E
S N
0 - 1 1 - 2 2 - 3 3 - 4 4 - 5
Fall
meters
60% 40% 20%
W E
S N
0 - 1 1 - 2 2 - 3 3 - 4 4 - 5
Winter
meters
60% 40% 20%
W E
S N
0 - 1 1 - 2 2 - 3 3 - 4 4 - 5
Winter
meters
60% 40% 20%
W E
S N
0 - 1 1 - 2 2 - 3 3 - 4 4 - 5
Spring
meters
60% 40% 20%
W E
S N
0 - 1 1 - 2 2 - 3 3 - 4 4 - 5
Spring
meters
These comparisons, although qualitative, show that the overall wave climate is well represented by the model for the year compared in one of the coastal sectors of the Brazilian coast. Thus, in the description of the results presented below, we assume that the modeled wave data are representative of the wave climate for the study area.
Brazilian Sectors
In this section we describe the results relating to the seasonal wave climate for each of the
six coastal sectors defined above. Results are based on the percentage of wave occurrence for each season. Directional histograms of seasonal wave heights and periods for each sector are presented in Figures 4 to 9, with Tables 1, 2 and 3 presenting respectively the seasonal statistics of wave heights, periods and directions. Results are described in topics according to their seasonal statistics during the
eleven-yearperiod.
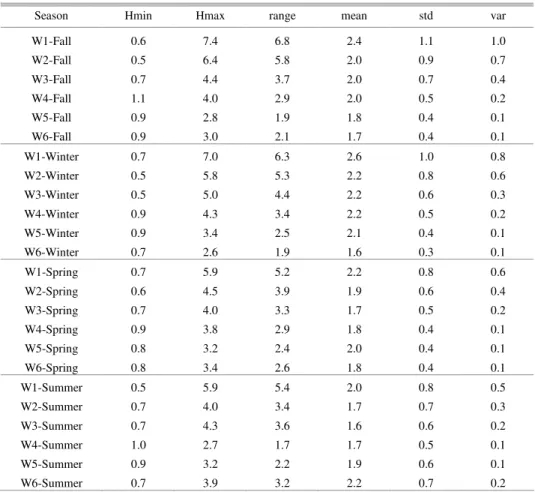
Table 1. Statistics of the seasonal wave heights for each point.
Season Hmin Hmax range mean std var
W1-Fall 0.6 7.4 6.8 2.4 1.1 1.0
W2-Fall 0.5 6.4 5.8 2.0 0.9 0.7
W3-Fall 0.7 4.4 3.7 2.0 0.7 0.4
W4-Fall 1.1 4.0 2.9 2.0 0.5 0.2
W5-Fall 0.9 2.8 1.9 1.8 0.4 0.1
W6-Fall 0.9 3.0 2.1 1.7 0.4 0.1
W1-Winter 0.7 7.0 6.3 2.6 1.0 0.8
W2-Winter 0.5 5.8 5.3 2.2 0.8 0.6
W3-Winter 0.5 5.0 4.4 2.2 0.6 0.3
W4-Winter 0.9 4.3 3.4 2.2 0.5 0.2
W5-Winter 0.9 3.4 2.5 2.1 0.4 0.1
W6-Winter 0.7 2.6 1.9 1.6 0.3 0.1
W1-Spring 0.7 5.9 5.2 2.2 0.8 0.6
W2-Spring 0.6 4.5 3.9 1.9 0.6 0.4
W3-Spring 0.7 4.0 3.3 1.7 0.5 0.2
W4-Spring 0.9 3.8 2.9 1.8 0.4 0.1
W5-Spring 0.8 3.2 2.4 2.0 0.4 0.1
W6-Spring 0.8 3.4 2.6 1.8 0.4 0.1
W1-Summer 0.5 5.9 5.4 2.0 0.8 0.5
W2-Summer 0.7 4.0 3.4 1.7 0.7 0.3
W3-Summer 0.7 4.3 3.6 1.6 0.6 0.2
W4-Summer 1.0 2.7 1.7 1.7 0.5 0.1
W5-Summer 0.9 3.2 2.2 1.9 0.6 0.1
W6-Summer 0.7 3.9 3.2 2.2 0.7 0.2
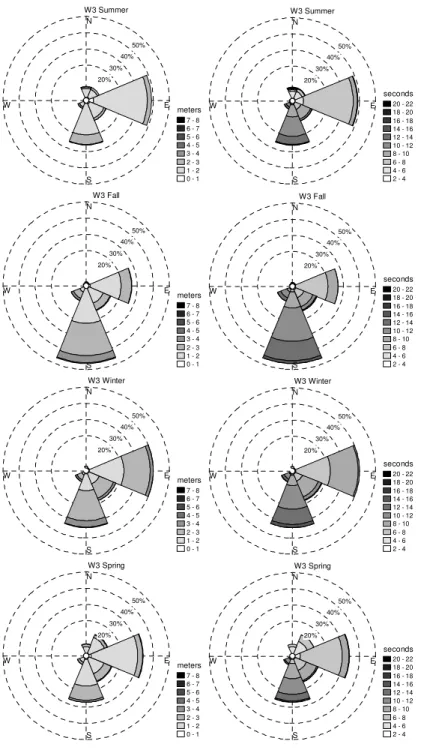
Table 2. Statistics of the seasonal wave periods for each point.
Season Tmin Tmax range mean std var
W1-Fall 3.2 15.7 12.5 8.3 2.5 4.9
W2-Fall 2.9 15.7 12.8 8.9 2.7 5.3
W3-Fall 3.1 16.1 13.0 9.6 2.6 5.0
W4-Fall 4.4 16.3 11.8 8.9 2.6 4.9
W5-Fall 4.2 16.3 12.2 7.4 1.9 2.4
W6-Fall 4.1 15.9 11.8 7.5 1.6 1.2
W1-Winter 3.1 15.6 12.5 8.2 2.2 4.0
W2-Winter 3.1 16.2 13.1 8.7 2.3 4.4
W3-Winter 3.0 17.6 14.6 9.4 2.3 4.4
W4-Winter 4.0 17.4 13.4 8.7 2.1 3.5
W5-Winter 4.1 14.7 10.7 6.9 1.2 0.8
W6-Winter 4.3 16.0 11.6 7.5 1.1 0.5
W1-Spring 3.1 14.5 11.4 7.6 1.9 2.9
W2-Spring 3.5 16.2 12.7 7.7 1.9 3.0
W3-Spring 4.1 17.7 13.7 8.0 2.3 4.7
W4-Spring 3.5 21.3 17.8 8.3 2.5 5.5
W5-Spring 3.7 21.4 17.7 7.8 2.7 6.4
W6-Spring 5.1 18.5 13.5 8.3 2.2 4.0
W1-Summer 2.9 15.5 12.6 7.6 2.7 3.5
W2-Summer 3.1 16.5 13.4 7.8 2.8 4.0
W3-Summer 3.5 17.5 14.0 8.2 3.1 5.5
W4-Summer 4.2 19.4 15.2 8.8 3.3 6.4
W5-Summer 4.2 18.3 14.1 9.3 3.6 7.5
W6-Summer 4.1 16.5 12.3 8.7 2.9 3.6
Table 3. Statistics of the seasonal wave directions for each point.
Season mean std
W1-Fall 143 79
W2-Fall 151 58
W3-Fall 154 54
W4-Fall 130 51
W5-Fall 95 60
W6-Fall 61 43
W1-Winter 130 81
W2-Winter 134 58
W3-Winter 139 50
W4-Winter 130 32
W5-Winter 115 18
W6-Winter 95 26
W1-Spring 112 70
W2-Spring 121 54
W3-Spring 119 62
W4-Spring 130 68
W5-Spring 130 90
W6-Spring 93 82
W1-Summer 117 70
W2-Summer 121 61
W3-Summer 120 67
W4-Summer 130 96
W5-Summer 142 141
40%
30%
20%
10%
W E
S N
0 - 1 1 - 2 2 - 3 3 - 4 4 - 5 5 - 6 6 - 7 7 - 8
W1 Summer
meters
40%
30%
20%
10%
W E
S N
2 - 4 4 - 6 6 - 8 8 - 10 10 - 12 12 - 14 14 - 16 16 - 18 18 - 20 20 - 22
W1 Summer
seconds
40%
30%
20%
10%
W E
S N
0 - 1 1 - 2 2 - 3 3 - 4 4 - 5 5 - 6 6 - 7 7 - 8
W1 Fall
meters
40%
30%
20%
10%
W E
S N
2 - 4 4 - 6 6 - 8 8 - 10 10 - 12 12 - 14 14 - 16 16 - 18 18 - 20 20 - 22
W1 Fall
seconds
40%
30%
20%
10%
W E
S N
0 - 1 1 - 2 2 - 3 3 - 4 4 - 5 5 - 6 6 - 7 7 - 8
W1 Winter
meters
40%
30%
20%
10%
W E
S N
2 - 4 4 - 6 6 - 8 8 - 10 10 - 12 12 - 14 14 - 16 16 - 18 18 - 20 20 - 22
W1 Winter
seconds
40%
30%
20%
10%
W E
S N
0 - 1 1 - 2 2 - 3 3 - 4 4 - 5 5 - 6 6 - 7 7 - 8
W1 Spring
meters
40%
30%
20%
10%
W E
S N
2 - 4 4 - 6 6 - 8 8 - 10 10 - 12 12 - 14 14 - 16 16 - 18 18 - 20 20 - 22
W1 Spring
seconds
50%
40%
30%
20%
W E
S N
0 - 1 1 - 2 2 - 3 3 - 4 4 - 5 5 - 6 6 - 7 7 - 8
W2 Summer
meters
50%
40%
30%
20%
W E
S N
2 - 4 4 - 6 6 - 8 8 - 10 10 - 12 12 - 14 14 - 16 16 - 18 18 - 20 20 - 22
W2 Summer
seconds
50%
40%
30%
20%
W E
S N
0 - 1 1 - 2 2 - 3 3 - 4 4 - 5 5 - 6 6 - 7 7 - 8
W2 Fall
meters
50%
40%
30%
20%
W E
S N
2 - 4 4 - 6 6 - 8 8 - 10 10 - 12 12 - 14 14 - 16 16 - 18 18 - 20 20 - 22
W2 Fall
seconds
50%
40%
30%
20%
W E
S N
0 - 1 1 - 2 2 - 3 3 - 4 4 - 5 5 - 6 6 - 7 7 - 8
W2 Winter
meters
50%
40%
30%
20%
W E
S N
2 - 4 4 - 6 6 - 8 8 - 10 10 - 12 12 - 14 14 - 16 16 - 18 18 - 20 20 - 22
W2 Winter
seconds
50%
40%
30%
20%
W E
S N
0 - 1 1 - 2 2 - 3 3 - 4 4 - 5 5 - 6 6 - 7 7 - 8
W2 Spring
meters
50%
40%
30%
20%
W E
S N
2 - 4 4 - 6 6 - 8 8 - 10 10 - 12 12 - 14 14 - 16 16 - 18 18 - 20 20 - 22
W2 Spring
seconds
50%
40%
30%
20%
W E
S N
0 - 1 1 - 2 2 - 3 3 - 4 4 - 5 5 - 6 6 - 7 7 - 8
W3 Summer
meters
50%
40%
30%
20%
W E
S N
2 - 4 4 - 6 6 - 8 8 - 10 10 - 12 12 - 14 14 - 16 16 - 18 18 - 20 20 - 22
W3 Summer
seconds
50%
40%
30%
20%
W E
S N
0 - 1 1 - 2 2 - 3 3 - 4 4 - 5 5 - 6 6 - 7 7 - 8
W3 Fall
meters
50%
40%
30%
20%
W E
S N
2 - 4 4 - 6 6 - 8 8 - 10 10 - 12 12 - 14 14 - 16 16 - 18 18 - 20 20 - 22
W3 Fall
seconds
50%
40%
30%
20%
W E
S N
0 - 1 1 - 2 2 - 3 3 - 4 4 - 5 5 - 6 6 - 7 7 - 8
W3 Winter
meters
50%
40%
30%
20%
W E
S N
2 - 4 4 - 6 6 - 8 8 - 10 10 - 12 12 - 14 14 - 16 16 - 18 18 - 20 20 - 22
W3 Winter
seconds
50%
40%
30%
20%
W E
S N
0 - 1 1 - 2 2 - 3 3 - 4 4 - 5 5 - 6 6 - 7 7 - 8
W3 Spring
meters
50%
40%
30%
20%
W E
S N
2 - 4 4 - 6 6 - 8 8 - 10 10 - 12 12 - 14 14 - 16 16 - 18 18 - 20 20 - 22
W3 Spring
seconds
60%
40%
20%
W E
S N
0 - 1 1 - 2 2 - 3 3 - 4 4 - 5 5 - 6 6 - 7 7 - 8
W4 Summer
meters
60%
40%
20%
W E
S N
2 - 4 4 - 6 6 - 8 8 - 10 10 - 12 12 - 14 14 - 16 16 - 18 18 - 20 20 - 22
W4 Summer
seconds
60%
40%
20%
W E
S N
0 - 1 1 - 2 2 - 3 3 - 4 4 - 5 5 - 6 6 - 7 7 - 8
W4 Fall
meters
60%
40%
20%
W E
S N
2 - 4 4 - 6 6 - 8 8 - 10 10 - 12 12 - 14 14 - 16 16 - 18 18 - 20 20 - 22
W4 Fall
seconds
60%
40%
20%
W E
S N
0 - 1 1 - 2 2 - 3 3 - 4 4 - 5 5 - 6 6 - 7 7 - 8
W4 Winter
meters
60%
40%
20%
W E
S N
2 - 4 4 - 6 6 - 8 8 - 10 10 - 12 12 - 14 14 - 16 16 - 18 18 - 20 20 - 22
W4 Winter
seconds
60%
40%
20%
W E
S N
0 - 1 1 - 2 2 - 3 3 - 4 4 - 5 5 - 6 6 - 7 7 - 8
W4 Spring
meters
60%
40%
20%
W E
S N
2 - 4 4 - 6 6 - 8 8 - 10 10 - 12 12 - 14 14 - 16 16 - 18 18 - 20 20 - 22
W4 Spring
seconds
90%
60%
40%
20%
W E
S N
0 - 1 1 - 2 2 - 3 3 - 4 4 - 5 5 - 6 6 - 7 7 - 8
W5 Summer
meters
90%
60%
40%
20%
W E
S N
2 - 4 4 - 6 6 - 8 8 - 10 10 - 12 12 - 14 14 - 16 16 - 18 18 - 20 20 - 22
W5 Summer
seconds
90%
60%
40%
20%
W E
S N
0 - 1 1 - 2 2 - 3 3 - 4 4 - 5 5 - 6 6 - 7 7 - 8
W5 Fall
meters
90%
60%
40%
20%
W E
S N
2 - 4 4 - 6 6 - 8 8 - 10 10 - 12 12 - 14 14 - 16 16 - 18 18 - 20 20 - 22
W5 Fall
seconds
90%
60%
40%
20%
W E
S N
0 - 1 1 - 2 2 - 3 3 - 4 4 - 5 5 - 6 6 - 7 7 - 8
W5 Winter
meters
90%
60%
40%
20%
W E
S N
2 - 4 4 - 6 6 - 8 8 - 10 10 - 12 12 - 14 14 - 16 16 - 18 18 - 20 20 - 22
W5 Winter
seconds
90%
60%
40%
20%
W E
S N
0 - 1 1 - 2 2 - 3 3 - 4 4 - 5 5 - 6 6 - 7 7 - 8
W5 Spring
meters
90%
60%
40%
20%
W E
S N
2 - 4 4 - 6 6 - 8 8 - 10 10 - 12 12 - 14 14 - 16 16 - 18 18 - 20 20 - 22
W5 Spring
seconds
90%
60%
30%
W E
S N
0 - 1 1 - 2 2 - 3 3 - 4 4 - 5 5 - 6 6 - 7 7 - 8
W6 Summer
meters
90%
60%
30%
W E
S N
2 - 4 4 - 6 6 - 8 8 - 10 10 - 12 12 - 14 14 - 16 16 - 18 18 - 20 20 - 22
W6 Summer
seconds
90%
60%
30%
W E
S N
0 - 1 1 - 2 2 - 3 3 - 4 4 - 5 5 - 6 6 - 7 7 - 8
W6 Fall
meters
90%
60%
30%
W E
S N
2 - 4 4 - 6 6 - 8 8 - 10 10 - 12 12 - 14 14 - 16 16 - 18 18 - 20 20 - 22
W6 Fall
seconds
90%
60%
30%
W E
S N
0 - 1 1 - 2 2 - 3 3 - 4 4 - 5 5 - 6 6 - 7 7 - 8
W6 Winter
meters
90%
60%
30%
W E
S N
2 - 4 4 - 6 6 - 8 8 - 10 10 - 12 12 - 14 14 - 16 16 - 18 18 - 20 20 - 22
W6 Winter
seconds
90%
60%
30%
W E
S N
0 - 1 1 - 2 2 - 3 3 - 4 4 - 5 5 - 6 6 - 7 7 - 8
W6 Spring
meters
90%
60%
30%
W E
S N
2 - 4 4 - 6 6 - 8 8 - 10 10 - 12 12 - 14 14 - 16 16 - 18 18 - 20 20 - 22
W6 Spring
seconds
Fig. 9. Directional histograms of seasonal wave characteristics for W6. Left: wave height; Right: wave period.
W1 – Southern Sector
Summer:
- Predominant wave directions are from NE
(28.4%) and from S (26.7%);
- Northeasterly waves present heights ranging
between 1 – 2 m (18.4%) with periods of 6 – 8 s (16.3%);
- Southerly waves approach the region with heights
with periods of 8 – 10 s (9.6%) and 10 – 12 s (8.7%);
- Easterly waves (22.2%) approach the region with
dominant heights ranging between 1 – 2 m (13.5%) and periods of 6 – 8 s (12.9%).
- Although occurring less frequently, southwesterly
waves presented the peak in wave heights, reaching 5.9 m.
Fall:
- Dominant wave direction is from S (36.7%), with
heights between 2 – 3 m (14.1%) and periods of 10 – 12 s (15.9%).
- Highest waves are from S, reaching up to 7.3 m,
and the longest periods from SE, with 15 s. Winter:
- Dominant wave incidence direction is S (30.2%),
with heights ranging from 2 – 3 m (12.9%) with periods of 10 – 12 s (12.5%);
- Second in occurrence, are the northeasterly waves
(26.4%) with heights between 2 – 3 m (13%) and periods of 6 – 8 s (17.5%).
- Highest waves approach the region from the SW,
reaching 6.9 m. Spring:
- Northeasterly waves are dominant during Spring
(35.2%), with heights ranging from 1 – 2 m (16.4%) and 2 – 3 m (13.6%) and periods of 6 – 8 s (23.1%).
- The occurrence of waves from S is 25.5%, with
heights between 1 – 2 m (10.4%) and between 2 – 3 m (11.4%) and periods of 8 - 10 s (11%).
- Highest waves are from NE, with 5.9 m.
W2 – Southeastern Sector
Summer:
- Dominant wave direction is from S (29.2%) with
heights ranging between 1 and 2 m (16.1%) and periods of 10 to 12 s (11.3%).
- Waves from E occur during 27% of the summer
months with heights between 1 - 2 m (20.4%) and periods of 6 - 8 s (18.3%).
- Waves from the northeast and southeast make
similar contributions (22.1% and 20.1%, respectively) with heights between 1 - 2 m (16.7% and 12.9%, respectively) and periods of 6 - 8 s (13.9%) and 8 - 10 s (10.4%), respectively.
- Highest waves are from SW, reaching up to 4 m.
Fall:
- Dominant wave direction is from S (47.2%) with
heights between 1 - 2 m (19.6%) and 2 - 3 m (18.7%) and periods of 10 - 12 s (20.7%).
- Highest waves are from the southwest, reaching
up to 6.3 m. Winter:
- Southern waves are dominant (38.1%) with
heights ranging between 2 - 3 m (17.1%) and periods of 10 - 12 s (16%).
- Waves from E contribute with 27% with heights
between 1 - 2 m (13.3%) and 2 - 3 m (11.3%) and periods of 6 - 8 s (14.7%).
- Highest waves are from S, reaching up to 5.7 m.
Spring:
- Dominant direction is E (33.7%) with heights
between 1 - 2 m (20.1%) and periods of 6 - 8 s (23.8%).
- Waves approaching the region from S (27.9%)
present heights between 1 - 2 m (12.9%) and 2 - 3 m (12.3%) and periods of 8 - 10 s (9.2%) and 10 - 12 s (7.8%).
- Highest waves reach the region with up to 4.5 m,
from SE.
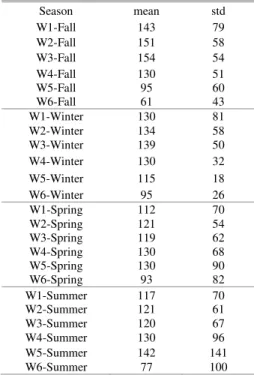
W3 – Central Sector
Summer:
- Dominant wave direction is E (41.3%), with
heights between 1 – 2 m (35.5%) and periods of 6 – 8 s (32.8%).
- Southern waves (27.4%) present heights between
1 – 2 m (20.6%) and periods of 10 – 12 s (12.7%).
- Highest observed waves are from N, with 4.3 m.
Fall:
- Southern waves are dominant (47.3%) with
heights between 1 – 2 m (21.8%) and 2 – 3 m (20.4%) with periods ranging between 10 – 12 s (21.1%).
- Waves from East (27.3%) approach this sector
with heights between 1 – 2 m (19.6%) and periods between 6 – 8 s (20.5%).
- Highest waves are from SW with 4.4 m.
Winter:
- Dominant direction is from E (40.5%) with
heights from 1 – 2 m (21.6%) and 2 – 3 m (16.6%) and periods between 6 – 8 s (21.5%) and 8 – 10 s (17.4%).
- Southern waves (33.9%) reach the region with
heights of 2 – 3 m (18.7%) and periods of 10 – 12 s (14.7%).
- Highest waves are from SW, with4.9 m.
Spring:
- Dominant direction is E (34.1%) with heights
ranging from 1 – 2 m (29.2%) and periods of 6 – 8 s (26.4%)
- Waves from S (27.2%) approach with heights of
1 – 2 m (16.4%) and periods between 8 – 10 s (9.4%) and 10 – 12 s (9.8%).
- Highest waves are from S, with 4 m.
W4 – Eastern Sector
Summer:
- Dominant wave direction is from E (50.2%), with
heights ranging between 1 – 2 m (44.6%) and periods of 6 – 8 s (43%);
- The highest waves observed are from N, with 2.6 m, and the longest periods from N, with 19 s. Fall:
- Dominant wave directions are from E (42.1%), S
(27.1%) and SE (24.6%);
- Easterly waves present heights between 1 – 2 m
(25.4%) and 2 – 3 m (16.5%) and periods of 6 – 8 s (33.2%);
- Southerly waves approach the region with heights
between 1 – 2 m (12.2%) and 2 – 3 m (14.1%) and periods between 10 – 12 s (11.6%) and 12 – 14 s (9.5%);
- South-easterly waves have typical heights
ranging between 1 – 2 m (9.7%) and 2 – 3 m (13.8%) and periods between 6 – 8 s (12.1%) and 8 – 10 s (9.5%);
- The highest waves observed are from SE, of 4 m,
and the longest periods from S, reaching 16 s. Winter:
- Dominant wave directions are from SE (52.2%)
and E (29.8%);
- Southeasterly waves have typical heights ranging
between 2 – 3 m (35.5%) and periods between 6 – 8 s (24.1%) and 8 – 10 s (25%);
- Easterly waves present heights between 1 – 2 m
(13.1%) and 2 – 3 m (16.2%) and periods of 6 – 8 s (20.6%);
- The highest waves observed are from SE, with
4.3 m, and the longest periods from S, with 17 s. Spring:
- Dominant wave direction is from E (60.1%), with
heights between 1 – 2 m (47.6%) and periods of 6 – 8 s (53.8%);
- The highest waves observed are from SE, with
3.8 m, and the longest periods from N, with 21 s.
W5 –Northeastern Sector
Summer:
- Dominant wave directions are from N (36.5%),
NE (26%) and E (25%);
- Northerly waves approach the region with heights
between 1 – 2 m (21.3%) and 2 – 3 m (15.3%) and periods ranging between 8 – 10 s (11.7%), 10 – 12 s (10.4%) and 12 – 14 s (9.9%);
- Northeasterly waves have typical heights between
1 – 2 m (20%) and periods between 6 – 8 s (15.3%) and 8 – 10 s (10.7%);
- Easterly waves present heights between 1 – 2 m
(14.7%) and 2 – 3 m (10.3%) and periods of 6 – 8 s (20%);
- The highest waves observed are from N, with 3.1
m, and the longest periods from N, with 18 s. Fall:
- Dominant wave direction is from E (52.7%), with
heightsof 1 – 2 m (43.4%) and periods of 6 – 8 s
(36.9%);
- The highest waves observed are from SE, with
2.8 m, and the longest periods from N, with 16 s. Winter:
- Dominant wave direction is from SE (72.6%),
with heights of 2 – 3 m (51.6%) and periods of 6 – 8 s (59.3%);
- The highest waves observed are from SE, being
of 3.4 m, and the longest periods from N, of14 s.
Spring:
- Dominant wave direction is from E (57.5%), with
heights between 1 – 2 m (37.9%) and 2 – 3 m (19.3%) and periods of 6 – 8 s (46.1%);
- The highest waves observed are from SE, with
3.2 m, and the longest periods from N, with 21 s.
W6 – Northern Sector
Summer:
- Dominant wave direction is from NE (79.1%),
with heights of 2 – 3 m (56.7%) and periods between 6 – 8 s (43.4%) and 8 – 10 s (33.6%);
- The highest waves observed are from NE, of 3.8
m, and the longest periods from N, with 16 s. Fall:
- Dominant wave direction is from NE (73%), with
heights of 1 – 2 m (54.8%) and periods of 6 – 8 s (60%);
- The highest waves observed are from NE,
reaching 3 m, and the longest periods from N, with 15 s.
Winter:
- Dominant wave direction is from E (88.1%), with
heights of1 – 2 m (79.1%) and periods of 6 – 8 s
(79.1%);
- The highest waves observed are from SE, of 2.6
m, and the longest periods from N, with 16 s. Spring:
- Dominant wave direction is from E (53.6%), with
heights of 1 – 2 m (46.4%) and periods of 6 – 8 s (50.5%);
- The highest waves observed are from NE,
reaching 3.4 m, and the longest periods from N, with 18 s.
Modal Height-Period Combination and Monthly Variations
The distribution of wave height and period, plotted jointly in Fig. 10 for each sector, emphasizes the difference in wave characteristics along the
Brazilian coast. In sectors W1 and W2, the modal
W6 is shown by the well-defined peaks in the contours of the histogram (Fig. 10).
In order to establish the daily variations in wave characteristics along the Brazilian coast, the synergy of wave height and period, wave power, was calculated for each sector through the application of Eq. 1. Figure 11 shows the daily averaged variations for the eleven-year time series of wave power that reach each of the six studied sectors. The northward
decrease in wave power is clearly seen from W1 to W6, with W1 to W4 presenting similar variation patterns, with higher wave energy during the southern hemisphere´s fall, winter and spring months, while in W5 and W6 the summer months are the most energetic. Again, the lower variability in wave
characteristics inW5 and W6, in contrast with that of
the other coastal sectors, can be seen, with its much smaller range in wave power (Fig. 11).
Fig. 10. Combined distribution of significant wave height and peak period with percentage of occurrence contours. Contours are given in intervals of 1% (e.g. for W1 the external contour is 1% of occurrence and the inner contour represents 8% of occurrence).
Fig. 11. Daily variations in wave power P as obtained from Eq. 1 based on the eleven-year database for each sector of the Brazilian coast.
D
ISCUSSION ANDC
ONCLUSIONSBased on the available archive of hindcast wave simulations with NWW3 (NCEP/NOAA), we defined the wave climate off the Brazilian coast. With only limited records of wave data available for the region, these data become important background information for a range of applications on the
Brazilian coast. The data havebeen validated for the
southern region by comparing them with those
recorded by Araújo et al. (2003). Since there is a
difference in the position between measurements and the extracted modeled waves, the comparison is qualitative only, but provides an insight into the general wave climate given by each method. In general, the wave climate is similar in the comparison, with directions being better represented during fall, spring and winter periods than during the summer. The frequency of higher wave classes is greater in the modeled waves, which agrees with the findings of Tolman et al. (2002).
From the six points defined here for the
wave analysis undertaken along the Brazilian
shelf-break, a clear trend in wind-generated wave energy, decreasing from south (W1) to north (W6), may be
seen.This is clearly the result of the influence of the
strong winds associated with the passage of cold fronts
which most affect the southern part of Brazil, losing energy while propagating northwards. The large scale atmospheric system of southern Brazil is controlled by seasonal oscillations of the intensity and position of the South Atlantic High (SAH) (ORSELLI, 1986; CASTRO; MIRANDA, 1998) and the passage of polar front systems at intervals ranging between 6 and 10 days (STECH, 1990; STECH; LORENZZETTI, 1992). Winds associated with the passage of cold fronts are usually more intense during the fall and winter months due to the higher frequency of cyclogenesis (NIMER, 1989; GAN; RAO, 1991), also being reflected in the higher frequency of high wave energy events (Table 4). Moving northwards, the frequency and intensity of high wave energy events is gradually reduced, with only W1 and W2 presenting waves of more than 6 m (Table 4). The influence of waves generated by the strong winds that occur during the passage of cold fronts can be seen up to the northeast of Brazil (W4) during winter months, although much less energetic. In the central sector (represented by W3), the main atmospheric circulation is determined by the South Atlantic anti-cyclone cell with only slight seasonal variations (DOMINGUEZ et al., 2009), although the waves generated due to the advance of polar fronts result in more energetic conditions during the winter months.
Table 4. Number of yearly occurrence of events with wave heights above 2.0, 3.0, 4.0, 5.0, 6.0 and 7.0 m by season for each sector.
Season > 2m > 3m > 4m > 5m > 6m > 7m
W1 summer 12.18 4.45 1.00 0.18
fall 16.09 11.18 5.64 1.91 0.64 0.18
winter 16.36 13.27 5.82 1.73 0.55
spring 16.82 8.82 2.55 0.73
total 61.45 37.73 15.00 4.55 1.18 0.18
W2 summer 10.45 1.91 0.09
fall 14.27 7.00 2.36 0.55 0.09
winter 15.73 7.73 2.18 0.45
spring 14.36 3.64 0.45
total 54.82 20.27 5.09 1.00 0.09
W3 summer 5.91 0.55
fall 13.55 4.73 0.45
winter 16.64 4.91 0.55
spring 9.64 1.45
total 45.73 11.64 1.00
W4 summer 6.36
fall 13.45 1.09
winter 16.09 2.91 0.18
spring 9.18 0.09
total 45.09 4.09 0.18
W5 summer 10.82 0.09
fall 8.73
winter 8.91 0.55
spring 10.91 0.18
total 39.36 0.82
W6 summer 14.82 1.73
fall 8.36
winter 4.64
spring 7.73 0.27
The equatorial region of Brazil (W4, W5 and W6) has its atmospheric system determined by the Intertropical Convergence Zone (ITCZ), giving rise to northeasterly and southeasterly trade winds which converge over this region. The ITCZ migrates meridionally during the year, reaching farthest north in August-September and coming closest to the Equator in March-April, exerting a significant control of the rainfall and wind regimes (NIMER, 1979; McGREGOR; NIEUWOLT, 1998). W5 showed wave directions predominantly from E and SE, and W6 from E and NE, showing a very clear signal throughout the seasons, both being highly influenced by the trade winds, with its variation being attributed to the seasonal migration of the ITCZ. W4 presented waves, mainly from E/SE, at this latitude generated mainly by trade winds, though during the fall and winter, waves from the S are also noticeably present, showing that cold fronts can affect the wave climate of this sector too.
In this paper we present a general overview of the wave climate off the Brazilian coast based on data extracted from the NWW3 model in the attempt to overcome the lack of wave data along the Brazilian coast. The data presented provide a first assessment of the wave climate for Brazilian waters and regional aspects of wave climate distribution can be further assessed with the analysis at higher spatial resolution and wave transformation processes as they propagate over the shallower waters of the continental shelf.
A
CKNOWLEDGEMENTSThe authors would like to thank the Oceanographic Institute of the University of São Paulo (IOUSP), and the State of São Paulo´s Research Foundation (FAPESP). We are also thankful for the reviewers´ helpful comments, which contributed to the improvement of the manuscript. E.S. is sponsored by a CNPq fellowship (ref. nº. 305805/2009-6).
R
EFERENCESARAÚJO, C. E. S.; FRANCO, D.; MELO, E.; PIMENTA, F. Wave regime characteristics of southern Brazilian Coast. In: INTERNATIONAL CONFERENCE ON COASTAL AND PORT ENGINEERING IN DEVELOPING COUNTRIES, 6., 2003, Colombo, Sri Lanka. Proceedings... COPEDEC VI, 2003. v. 97, p. 15.
BENSI, M.; MARINHO, R. A.; MAIA, L. P. Clima de ondas e sua implicação com a erosão costeira ao longo do Estado do Ceará. In: CONGRESSO DE ENGENHARIA DE PESCA, Fortaleza, Ceará, 2005. CONBEP, 2005. p. 802-815.
BITTENCOURT, A. C. S. P; DOMINGUEZ, J. M. L; FONTES, L. C. S.; SOUSA, D. L.; SILVA, I. R.;
SILVA, F. R. Wave refraction, river damming, and episodes of severe shoreline erosion: The São Francisco river mouth, Northeastern Brazil. J. coast. Res., v. 23,
n. 4, p. 930-938, 2007.
CAIRES, S.; STERL, A.; BIDLOT, J. R.; GRAHAM, N.; SWAIL, V. Intercomparison of different wind-wave reanalyses. J. Climate, v. 17, p. 1893–1913, 2004. CANDELLA, R. N. Estudo de casos de ondas no Oceano
Atlântico Sul através de modelagem numérica.
Master´s Thesis, Universidade Federal do Rio de Janeiro - UFRJ, Brazil, 1997. 80 p.
CAPLAN, P. ; DERBER, J. ; GEMMILL,W. ; HONG, S. Y.; PAN, H. L. ; PARISH, D. F. Changes to the 1995 NCEP operational medium-range forecast model analysis/forecast system. Weather Forecasting, v. 12, p. 581–594, 1997.
CASTRO, B. M ; MIRANDA L. B. Physical Oceanography of the Western Atlantic Continental Shelf located between 4°N and 34°S - Coastal segment (4,W). In: ROBINSON A. R.; BRINK K. H. (Ed.). The Sea. New
York: J. Wiley & Sons, 1998. v. 11, p. 209-251. CHERFAS, C. The fringe of the ocean – under siege from
land. Science, v. 248, n. 4952, p. 163-164, 1990. DERBER, J. C.; PARISH, D. F.; LORD, S. J. The new global
operational analysis system at the National Meteorological Center. Weather Forecasting, v. 6, p. 538–547, 1991.
DOMINGUEZ, J. M. L. The coastal zone of Brazil. In: DILLENBURG, S.R.; HESP, P.A. (Ed.). Geology and Geomorphology of Holocene coastal barriers of Brazil. Berlin: Springer, 2009. p. 17-51. (Lecture Notes in Earth Sciences, v. 107, 2009).
DOMINGUEZ, J. M. L.; ANDRADE, A. C. S.; ALMEIDA, A. B.; BITTENCOURT, A. C. S. P. The Holocene Barrier Strandplains of the State of Bahia. In: DILLENBURG, S.R.; HESP, P.A. (Ed.). Geology and Geomorphology of Holocene coastal barriers of Brazil. Berlin: Springer, 2009. p. 253-288. (Lecture Notes in Earth Sciences, v. 107, 2009).
GAN, M. A.; RAO, V. B. Surface cyclogenesis over South America. American Meteorological Society, 1991. v. 119, p. 1293-1302.
GRAHAM, N. E.; DIAZ, H. F. Evidence for intensification of North Pacific winter cyclones since 1948. Bull. Am. Met. Soc., v. 82, p. 1869–1893, 2001.
INMAN, D. L.; MASTERS, P. M. Status of research on the nearshore. Shore Beach, v. 62: 11-20, 1994.
KANAMITSU, M. Description of the NMC global data assimilation and forecast system. Weather Forecasting,
v. 4, p. 335–243, 1989.
KANAMITSU, M.; ALPERT, J.; CAMPANA, K.; CAPLAN, P.; DEAVEN, D.; IREDELL, M.; KATZ, B.; PAN, H. L.; SELA, J.; WHITE, G. Recent Changes implemented into the Global Forecast System at NMC.
Weather Forecasting, v. 6, p. 425–435, 1991. KOMAR, P. D. Beach processes and sedimentation. 2nd
ed. Upper Saddle River, N.J.: Prentice Hall, 1998. 544 p. McGREGOR, G. R.; NIEUWOLT, S. Tropical Climatology.2nd ed. New York: John Wiley and Sons,
1998. 339 p.
NIMER, E. Climatologia do Brasil. Rio de Janeiro: IBGE, 1979. 422p. (Série Recursos Naturais e Meio Ambiente, v. 4).
NIMER, E. Climatologia do Brasil. 2nd ed. Rio de Janeiro:
IBGE, 1989. 421p.
ORSELLI, J. Climatologia. In: GAPLAN-SC. Atlas de Santa Catarina, 1986. p. 38-39.
PEREIRA, J.; CANDELLA, R. N.; CARVALHO, J. L. B. O clima de ondas na costa sul de Arraial do Cabo, RJ: distribuição de parâmetros de onda. Notas Tec. Facimar, v. 4, p. 1-9, 2000.
RUSU, L.; PILAR, P.; GUEDES SOARES; C. Hindcast of the wave conditions along the west Iberian coast. Coast. Engng, v. 55, n. 11, p. 906-919, 2008.
SEBASTIÃO, P.; GUEDES SOARES, C.; BOOIJ, N. Wave hindcasting off the coast of Portugal. Coast. Engng, v. 40, n. 4, p. 411-425, 2000.
SIEGLE, E.; ASP, N. E. Wave refraction and longshore transport patterns along the southern Santa Catarina coast. Braz. J. Oceanogr., v. 55, p. 109-120, 2007. SIEGLE, E.; HUNTLEY, D. A.; DAVIDSON, M. A.
Coupling video imaging and numerical modeling for the study of inlet morphodynamics. Mar. Geology, v. 236, p. 143-163, 2007.
SIEGLE, E.; HUNTLEY, D. A.; DAVIDSON, M. A. Physical controls on the dynamics of inlet sandbar systems. Ocean Dynamics, v. 54, p. 360-373, 2004. .
STECH, J. L. Um estudo comparativo da dinâmica da
circulação de inverno entre as plataformas
continentais das costas sudeste do Brasil e dos
Estados Unidos utilizando um modelo numérico. Tese
(Doutorado). Universidade de São Paulo, São Paulo, 1990.
STECH, J. L.; LORENZZETTI, J. A. Response of the South Brazil Bight to the passage of Wintertime cold fronts. J. geophys. Res., v. 97(C6), p. 9507-9520,1992.
TOLMAN, H. L. User manual and system documentation of
WAVEWATCH III version 1.18.
NOAA/NWS/NCEP/OMB. Tech. Note 166, 1999. 110
p. [Available online at
<http://polar.ncep.noaa.gov/waves/wavewatch.>. TOLMAN, H. L. User manual and system documentation of
WAVEWATCH-III version 1.15. NOAA / NWS / NCEP / OMB. Tech. Note, 1997. v.151, p. 97, 1997.
TOLMAN, H. L.Validation of a new global wave forecast system at NCEP. In: EDGE B. L.; HELMSLEY J.M. (Ed.). Ocean wave measurements and analysis, ASCE, 1998. p. 777-786
TOLMAN, H. L.; BALASUBRAMANIYAN, B.; BURROUGHS, L.D.; CHALIKOV, D. V.; CHAO, Y. Y.; CHEN, H. S.; GERALD, V. M. Development and implementation of wind-generated ocean surfacewave models at NCEP. Washington, D.C.: American Meteorological Society, 2002. v.17, p. 311-333.
WANG, X. L. L.; SWAIL, V. R. Changes of extreme wave heights in Northern Hemisphere oceans and related atmospheric circulation regimes. J. Climate, v. 14, p. 2204–2221, 2001.