CIRCULATION AND SUSPENDED PARTICULATE MATTER TRANSPORT IN A
TIDALLY DOMINATED ESTUARY: CARAVELAS ESTUARY, BAHIA, BRAZIL
Carlos Augusto França Schettini1 and Luiz Bruner de Miranda2
1Universidade Federal do Ceará - Instituto de Ciências do Mar - (LABOMAR/UFC)
(Av. da Abolição, 3207, 60165-081 Meireles, Fortaleza, Brasil) E-mail: [email protected]
2Instituto Oceanográfico da Universidade de São Paulo
(Praça do Oceanográfio, 191, 05508-120 São Paulo, SP, Brasil) E-mail: [email protected]
A
B S T R A C TThe circulation and transport of suspended particulate matter in the Caravelas Estuary are assessed. Nearly-synoptic hourly hydrographic, current (ADCP velocity and volume transport) and suspended particulate matter data were collected during a full semidiurnal spring tide, on the two transects Boca do Tomba and
Barra Velha and on longitudinal sections at low and high tide. On the first transect the peak ebb currents
(-1.5 ms-1) were almost twice as strong as those of the wider and shallow
Barra Velha inlet (-0.80 ms-1) and
the peak flood currents were 0.75 and 0.60 ms-1, respectively. Due to the strong tidal currents both inlets had
weak vertical salinity stratification and were classified with the Stratification-circulation Diagram as Type 2a (partially mixed-weakly stratified) and Type 1a (well mixed). Volume transports were very close, ranging from -3,500 to 3,100 m3s-1 at the ebb and flood, respectively, with a residual -630 m3s-1. The concentration
of the suspended particulate matter was closely related to the tidal variation and decreased landwards from 50 mg.L-1 at the estuary mouth, to 10 mg.L-1 at distances of 9 and 16 km for the low and high tide
experiments, respectively. The total residual SPM transport was out of the estuary at rates of -18 tons per tidal cycle.
R
E S U M OA circulação e o transporte de material particulado em suspensão no Estuário de Caravelas são pesquisados. Dados quase-sinóticos hidrográficos, de correntes (velocidade e transporte de volume com ADCP) e de material particulado em suspensão, foram medidos em intervalos horários durante um ciclo semidiurno de maré de sizígia, em duas seções transversais na Boca do Tomba e na Barra Velha e também em seções longitudinais na baixa-mar e na preamar. Na primeira transversal as correntes máximas de vazante (-1,50 m s-1) foram quase duas vezes mais intensas do que na seção transversal mais larga e rasa Barra Velha, (-0,80
m s-1) e as maiores velocidades das correntes de enchente foram de 0,75 m s-1 e 0,60 m s-1, respectivamente.
Devido à grande intensidade das correntes de maré, nas duas seções transversais a salinidade apresentou-se fracamente estratificada, sendo classificadas com o Diagrama Estratificação-circulação do Tipo 2a (parcialmente misturada e fraca estratificação vertical) e do Tipo 1a (bem misturada). Os transportes de volume foram muito próximos, variando de -3.500 m3 s-1 a 3.100 m3 s-1, na vazante e na enchente,
respectivamente, com um transporte de volume residual igual a -630 m3 s-1. A concentração do material
particulado em suspensão (MPS) esteve fortemente relacionado à variação da maré, decrescendo estuário acima de 50 mg.L-1, na boca do estuário, para 10 mg.L-1 para distâncias de 9 km e 16 km nos experimentos
na baixa-mar e preamar, respectivamente. O transporte residual de MPS foi estuário abaixo com uma taxa estimada em -18 ton por ciclo de maré.
Descriptors: Caravelas Estuary; Hydrodynamiccharacteristics; Volume transport and suspended particulate matter balance.
Descritores: Estuário de Caravelas, Características hidrodinâmicas, Transporte de volume e balanço de material particulado em suspensão.
I
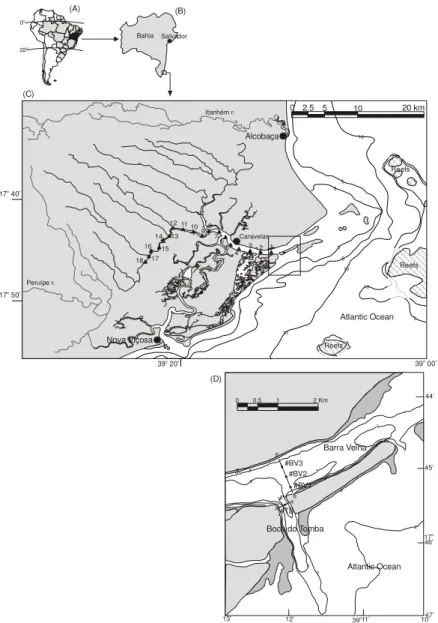
NTRODUCTIONThe Caravelas Estuary is a shallow tropical coastal plain environment in the south of the Bahia State (lat. 17o45’S; long. 039o15’W) and has given rise to the formation of a complex channel around the Cassumba Island (Fig. 1). It presents significant environmental importance as its mouth is close to the __________
Contr. No. 884 do Inst. oceanogr., da Usp.
Abrolhos National Marine Park, which encompasses the largest reef habitat in the South Atlantic Ocean. The inner shelf reefs are just 15 km offshore, which makes them sensitive to near shore and estuarine plume effects.
Study Area
located on the southeastern Brazilian coast. However, its main hydrodynamic and thermohaline characteristics are little known. Taking into account the main forcing of other tropical estuaries located further north in the states of Pernambuco and Rio Grande do Norte, such as the Itamaracá estuary (MEDEIROS; KJERFVE, 1993), the Jaboatão river estuary (ARAÚJO et. al., 1999) and the Curimataú river estuary (MIRANDA et al., 2005, 2006; ANDUTTA, 2006) it is possible to establish the
following hypothesis: the Caravelas estuary is mainly forced by tides, fresh water discharge and the wind, which are responsible for the stratification and circulation through the balance of potential and kinetic energy. Hence its physical, chemical, biological and morphological characteristics may be affected by different time scales: tidal modulation (daily and fortnightly), seasonal variations due to fresh water discharge and winds and the coastal circulation.
17 40’o
Reefs
Reefs
Reefs
39 00’o 39 20’o
10 5 3
3 5
10
10
3 Peruípe r.
Itanhém r.
3
5
10
17 50’o
Caravelas Salvador
Bahia
Alcobaça
Nova Viçosa
Atlantic Ocean
0o
22o
0 2.5 5 10 20 km
1 2 3 4 5 6 7 8 9 10 11 12
13 14
15 16
17 18
5 2
2 0
0 5
2 5
10
44’
45’
46’
47’ 10’ 11’
12’ 13’
A A’
B B’
5 2 Boca do Tomba
Barra Velha
0 0.5 1 2 Km
39o
17o #BV1
#BV2 #BV3
#TB
Atlantic Ocean
(A) (B)
(C)
(D)
In view of the geographical location and the economic and social importance of the region around the Caravelas estuary, it may act as a natural filter (e.g., SHUBEL; CARTER, 1984) and may account for the exportation/importation of concentrations of energy, substances and particulate matter by means of the transport processes (advection and diffusion). It should be noted that the capacity of renewal of estuarine water masses and assimilation of atrophic material will depend on the processes of a physical-chemical, morphological and biological nature, and the influence of these concentrations advected by the estuarine plume and by the coastal current may reach as far as the biogenic environments such as the reefs
Baixio de Fora and the volcanic formations Parcel das Paredes, Corôa Vermelha and Sebastião Gomes,
located less than 24 km offshore. On the continental
shelf, close to the coastline, are the Sueste and Abrolhos channels, 20 m deep with lengths of 20 km
and 50 km, respectively, the latter one being located between the Parcel das Paredes and the Abrolhos
archipelago.
Although there is some basic knowledge on the hydrodynamics of the continental shelf, nothing is known scientifically on the circulation, suspended particulate matter concentration and water mass characteristics of the estuary. The main objective of this study is to give a preliminary characterization of the Caravelas Estuary, as regards its ecological importance to the Abrolhos National Marine Park. The hydrodynamics and suspended particulate matter transport were assessed in the dual inlet system of the estuary (Fig. 1D) based on a 13-hour tidal survey during the spring tide period. As will be shown, the dataset of this single survey is valuable in that it allows the tidal characterization of the main physical processes concerned.
P
HYSICALS
ETTINGThe Bahia coastal plain has a humid tropical climate with well defined wet and dry seasons. The period of greatest precipitation lasts from May to July and the dry season occurs from August to October; the mean annual rainfall is 1,600 mm year-1 (CHAVES, 1999). The Caravelas estuary is forced by the fresh water discharge from two main rivers, the Cupido/Caravelas and the Peruipe, at the two mouths of the estuary at Caravelas (lat. 17o45’S; long. 039o23’W) in the north, and at Nova Viçosa (lat. 17o54’S; long. 039o25’W) in the south, respectively. The fresh water input into the Caravelas River has as its source the surface runoff of several tributaries, the Cupido river being the main one, scattered over a relatively small drainage basin of just under 600 km2 (Fig. 1) but there are no data as to its fresh water discharge. In the south, the Peruipe River at Nova
Viçosa provides another fresh water discharge with a mean input varying from 15 m3s-1 at its lowest discharge to 30 m3s-1 during the season of heavy rains, according to the 25-year dataset provided by the Agência Nacional de Águas (ANA). However, its influence, due to the exchange processes of advection and diffusion between them through the branching channel of approximately 27 km which links the main northern and southern channels, remains to be investigated.
The wind pattern in the region is influenced by the southern border of the trade winds and by the South Atlantic Anticyclone (SAA). Due to the migration of the SAA both towards the N and the S, according to the season of the year (summer and winter), the main winds are northeasterly between November and February and southeasterly between the months of March and August (CHAVES, 1999; TEIXEIRA, 2006). The weather in the region may also be driven by cold front intrusions from the south and by the liberation of cyclonic vortices with great inter-annual variability; the cold fronts arriving more frequently during the autumn and winter and less often in the summer (ANDRADE, 2004).
The tidal co-oscillation at the estuary mouth is classified as meso-tidal and semi-diurnal [Nf=(K1+O1)/(M2+S2)=0.12] according to its height and periodicity, respectively, ranging between 1.5 and 3 m in neap and spring tide periods, respectively (TEIXEIRA, 2006). In the Sueste channel the along-shelf currents presented a strong correlation with the tidal signal, reaching southward velocities of up to 0.80 m.s-1 and 0.60 m.s-1, at the surface and close to the bottom, respectively. In the Abrolhos channel a low vertical current shear was observed and the surface and near bottom southward currents had almost the same speeds (≈ 0.60 m.s-1). The cross-shelf currents in the Abrolhos channel were highly influenced by the tidal oscillation, but this tidal signal was not so evident in the Sueste channel (KNOPPERS et al., 1999a; LEIPE et al., 1999). The current variability is mainly driven by sub-inertial processes (period >72 h), with tides and high frequency events being of secondary importance (LESSA; CIRANO, 2004; TEIXEIRA, 2006).
The coastal circulation is dominated by the Tropical Water Mass (TW) (temperature >20oC; salinity >36 psu; (SUMMERHAYES et al., 1976; GAETAet al., 1999). The forcing of the ecosystem of the Banco dos Abrolhos consists of the Brazil Current
nutrient concentrations. Although not well understood, there are evidences that the upwelled SACW in the Cabo Frio region may be advected by coastal currents to the Banco dos Abrolhos (CASTRO et al., 2006;
PEREIRA et al., 2005), an indication that oceanic, coastal and estuarine systems are closely interconnected.
F
IELDM
EASUREMENTSMeasurements of currents, hydrographic properties and suspended particulate matter (SPM) concentration were taken during a 13-hour survey on April 9, 2001, on two cross sections and at four oceanographic stations; three stations being located perpendicularly to the wider Barra Velha transect, one
near the center of the inlet, two others on the flanks of the northern and southern channel and one near the center of the narrow Boca do Tomba inlet (Fig. 1D). The experiment was conducted during the spring tide starting almost 2 hours before the low-slack water and continuing during one full semidiurnal tidal cycle. Additionally two along-estuary nearly synoptic transects were made on April 10, 2001 (Fig. 1E), with a set of oceanographic stations covering up-estuary distances of 16 km and 26 km during low and high water, respectively.
The current velocity and direction data were taken on the cross sections using an Acoustic Döppler Current Profiler (ADCP) by Sontek, model ADP 1500, with bottom track capability. One transect extended perpendicularly across each of the inlets Boca do Tomba and Barra Velha (Fig. 1D) measuring velocity
profiles over both depth and width. The area of the cross section of Barra Velha (~4,500 m2) is almost
twice than of the Boca do Tomba (~2,400 m2) and their respective shapes are approximately rectangular and triangular with maximum depths of approximately 7 m and 24 m, respectively. The measurements along the cross-sections were made in slightly under 20 minutes and hourly during the full spring tidal cycle. The ADCP was programmed to give velocity profiles averaged at 5-s intervals and vertical cell size of 0.25 m. According to the manufacturer a precision of ±1% of measured speed or ±0.005 m/s in the velocity measurements may be expected.
The computation of the integrated total cross-sectional discharge (volume transport) was carried out using the proprietary software RiverSurveyor (Sontek, Inc.), using triangular closure of the margins and default approximations of near-surface and near-bed non-measured layers. Positive (up-estuary) and negative (down-estuary) values were adopted. The water discharge (volume transport) was given in m3s-1, which integrates u-component velocity normal to the cross-section area, A, covered by ADCP measurements, the instantaneous values Q(t) of which were obtained by (eq. 1):
∫∫
=
AudA
) t (
Q (L3T-1) (1)
The 13-hour survey, with the first data collection being made at time zero and sampling at consecutive hourly intervals, yielded a total (n) of 14 samples. Thus, the time averaged cross-sectional discharge,<Q>, which represents the residual
discharge, is calculated in accordance with Kjerfve (1979, 1990) :
+ + − >=
< 11 2
∑
−1 2 21 n n
n
Q Q Q n
Q (2)
Vertical profiles of current velocity were extracted from the cross-sectional measurements. The positions of the profiles were chosen so as to be as close as possible to the positions of the hydrographic stations, based on distance and depth. For a single profile five vertical profiles were selected, two being on either side of the central position. Thus, the averaged velocity profile represents a 25-second averaged datum, in this way minimizing the noise signal produced by the ADCP.
Salinity, temperature and SPM concentration data were also acquired from the ADCP survey vessel just after the current measurements taken on each cross section. The procedure was to perform a CTD and lower a turbidity meter near the oceanographic stations programmed on transects Barra Velha and
Boca do Tomba (Fig. 1D). The CTD used was one by
Saiv A/S, model SD-200, with a sampling rate of 0.5 Hz. Conductivity Ratio and temperature measurements taken by the CTD were converted into salinity in accordance with the Practical Salinity Scale-1978 (UNESCO, 1981) and the numerical values reported as Practical Salinity Units (psu).
The turbidity meter used was an optical backscatter probe (OBS) by SeaPoint, Inc., with direct reading through a multimeter in volts. The OBS probe was calibrated to convert the voltage into SPM concentration (mg L-1) after the survey through routine laboratory procedure. A high concentration bulk solution was obtained from local sediments by the settling of SPM in a 200 L tank. After a period of ~3 hours the overlying water was siphoned off and the bed material was stored. Using a 10 L bucket with submerged pumps to maintain the turbulence, the bulk solution was gradually added to initially clear water. At every increase in SPM, a sample of water was taken simultaneously with the measurement of turbidity. The SPM concentration was obtained by the ratio of total mass retained in a filter by the filtered volume through a filter of known weight.
each vertical profile, the data were re-sampled to produce 10 levels of measurements for the Boca do Tomba cross section, and 5 levels for the Barra Velha
cross section.
R
ESULTSWater Level and Total Water Discharge
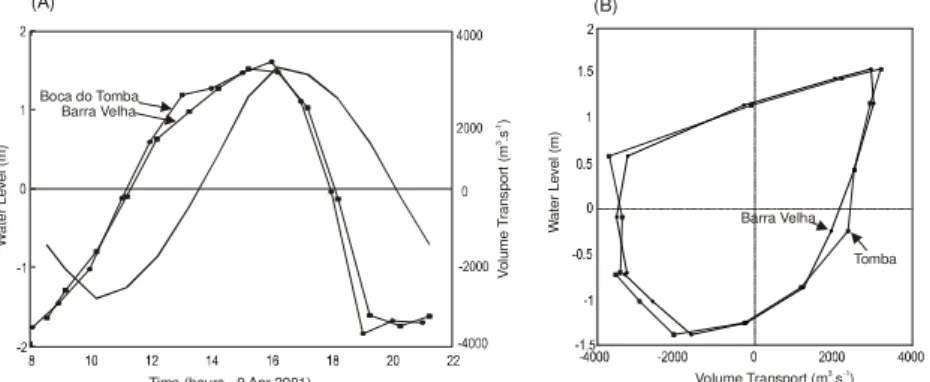
The sea level variation during the period covered by the experiment to acquire current and hydrographic data was of about 2.9 m, which characterizes the height of the local spring tide. The low tide was at approximately 10:00 h, and the high tide occurred at about 16:00 h. The tide was monitored hourly, and it was symmetric in terms of flood and ebb periods (Fig. 2A).
As stated above, this paper has adopted the convention that landward direction of volume transport, currents and fluxes are positive, denoting the meaning of ‘importation’, whereas seaward direction is negative, meaning ‘exportation’. The time variation of the total discharge, flowing through the Boca do Tomba and Barra Velha cross sections, was practically
the same (Fig. 2A). The shifts observed at about 13:30 h and 19:00 h in the Boca do Tomba discharges are
probably due to mismeasurements due to the high velocities observed, which may prejudice the discharge calculations with the ADCP bottom track. The total water discharge was asymmetric both in magnitude and rate of change. The flood period lasted 6:45 h, the flood peak discharge of about 3,100 m3.s-1 occurring at 15:00 h, the addition of the discharges of the two cross-sections giving a total of nearly 6,200 m3.s-1. The ebb peak discharge occurred at 20:00 h and was of about -3,500 m3.s-1, or nearly -7,000 m3.s-1 for both cross sections together. The configuration of the discharge versus time plot showed a gentle slope from the peak of the ebb transition, at the beginning of the field work at 08:00 h, to the peak
of the flood at 16:00 h. The time rate variation of the discharge during this period was 870 m3.s-1.hr-1. The flood to ebb transition showed a more abrupt change and for the period from the peak of the flood to the time when the ebb discharge stabilized at 19:00 h, the time rate variation was close to 2,000 m3.s-1.hr-1. The time interval of the flood to the ebb transition was of 3:20 h. Apparently, the discharge after 19:00 h presents a positive gradient, suggesting that the period of ebb to flood transition has already begun, and with the period observed at the beginning of the measurements, it totaled 9:30 h of ebb to flood transition. The residual discharges calculated by its time averaged values, in the Boca do Tomba and Barra Velha, were outward with values of -340 m3.s-1
and -290 m3.s-1, respectively, or -630 m3.s-1 through the dual inlets of the estuary’s northern mouth.
Figure 2B presents the relationship between water level and cross-sectional discharges. For both cross-sections the first computed discharge is almost coincident with the last, thus closing the polygon formed by the points. This fact, associated with the results presented in Figure 2A, reinforces the strong semidiurnal tidal regime as also the confidence in the data acquired during the experiment to be used for further mass balance. The shape of the water level/discharge relationship is useful to clarify the basic tidal wave behavior across the sections. A diagonal line tilted to the right is to be expected for a pure progressive wave, when maximum speed will be attained at the highest level, and a circle for a pure standing wave, when maximum speed will be attained at ‘zero’ level. Therefore, tides in estuaries normally behave according to a mixed pattern resulting in an ellipse (DYER, 1997). The level/discharge relationship for the lower Caravelas estuary resembles a tilted ‘rain drop’, with a fat round base and a sharp upper tip.
W
a
te
r
L
e
v
e
l
(m
)
V
o
lu
m
e
T
ra
n
s
p
o
rt
(
m
.s
)
3
-1
Time (hours - 9 Apr 2001) Boca do Tomba
Barra Velha
Tomba Barra Velha
W
a
te
r
L
e
v
e
l
(m
)
Volume Transport (m .s )3-1
(A) (B)
Fig. 2. (A) Hourly time variation of water level (solid bold line) and volume transports (m3 s-1) across
the Boca do Tomba (line with circles) and Barra Velha (line with squares) transects during the semidiurnal tidal cycle; (B) Water level (m) and the volume transports (m3s-1) diagram of the Boca do
Longitudinal Estuarine Structure
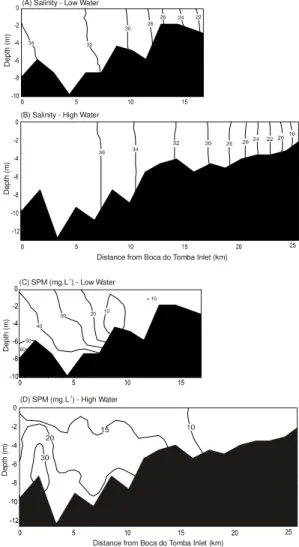
The results of the longitudinal surveys carried out at low and high water on April 10, 2001, are presented in Figure 3. The low water survey started at 11:00 h and finished at 12:30 h; during the ebb the longitudinal salinity varied from ≈34 psu to ≈22 psu, presenting vertically homogeneous distribution, with an averaged upstream gradient of -0.7 psu.km-1(Fig. 3A). The high water longitudinal survey extended further upstream from the estuary mouth (Boca do Tomba), up to 25 km (Fig. 3B). The salinity distribution, like that observed at low water (Fig. 3B), was vertically homogeneous and indicated the intrusion of the Tropical Water Mass (TW), as shown by its high salinities and temperatures (S>36.0 psu and T≈29.0oC); this water mass flooded the lower reaches of the estuary up to a distance of seven kilometers (Fig. 3B). Further upstream salinity decreased to ≈18 psu and the isohaline distribution seemed to indicate an increase in the horizontal salinity gradient, although its magnitude (-0.7 psu.km-1) was the same as that observed in the low water survey.
The SPM concentration distribution at low water was stratified near the estuarine mouth, increasing from 40 mg.L-1 at the surface to a maximum of 60 mg.L-1 near the bed, decreasing up-estuary to 10 mg.L-1 at 9 km from the mouth and remaining stable thereafter (Fig. 3C). The SPM concentration at high water was lower than that observed during the low tide survey, and stratification was observed along the first 15 km. The maximum concentration was of the order of 30 mg.L-1, close to the estuarine mouth. Similarly to what had been observed during the low tide survey, beyond the distance of 16 km the SPM concentration remained below 10 mg.L-1 (Fig. 3D). It is worthy of note that salinity and SPM fields are in close agreement as regards displacement, indicating a tidal excursion of nearly 7 km.
The temperature presented only a small spatial variation in both surveys. During the low water survey the averaged temperature was ≈28.7oC, but it was slightly higher (≈29.3oC) during the high water survey, mainly associated with the TW intrusion.
Tidal Surveys
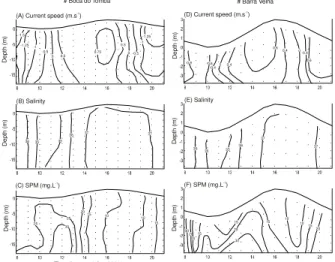
Local variations at hourly intervals of the u-velocity component, salinity and SPM concentration observed close to the middle of the Boca do Tomba
and Barra Velha cross sections, during a semidiurnal
tidal cycle on April 9, 2001, are presented in Figure 4. The u-velocity component of the Boca do Tomba
shows semidiurnal cyclical asymmetrical variations and small vertical shear; ebb currents reached high values approaching -1.5 m s-1 and -1.25 m s-1 at the
beginning of the tidal cycle (08:00 h) and ending at 21:00 h (Fig. 4A). A nucleus of maximum flood near 0.75 m s-1 centered at 5 m depth may be seen in this figure. The velocity shear in the deep layer increases when the current is slack (u=0) and are almost in phase with the low and high slack tide.
22 24 26 28 30
32 34
> 10
10 20 30
40
50 60
(A) Salinity - Low Water
D
e
p
th
(
m
)
(B) Salinity - High Water
D
e
p
th
(
m
)
Distance from Boca do Tomba Inlet (km)
D
e
p
th
(
m
)
D
e
p
th
(
m
)
(C) SPM (mg.L ) - Low Water-1
(D) SPM (mg.L ) - High Water-1
Distance from Boca do Tomba Inlet (km)
Fig. 3. Longitudinal distribution of salinity (psu) and particulate suspended matter (mg L-1) along the Caravelas
River estuary during low tide (A and C, April 10, 2001, 11:00 h – 12:30 h) and high water (B and D, April 10, 2001, 16:15 h – 18:00 h), respectively.
The salinity variation in the Boca do Tomba
quick reversal from the flood to ebb current at 18:00 h and the advective salt transport was apparently missing; this phenomenon may indicate a sub-tidal flow of water into the estuary during the semidiurnal tidal cycle. However, the highest SPM concentration (≈30 mgL-1) was observed during the current reversal from the ebb to the flood (11:00 h and 12:00 h), and the lowest value (≈10.0 mg L-1) between 16:00 h and 19:00 h (Fig. 4C), when the tidal current flows out of the estuary.
The almost simultaneous time variation of u-component, salinity and SPM concentration was recorded at three sampling stations across the widest and shallowest Barra Velha cross section, although
only results from the mid-channel stations #BV-2 are presented (see Fig. 1D). Similarly to the Boca do Tomba results (Fig. 3A), local variations of u-velocity
at the Barra Velha cross section showed semidiurnal
cyclical variation and small vertical and lateral current shear, taking into account the flanking sampling stations; however, due to the greater area of this transect, current intensities were lower and varied between -0.80 m s-1 and 0.80 m s-1 for the central station (Fig. 4D) and from -0.80 m s-1 to 0.60 m s-1 towards the northern and southern stations respectively.
Salinity structure at the Barra Velha cross
section was vertically homogeneous and had almost the same values (35 psu<S<37 psu) and configuration patterns (Fig. 4E) as the three sampling stations. The lowest and highest salinities were observed during the low and high water, respectively, indicating intrusion of the TW mass into the lower reaches of the inlet at high tide, an intrusion which remained for a time interval of almost 5 hours (14:00 h until ≈19:00 h), although the u-component experienced current reversal from the flood to ebb at ≈18:00 h. The saline structure and the small lateral shear of the current
indicate a behavior typical of a well mixed and laterally homogeneous estuary.
The distribution of SPM at the Barra Velha
cross section was laterally heterogeneous, with smaller peak values (≈ 30 mg.L-1) at the central station (Fig. 4F), and higher peak values, of the order of 50 mg.L-1, at the lateral stations. The peak of SPM concentration at the southern flank #BV1 station was observed near to the bottom at 16:00 h, at the H.W. At the #BV2 station the maximum SPM concentration was observed from 12:00 h to 14:00 h, also near the bottom. A similar pattern was also observed at the northern flank #BV3 station, the near bottom maximum SPM concentration lasting, therefore, from 13:00 h until 17:00 h. The #BV3 presented a higher SPM concentration during the tidal cycle, comparatively to the other two stations across the
Barra Velha section.
The salinity isopleths shown in Fig. 4B and E for the Boca do Tomba and Barra Velha
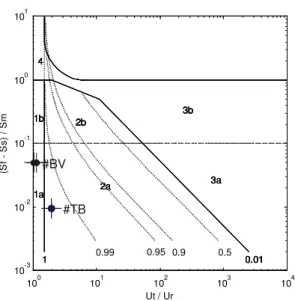
cross-sections indicate a typically well-mixed estuary mainly forced by tidal currents, according to the classification criteria of Pritchard (1955), based on the vertical salinity stratification. The time-mean vertical profiles and the dimensionless stratification and circulation parameters were obtained taking into account the hourly vertical profiles of salinity and u-velocity component. On the assumption of a laterally homogeneous condition the image of those parameters on the Stratification-circulation Diagram (HANSEN; RATTRAY, 1966) classify the Boca do Tomba as type 2a partially mixed with weak vertical salinity stratification (Fig. 5), very close, however, to type 1a;
as the key parameter is nearly equal to one (ν=0.99). The Barra Velha is classified as type 1a, or vertically
homogeneous (Fig. 5). This indicates that the tidal diffusion is the main process for the upstream salt transport.
-1.5 -1.25-1
-0.5 0 0.5
0.75 0.5
0 -0.5 -1
-1.25
36 35 35
36 37 37
25 25 30
20
15 10 10
15
D
e
p
th
(
m
)
D
e
p
th
(
m
)
D
e
p
th
(
m
)
(A) Current speed (m.s )-1
(B) Salinity
(C) SPM (mg.L )-1
Time (hours - 9 Apr 2001)
-0.8 -0.6 -0.400.4
0.60.4 0 -0.4
-0.6
36 35 35
36 37
37
30 20
15 15 10 1015 20 15
15 30
20
(D) Current speed (m.s )-1
(E) Salinity
(F) SPM (mg.L )-1
D
e
p
th
(
m
)
D
e
p
th
(
m
)
D
e
p
th
(
m
)
Time (hours - 9 Apr 2001)
# Boca do Tomba # Barra Velha
Fig. 4. Isopleths of u-velocity component (cm.s-1),
salinity (psu) and particulate suspended matter (mg.L-1) during the semidiurnal tidal cycle on
April 09, 2001, at Boca do Tomba (A, B and C,
respectively) and Barra Velha (D, C and E,
100 101 102 103 104 10-3
10-2 10-1 100 101
1b
1a 2b
2a
3b
3a
1 0.01
4
Ut / Ur
(S
f
-S
s
)
/
S
m
0.99 1b
1a 2b
2a
3b
3a
1 0.01
4
0.95 1b
1a 2b
2a
3b
3a
1 0.01
4
0.9 1b
1a 2b
2a
3b
3a
1 0.01
4
0.5
#TB #BV
Fig. 5. Stratification-circulation Diagram (Hansen; Rattray, 1966), classifying the lower reaches of the Boca do Tomba
(#TB) and Barra Velha (#BV) cross sections as Type 2a and
Type 1a, respectively.
D
ISCUSSION ANDS
UMMARYThe Caravelas estuary comprises a complex system of channels and straits with large mangrove areas that experience periodical flooding. The physiography of the main channel tapers towards the head; whereas at the mouth it is nearly 1 km wide at the head it is just a couple of meters wide. Two interesting features are worth mentioning as they may play an important role in the mass balance of the system. The first is the small drainage area of the Caravelas estuary (600 km2), which may imply a reduced fresh water input and the concentrations of other substances as well. The second is the interconnection through narrow channels of the Caravelas estuary with the southern inlet, at Nova Viçosa, which receives the discharge of the Peruípe River (Fig. 1).
The Peruípe River drainage area is of about 4,600 km2, and its discharge is monitored on a daily basis by the Brazilian National Water Agency at its
Helvécia station (# 55510000). This station covers an area of 2,840 km2, and the mean discharge there is of 20 m3.s-1. The annual discharge regime is regulated by the tropical climate typified by wet summers and dry winters. The greatest discharge is expected to occur in December, (~30 m3.s-1) and the smallest in August (~15 m3.s-1). There are no records of river discharge into the Caravelas estuary from its tributaries, we may assume, however, that they present similar behavior to
that of the Peruípe River. Extrapolating linearly the discharge of the entire drainage basin of Peruípe (4600 km2), and applying it to the Caravelas estuary drainage basin (600 km2), the respective values are 32 m3.s-1 and 4 m3.s-1 for the wet and dry seasons. As the month of April, when the data presented in this study were obtained, is within the waning phase of the wet period, the discharge may be estimated as approximating to the mean annual values.
The residual volume transport from the time averaged instantaneous cross- sectional discharges, of about -600 m3.s-1, was too high to be considered biased or erroneous due to the semi-diurnal difference of the tidal phases, but neither was it possible to justify it by the river discharge, which is two orders of magnitude smaller. The local tidal form number of 0.12 (LESSA; CIRANO, 2006) indicates a pure semi-diurnal pattern and fully justifies 13-hour tidal surveys to account for the semi-diurnal variability. Furthermore, the difference of water level from the start to the end of the 13-hour survey was of only 0.02 m and the first and last discharge measurements were practically the same. These facts make the residual volume transport a straightforward result, and demonstrate the existence of a dynamic exchange between Caravelas and Nova Viçosa inlets through the interconnecting channels.
The full interpretation of the mechanics that lead to this residual flow from the Nova Viçosa (southern inlet) to the Caravelas (northern inlet) cannot be reached on the basis of the present data set alone. Residual flows in a coastal embayment may result from several different physical processes such as river discharge, gravitational circulation, wind stress, etc. Guyondet and Koutitonsky (2007) found that for a double inlet lagoon system the inlet morphology was the main factor producing residual flux from one inlet to the other. An overview of the Caravelas and Nova Viçosa inlets (Fig. 1) shows that they have distinct morphologies and this may be an important factor in understanding the question of the residual flow.
Both Boca do Tomba and Barra Velha
cross-sections presented ebb dominance of the u-velocity component. The ebb currents in the first were, therefore, twice as strong (≈1.5 m.s-1) as the flood currents (≈0.8 m.s-1), though the current asymmetry in the second was not so drastic. The ebb currents at the
Barra Velha cross-section reached 0.8 m.s-1, while
Tidal current asymmetry arises from non-linear interactions due to tidal propagation and estuarine morphology, when part of the principal astronomical constituent’s energy is transferred to over-tides and compound tidal constituents of higher frequency (PARKER, 1990). The degree of tidal distortion may be evaluated using the amplitude and phase relationships between the main lunar semi-diurnal constituent M2 and its main over-tide M4. Either flood or ebb dominance may result. Flood dominance is usually observed in shallow estuaries under macrotidal regimes. Ebb dominance is observed in deeper estuaries with large volume storage areas (SPEER et al., 1990), which applies very well to the Caravelas estuary. According to Friedrichs and Aubrey (1988), flood or ebb asymmetry can be estimated based on two non-dimensional numbers: the ratio between M2 amplitude, a, in the sea adjacent to the mean estuarine depth, H; and the ratio between the volume storage in the intertidal areas, VS, to the channel volume, VC.
There is no bathymetric information available for the Caravelas estuary, though the longitudinal surveys can provide an estimate of the depth along the main channel (Fig. 3), of the order of 7 m. Taking into account also the numerous creeks in the system, an approximate mean depth of 4 m sounds reasonable. The channel area according to nautical charts is of about 24 km2, and the channel volume is of about 96 x 106 m3. The intertidal storage volume can be estimated from tidal prism minus the product of tidal height (3 m) and channel area (24 km2). The tidal prism can be computed by integrating the area of the positive volume transport values (Fig. 2A), which gives 100 x 106 m3. The resulting storage volume is of about 30 x 106 m3, and the ratio V
S/VC is 0.3. The a/H ratio is 0.2, where the M2 amplitude in the nearshore area is 0.9 m (LESSA; CIRANO, 2006). Interpreting these values in the light of the ebb/flood dominance diagram presented in Speer et al. (1990), the Caravelas corroborates the theory of tidal asymmetry. However, a question arising from the present experimental data is why the current asymmetry at the Boca do Tomba
cross-section was so much higher than that of Barra Velha? The answer demands further research and lies beyond the scope of this present article.
The salinity vertical structures in the longitudinal surveys as on both cross- sections and at all the stations of Barra Velha cross-section were well mixed, with time variation ranging from 35 psu to 37 psu, modulated by the semidiurnal tidal regime, and constant spatial gradient landwards. The salinity was as high as 15 psu even close to the estuarine head. These results indicate an insignificant role of the fresh water discharge in the estuarine hydrodynamics. Of course this scenario could change by virtue of drastic rainy events during the wet season, even if only of
short periods. The flow ratio ( DYER, 1997) given by the ratio between the river flow per tidal cycle (~1.8 x 10⁵ m3) and the tidal prism is 0.002, while when it is below 0.1 the system may be classified as well mixed, which is in close agreement with the results obtained with the application of the Stratification-circulation Diagram of HANSEN; RATTRAY (1966). The period of nearly 5 hours comprehended by the period before and after the high water when the salinity was nearly constant at 37 psu indicates the transit of TW in to and out of the lower estuary, and small longitudinal mixing. Taking advection as the dominant salt transport mechanism during a single tidal cycle, the tidal excursion in the lower estuary can be estimated at nearly 10 km using salinity as a tracer of displacement, as observed by changes during longitudinal salinity distribution at low and high tide.
The SPM presented an inverse and non-linear relationship to the salinity (Fig. 6), also evidenced by the decreasing concentrations landwards (Fig. 3). This behavior was, in general terms, unexpected. As a rule of thumb, SPM is higher towards the estuarine head (e.g., UNCLES et al., 2002;
SCHETTINI et al., 2006). This inverse pattern observed in the Caravelas estuary brings out the insignificant role of the local drainage basin, already indicated by salinity results, in the supply of fresh water, SPM and other scalar properties. The semi-diurnal SPM concentration observed on the Boca do Tomba and Barra Velha cross-sections is basically tidally determined, responding to cyclic erosion and deposition (e.g. NICHOLS, 1984; PRANDLE, 2009; SIEGLE et al., 2009). The near shore processes may
also play a role in the control of the SPM availability in the coastal waters that may enter the estuary during flood.
Additionally, the nearly stationary wave behavior of the tide indicated by the volume transport versus water level relationship (Fig. 2B) suggests that the tidal currents will be strongest in the lower estuary and decrease in magnitude landwards. However, weaker currents will be unable to erode bed sediments and the lag in transporting and settling them will be effective in trapping sediment landwards (POSTMA, 1967; DYER, 1995). This result corroborated the observations of the mineralogy of bottom sediment. Knoppers et al. (1999b) found that in the estuary high concentrations of some material component biogenic matter such as quartz, kaolinite sand and smectite transported in the run-off were partially covered by fe-oxides, which is a characteristic of old sediments.
cross-section volume transport, integrated per hour, given in units of ton.hr-1 (Fig. 7). Both flood and ebb maximum SPM transport were of the order of ~ 400 ton.hr-1, the residual SPM transport being -15 tons and -3 tons per tidal cycle for Boca do Tomba and Barra Velha, respectively. The seaward residual transport is
apparently paradoxical, since there is no riverine sediment supply, and the mangrove intertidal areas suggest the depositional process. Therefore, as the present data set is limited to a single tidal cycle, the comprehension of the fine sediment dynamics in the Caravelas estuary calls for further assessment.
15 20 25 30 35 40
5 10 15 20 25 30 35 40 45 50 55
Salinity
S
P
M
(m
g
L
-1)
Fig. 6. Relationship between SPM and salinity based on the longitudinal data. Dots represent the low tide survey; hollow circles represent the high tide survey.
8 10 12 14 16 18 20 22
-600 -400 -200 0 200 400
Importation
Exportation
Barra Velha
Boca do Tomba
S
P
M
T
ra
n
s
p
o
rt
(
to
n
.h
r
)
-1
Time (hours - 9 Apr 2001)
Fig. 7. Temporal variation of SPM transport through the
Barra Velha (solid line) and Boca do Tomba (dashed line).
A
CKNOWLEDGMENTSWe wish to express our thanks to ARACRUZ Celulose S.A. who kindly allowed the authors to use the data here presented; to CEPEMAR – Environmental Services, especially to Marcelo
Travassos for the assistance given during the surveys; to Marçal Duarte Pereira for helping with the hydrological data; to the anonymous reviewers for their comments and suggestions. CNPq grants 306217/2007-4 and 302702/2002-4. The English text was revised by Prof. Arthur Anthony Boorne.
R
EFERENCESANDRADE, K. M. Comportamento dos sistemas frontais
sobre a América do Sul. Dissertação (Mestrado) -
Instituto Nacional de Pesquisas Espaciais, São José dos Campos, 155p. 2004.
ANDUTTA, F. P. Experimentos e modelagem numérica
no estuário do rio Curimataú, RN. Dissertação
(Mestrado) - Instituto Oceanográfico, USP, São Paulo, 122p. 2006.
ARAÚJO, M.; MEDEIROS, C.; RIBEIRO, C. Energy balance and time-scales of mixing and stratification in the Jaboatão estuary, NE-Brazil. Rev. Bras. Oceanogr., v. 47, n. 2, p.145-154, 1999.
BLANTON, J. O.; LIN, G.; ELSTON, S. A. Tidal current asymmetry in shallow estuaries and creeks. Continent.
ShelfRes., v. 22, n. 11-13, p.1731-1743, 2002.
BOON III, J. D. Tidal discharge asymmetry in a salt marsh drainage system. Limnol. Oceanogr., v. 20, n. 1, p.
71-80, 1975.
CASTRO, B. M.; MIRANDA, L. B. Physical Oceanography of the Western Atlantic Continental Shelf located between 4oN and 34oS - Coastal Segment (4,W). In:
ROBINSON, A. R.; BRINK, K. H. (Ed.). The Sea.
New York: John Wiley & Sons, v.11, p. 209-251, 1998. CASTRO, B. M.; VANIN, A. M. S. P.; BRANDINI, F.; MIRANDA, L. B. Multidisciplinary oceanographic processes on the Western Atlantic continental shelf Between 4oS and 34oS (4,W). New York, In:
ROBINSON, A. R.; BRINK, K. H. (Ed.). The sea. New York: John Wiley & Sons, v. 14, p. 259-293, 2006. CHAVES, R. R. Variabilidade da precipitação na região
Sul do Nordeste e sua associação com padrões
atmosféricos. Dissertação (Mestrado) - Instituto
Nacional de Pesquisas Espaciais, São José dos Campos, 159p. 1999.
DYER, K. R. Sediment transport in estuaries. New York. In: PERILLO, G. M. E. (Ed.). Geomorphology and
Sedimentology of estuaries. Amsterdam, Elsevier, p.
423-449, 1995.
DYER, K. Estuaries: A pysical itroduction. 2nd Ed. New
York: John Wiley & Sons, 195 p., 1997.
FRIEDRICHS, C. T.; AUBREY, D. G. Non-linear tidal distortion in shallow well-mixed estuaries: a synthesis.
Estuar. coast. Shelf Sci., v. 27, p.521-545, 1988.
GAETA S. A.; LORENZZETTI, J. A.; MIRANDA, L. B., SUSINI-RIBEIRO, S. M. M.; POMPEU, M.; ARAUJO, C. E. S. The Vitoria Eddy and its relation to the phytoplankton biomass and primary productivity during the austral fall of 1995. Arch. Fish. mar. Res., v. 47, n. 2-3, p. 253-270, 1999.
GUYONDET, T.; KOUTITONSKY, V. G. Tidal and residual circulations in coupled restricted and leaky lagoons.
Estuar. coast. Shelf Sci., doi:10.1016/j.ecss.
HANSEN, D. V.; RATTRAY, M. New dimensions on estuarine classification. Limnol. Oceanogr., v.11, p.319-326, 1966.
KJERFVE, B. Measurement and analysis of water current, temperature, salinity and density. In: DYER, K. R. (Ed.).
Estuarine hydrography and sedimentation.
Cambridge: Cambridge University Press, p.186-227, 1979.
KJERFVE, B. Manual for investigation of hydrological
processes in mangrove ecosystems. Nova Delhi:
Unesco, 1990. 79 p.
KNOPPERS, B.; MEYERHOFER, M.; MARONE, E.; DUTZ, J.; LOPES, R.; LEIPE, T.; CAMARGO, R. Compartments of the pelagic system and material exchange at the Abrolhos Bank coral reefs, Brazil. Arch.
Fish. mar. Res. v.47, n.2-3, p. 285-306, 1999a.
KNOPPERS, B.; EKAU W.; FIGUEIREDO, A. G. The coast and shelf of east northeast Brazil and material transport.
Geo-Marine Letters,v.19, p.171-178, 1999b.
LEIPE, T.; KNOPPERS, B.; MARONE, E.; CAMARGO, R. Suspended matter transport in coral reef waters of the Abrolhos bank Brazil. Geo-Marine Letters, v.19,
p.186-195, 1999.
LESSA, G. C.; CIRANO, M. On the circulation of a coastal channel within the Abrolhos Coral-Reef system-Southern Bahia, Brazil. J. coast. Res., n. 39(SI), p.450-453, 2004.
MEDEIROS, C.; KJERFVE, B. Hydrology of a Tropical Estuarine System: Itamaracá, Brazil. Estuar. coast.Shelf Sci., v. 36, p. 495-515, 1993.
MIRANDA, L. B. Análise de massas de água da plataforma continental e da região oceânica adjacente: Cabo de São Tomé (RJ) à Ilha de São
Sebastião (SP). Tese (Livre Docência) - Instituto
Oceanográfico, USP, São Paulo, 194p. 1982.
MIRANDA, L. B.;CASTRO, B. M.; KJERFVE, B.
Princípios de Oceanografia Física de estuários. São
Paulo: Editora da Universidade de São Paulo, 2002. 424 p. Coleção Acadêmica, n. 42.
MIRANDA, L. B.; BERGAMO, A. L.; CASTRO, B. M. Interactions of river discharge and tidal modulation in a tropical estuary, NE Brazil. Ocean Dynam., v. 55, n.
5-6, p. 430-440, 2005.
MIRANDA, L. B., BÉRGAMO, A. L.; RAMOS E SILVA, C. A. Dynamics of a tropical estuary: Curimataú River, NE Brazil. J. coast. Res., n. 39(SI), p. 697-701, 2006. NICHOLS, M. M. Effects of fine sediment resuspension in
estuaries. In: MEHTA, A. J. (Ed.). Estuarine cohesive
sediment dynamics, Lecture Notes on Coastal
Estuarine Studies, p. 5-42. 1984.
PARKER, B. B.The relative importance of the various nonlinear mechanisms in a wide range of tidal interactions (review). New York. In: PARKER, B. B. (Ed.). Tidal hydrodynamics. New York: John Wiley & Sons, 1990. p. 237-268.
PEREIRA, A. F., BELEM A. L.; CASTRO, B. M.; GEREMIAS, R. Tide-topography interaction along the Eastern Brazilian shelf. Continent. Shelf Res., v. 25, n.
12-13, p.1521-1539, 2005.
PRANDLE, D. Estuaries: dynamics, mixing, sedimentation
and morphology. Cambridge,: Cambridge University Press, 2009. 236 p.
PRITCHARD, D. W. Estuarine, circulation patterns. Proc.
Am . Soc. Civil Eng., (Separate 717), p. 1-11, 1955.
POSTMA, H. Sediment transport and sedimentation in the estuarine environment. In: LAUFF, G. H.(Ed.).
Estuaries. AAAS, Pub. 83, p.153-232, 1967.
RANASINGHE, R.; ATTIARATCHI, C. Tidal inlet asymmetry in diurnal regimes. Continent. Shelf Res., v. 20, n. 17, p. 2347-2366, 2000.
SCHETTINI, C. A. F.; RICKLEFS, K.; TRUCCOLO, E. C.; GOLBIG, V. Synoptic hydrography of a highly stratified estuary. Ocean Dynam., DOI 10.1007/s10236-006-0066-1, 2006.
SCHUBEL, J. R.; CARTER, H. H. The estuary as a filter for fine-grained suspended sediment. In: KENNEDY, V. S. (Ed.). The estuary as a filter. New York: Academic Press, p. 81-105, 1984.
SIEGLE, E.; SCHETTINI, C. A. F.; KLEIN, A. H. F.; TOLDO JR., E. E. Hydrodinamics and suspended sediment transport in the Camboriú estuary Brazil: pre-jetty condition. Braz . J. Oceanogr., v. 57, n. 2, p. 123-135, 2009.
SILVEIRA, I. C. A. DA; SCHMIDT, A. C. K.; CAMPOS, E. J. D.; GODOI, S. S. de; IKEDA, Y. A. Corrente do Brasil ao Largo da Costa Leste Brasileira. Rev. Bras.
Oceanogr., v .48, n. 2, p.171-183, 2000.
SPEER, P. E.; AUBREY, D. G.; FRIEDRICHS, C. T. Nonlinear hydrodynamics of shallow tidal inlet/bay systems. In: PARKER, B. B. (Ed.). Tidal
hydrodynamics. New York: John Wiley & Sons, 1990.
p. 321-339.
SUMMERHAYES, C.; MELO, U. D.; BARRETTO, H. The influence of upwelling on suspended matter and shelf sediments off southestern Brazil. J. sedim.Petrology, v.
46, n. 4, p. 819-828, 1976.
TEIXEIRA, C. E. P. Caracterização e variabilidade da Hidrodinâmica da zona costeira adjacente ao banco
de Abrolhos. Dissertação (Mestrado) - Instituto
Oceanográfico, USP, São Paulo, 93p. 2006.
UNCLES, R. J.; STEPHENS, J. A.; SMITH, R. E. The dependence of estuarine turbidity on tidal intrusion length, tidal range and residence time. Continent. Shelf Res., v. 22, n. 11-13, p. 1835-1856, 2002.
UNESCO. Background papers and supporting data on the Practical Salinity Scale 1978. Unesco tech. Pap.mar. Sci., no. 37, 1981. 144 p.