Article
Printed in Brazil - ©2017 Sociedade Brasileira de Química 0103 - 5053 $6.00+0.00
*e-mail: [email protected]
Smectite Clay Modified with Quaternary Ammonium as Oil Remover
Carlos A. Lira Junior,a,b Domingos S. A. Silva,c Arão P. da Costa Filho,c
Elizabete F. Lucasd and Sirlane A. A. Santana*,b
aDepartamento de Ensino Superior e Tecnologia, Instituto Federal do Maranhão, Campus Bacabal,
Avenida João Alberto, s/n, 65700-000 Bacabal-MA, Brazil
bDepartamento de Química and cDepartamento de Tecnologia Química, Universidade Federal do
Maranhão, Avenida dos Portugueses, 1966, Cidade Universitária, 65080-805 São Luis-MA, Brazil
dCOPPE/PEMM, Universidade Federal do Rio de Janeiro, Avenida Horacio Macedo, 2030, bloco F,
Cidade Universitária, 21941-598 Rio de Janeiro-RJ, Brazil
Clays such as smectite have high technical and economic viability due to their large adsorption capacity. These properties can be improved by treatment with acids or other modiications. This paper describes experiments to prepare and characterize organoclays and to evaluate their ability to remove oil from contaminated water in comparison with clay in its natural state. We used natural smectite clay from the municipality of Presidente Dutra, Maranhão State, modiied with the quaternary ammonium salt cetyltrimethylammonium bromide. Characterization was performed by X-ray diffraction, Fourier transform infrared spectroscopy, X-ray luorescence, thermogravimetry and determination of surface area by the Brunauer-Emmett-Teller (BET) method. The results showed appropriate conditions of the organophilization process, indicating the intercalation of quaternary ammonium cations between the clay layers. The adsorption tests showed that the natural clay reduced the amount of oil contained in the aqueous medium by 76.16%, while the corresponding removal rates of all organoclays tested were above 92%, which makes them potentially applicable to remove oil from wastewaters.
Keywords: smectite, organophilization, quaternary ammonium, adsorption, oily water
treatment
Introduction
Petroleum is a complex mixture of various organic compounds, principally hydrocarbons, along with other constituents such as sulfur, nitrogen, oxygen and metals. Petroleum and its derivatives are the world’s main source of
energybut also are one of the main sources of environmental
pollution.1-4 During the process of extracting crude oil, a
considerable quantity of water is found mixed with the oil. This produced water needs to be treated before being discharged or reused in the production process or in other areas.5,6
Interest in developing better treatment methods has grown in recent years as environmental regulations applicable to the production, transport and storage of
petroleum have become more stringent.7,8 The concentration
of contaminants in industrial efluents in general can be
reduced by various physical and/or chemical processes, including chemical and catalytic oxidation, biological techniques, electrolytic methods, adsorption and membrane
filtration.5,9-12 Of these, adsorption is one of the most
promising methods.6
Adsorption has been widely studied and used to treat
efluents contaminated by various toxic substances.13-22
Natural adsorbents such as clays can be chemically modiied to adjust their physical-chemical properties, adding functionalities for use in various types of
applications.10,23,4 Speciically in the treatment of efluents
produced by the petroleum industry, it is important to develop new materials and improve existing ones that have good cost-beneit ratios, especially those that are abundant in nature.
activated charcoal stand out for their high speciic surface
area, with values between 500 and 1500 m2 g-1, permitting
good adsorption capacity.6,25-27 Despite these advantages,
their generalized use is restricted by their high production cost, leading to the search for alternative adsorbents. Clays are attractive because of their low cost and high
adsorption potential.28 Besides removing oil, clays also
serve as adsorbents of heavy metals, dyes and other
contaminants.29-32
Natural clays are hydrophilic compounds, often making them unsuitable as adsorbents of organic compounds. However, modiication with organic molecules intercalated between their structural layers makes them hydrophobic, enabling their use to remove organic compounds. Clays
subjected to this modiication are called organophilic.33,34
The clay used in this paper is characterized as smectite from igneous rock, usually a volcanic tuff or ash. In the group of phyllosilicate clay mineral, montmorillonite, beidelita, nontronite, saponite and hectorite are the most important. Montmorillonite is the most abundant and its properties allow its application in several industrial areas.
The general chemical formula is Mx(Al
4-xMgx)Si8O20(OH)4,
where Mx represents alkali and alkaline earth metals in
interlamellar layers. Such metals are also called changeable cations, since they can be changed by other cations under
reversible way.35-38
The smectite plates present irregular shape, are very thin and tend to aggregate during drying. Its basic structure has negatively charged surface that is neutralized by the changing cations which are on their sides and, mainly, between their lamellas, known as interplanar space. In this region, the water molecules are adsorved and the changing
cations (as Ca2+, Mg2+, Na+) are electrostatically ixed,
having the function of compensating negative charges
generated by isomorphic replacing in the network.37,39,40
The predominance of one of these cations and the clay mineralogy will determine its properties, such as expansion
and cation exchange.36-38,41-43
Natural clays can be modified according to their cation exchange capacity (CEC), which is the quantity of
exchangeable cations per dry weight. This exchange is of
great interest because it alters the basal interplanar distance, enhancing the adsorption capacity. The exchangeable cations, which are connected electrostatically along the faces and allocated between the structural layers, are grouped according to their facility for substitution or exchange in the following order: Li+ > Na+ > K+ > Rb+ >
Cs+ > Mg2+ > Ca2+ > Sr2+ > Ba2+ > H
3O+.44 Besides valence,
the exchange capacity is related to hydration, so that the lower the valence and the greater the hydration, the greater
the exchange capacity will be.45
Organophilic clays can be prepared by substituting the cations located between the layers with quaternary ammonium salts, which have four organic radicals linked to nitrogen by covalent bonds and a positive charge,
neutralized by an anion.46,47
In this study we used a clay that is abundant in the state of Maranhão, Brazil, in its natural state and modiied by incorporation of cetyltrimethylammonium bromide (CTAB) to obtain materials with high functionalization degree. We characterized the resulting compounds to elucidate the mechanisms involved in their formation and assessed them for their capacity to remove oil from contaminated water, under various experimental conditions.
Experimental
Materials
The clay used in this work was obtained from the municipality of Presidente Dutra, Maranhão State, and had not undergone any industrial treatment process. The quaternary salt used was cetyltrimethylammonium bromide (CTAB), supplied by ISOFAR, with purity of 98.0%.
Preparation of the natural clay
The natural clay samples were cleaned manually to remove impurities like pebbles, leaves, etc. Then the clay was washed with distilled water and screened through a sieve with mesh of 0.18 mm to remove other smaller impurities. Next, the suspension containing the clay was left at rest for 24 h, after which the supernatant was separated and the clay was dried in an oven at 105 °C for 24 h. The dried clay was then ground with a mortar and pestle and sifted to obtain grain size between 25 and 75 μm. The resulting material was used to produce the modiied materials.
Determination of the cation exchange capacity (CEC)
The CEC was determined using barium chloride
buffered with triethanolamine-BaCl2-TEA, as described by
Mehlich.48 In this process, 40 mL of the triethanolamine
(TEA) buffer solution at 0.338 mol L-1 and BaCl
2
1.000 mol L-1 at pH 8.2 was added to 1 g of natural clay
and this mixture was kept at 170 rpm for 16 hours, being, after that, centrifuged. Then, 20 mL of a solution of
MgSO4.7H2O 0.025 mol L-1 was added. Then 0.5 mL of the
buffer solution NH4OH/NH4Cl, pH = 10, was added to the
supernatant and the solution was titrated with Na2EDTA
Preparation of the organophilic clay
To obtain the organophilic clay, a suspension containing 25 g of clay and 500 mL of deionized water was mixed with a solution of CTAB, under stirring at 200 rpm for 3 h. The CTAB was prepared by adding a mass of the surfactant (corresponding to 50, 100 or 150% of the clay’s CEC) in 100 mL of deionized water, after which the solution was stirred for 30 min. Then the clay was washed with deionized water and vacuum iltered until the conductivity of the supernatant remained constant, a parameter necessary for removal of the excess bromide ions. Then the material was dried in an oven at 105 °C for 24 h and ground into powder.
To check the effect of temperature during preparation of the organophilic clay, the aqueous dispersions of clay and salt were prepared at temperatures of 25, 55 and 75 °C. For the adsorption testing and other characterizations, the natural clay and the three organophilic clays that presented the greatest basal spacings were used, as determined by X-ray diffraction.
Characterization of the clay materials
The samples of natural clay and clay modiied with CTAB salt were characterized by X-ray diffraction (XRD), X-ray luorescence (XRF), Fourier transform infrared spectroscopy (FTIR), thermogravimetric analysis (TG) and measurement of speciic surface area and pore diameter.
The samples were screened through sieves with mesh sizes between 25 and 75 μm, pressed on acrylic supports and analyzed in scanning mode with a Bruker D8 Advance
diffractometer, with Kα radiation of λ 0.0154056 nm,
produced by a copper tube, at 40 kV and 40 mA, with
scanning amplitude of 2θper minute (0.04º s-1) from 3°
to 90°.
The chemical elements present in the samples were quantiied by X-ray luorescence by direct analysis of pellets with diameter of 18 mm containing approximately 500 mg of each sample, using a Rigaku RIX 3100 XRF spectrometer equipped with a rhodium tube.
The FTIR spectra of the samples were obtained with a PerkenElmer 2000 spectrometer in the spectral range from
4000 to 400 cm-1, using KBr pellets.
The curves of mass loss in function of temperature were obtained with a Shimadzu TGA-51 analyzer under low of
20 mL min-1 of N
2, with reading in the temperature range
from 25 to 900 oC at a heating rate of 10 oC min-1.
The surface area and average pore diameter of the samples were determined, respectively, by the methods of Brunauer-Emmett-Teller (BET) and Barret-Joyner-Halenda
(BJH).49,50 For this purpose, we used a Quantachrome
Instruments NOVA 4200 instrument to measure the physical adsorption of nitrogen in the samples, after degasiication for 4 h at 195 °C.
Preparation of the synthetic oily water
The synthetic oily water was prepared from a dispersion of crude oil in a saline solution containing total salts of
55,000 ppm (NaCl:CaCl2 10:1) under rotation of 10,000 rpm
for 10 minutes, in an Ultra-Turrax homogenizer.17 The
prepared solutions had average oil concentration of 50 ppm.
Adsorption evaluation
Two types of adsorption tests were performed. The irst consisted of varying the mass of the adsorbent (natural and organophilic clay samples), with the contact time and oil concentration in the saline solution held constant. The second consisted of varying the contact time while keeping the adsorbent mass and oil concentration ixed.
Variation of adsorbent mass
In this test, an absorbent mass of 0.1, 0.3, 0.7 or 1.0 g was placed in 50 mL of oily water for 4 h at 25 °C under stirring of 100 rpm. After the contact time, the samples were centrifuged for 10 min at 4000 rpm and the total oil and grease (TOG) content of the supernatant was measured.
Variation of contact time
In this test, 1 g of adsorbent was placed in 50 mL of oily water, in a thermostatically controlled bath at a temperature of 25 °C, with stirring of 100 rpm, for times of 15, 30, 60, 120, 180 and 240 min. Then the samples were centrifuged for 10 min at 4000 rpm and the TOG was determined.
Determination of the total oil and grease content (TOG)
After centrifugation, a 45 mL aliquot of oily water was placed in a 100 mL test tube and mixed with 5 mL
of n-hexane. The system was shaken manually for about
2 minutes to extract the largest possible quantity of the
oil phase to the medium containing n-hexane. After
complete separation, the organic phase (containing oil and grease) at the top of the tube was extracted and transferred to a cuvette for reading in a Turner Designs TD3100 spectrofluorometer, previously calibrated
with two solutions: pure n-hexane and oily water with
concentration of 225 mg L-1. The TOG concentration in
Results and Discussion
Cation exchange capacity (CEC)
The CEC value for the clay was 85 meq per 100 g, a
value in line with those of smectitic materials, of 70 to
150 meq per 100 g.51
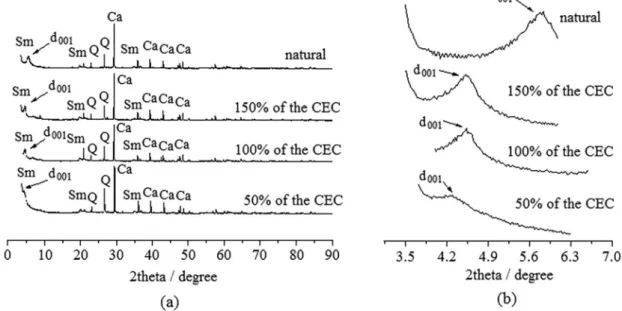
X-Ray diffraction (XRD)
Figure 1 presents the X-ray diffractogram of the
untreated clay. Characteristic peaks can be observed for
clay that has smectite as the predominant mineral.48,51 The
irst peak, that appears before 2θ angle corresponding to
10°, with the value of 5.84° and so θ = 2.92°, represents
the basal distance (d001), determined by Bragg’s Law
(d = nλ / 2sinθ), with n = 1 and λ = 0.154056 nm. The
value found was 1.51 nm, in line with other reports in the
literature.52-54 Such spacing is provoked by small cations
and molecules between mineral clay’s layers.55-57
Effect of CTAB concentration
The clay mineral used in this study is expansive, thus allowing the interlamellar distance to be increased, depending on the size of the molecule used for
modiication.58 This expansion is measured by the shift
of the d001 diffraction angle, since according to Bragg’s
law, this angle is inversely proportional to the interatomic distance. A reduction of this angle indicates interlamellar expansion of the clay mineral.
Figure 2 shows the diffractograms of natural clay and the organophilic clays prepared at 25 °C with different concentration of CTAB salt (50, 100 and 150% of the CEC). The salt incorporation provokes an increasing in the interlamellar space of the clay, reducing the diffraction angle (Figure 2b). Such behavior conirms ion exchange in the clay layers and the achievement of the organophilic clay. The salt did not change the chemical structure of the clay since other peaks have not changed.
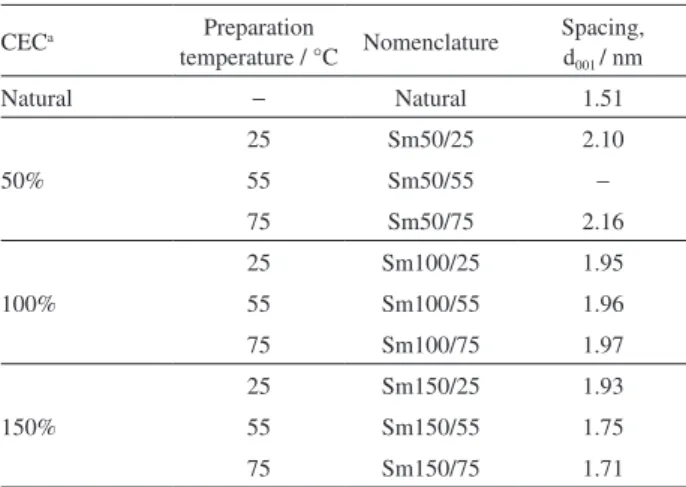
Effect of processing temperature
The results obtained with organophilic clays prepared at 55 and 75 °C, and CEC of 50, 100 and 150%, are presented in Table 1. The data show that the basal spacing increased in all Figure 1. X-Ray diffractogram of natural clay (Q: quartz; Ca: calcite; Sm: smectite).
the organophilic clays produced except Sm50/55 (which did
not present a d001 peak), in comparison with the natural clay,
proving the effective intercalation of the CTAB molecules in the clay. The values indicate a bilayer or pseudo-triple layer
arrangement of the clay structures.59 Despite containing
the lowest quantity of salt, the organophilic clay Sm50/75 presented the largest basal spacing (2.16 nm) among all the samples. This can be explained because the basal spacing varies according to the orientation of the quaternary
ammonium salt used in the modiication.59,60
The preparation temperature inluenced the samples prepared with 150% of the CEC, so that the basal spacing
(d001) reduced from 1.93 nm (when prepared at 25 °C)
to 1.71 nm (when prepared at 75 °C). For the other samples, the CTAB intercalation was not signiicantly inluenced by temperature. The basal spacing decreased as increasing salt concentration during the organophilic clay preparation. In fact, the temperature and surfactant concentration do not directly inluence the basal spacing since it changes in function of CTAB orientation in the
interlamellar space.60-62
Besides the in natura clay, the organophilic ones E50/75, E100/75 and E150/25 were used for further characterizations and to study the oil removal from water, since they presented the highest values of basal spacing obtained by XRD and Bragg’s law.
X-Ray fluorescence (XRF)
From the X-ray luorescence analysis it was possible to determine the chemical composition of the four samples. Table 2 reports the percentages of oxides present. The chemical composition of smectite clays varies substantially according to the place where they
are obtained, and can even vary in the same deposit. Therefore, comparison of clays of the smectite group is somewhat complicated since there are no deined chemical compositions to serve as a base for reference. However,
from the SiO2/Al2O3 ratio it is possible to determine
to what group a certain clay sample belongs.63 This
proportion was 3.12 for the untreated clay, conirming it
belongs to the smectite group.51
The treatment caused a reduction in the level of calcium in comparison with the natural clay. This reduction is related to the intercalation of the CTAB molecules and
consequent substitution of the Ca2+ present in the clay. The
incorporation of CTAB in samples Sm50/75, Sm100/75 and Sm150/25 caused the appearance of bromine (Br), with the concentration increasing with rising quantity of salt used to modify the samples. This can be understood as the residue of the CTAB present in the clay after washing.
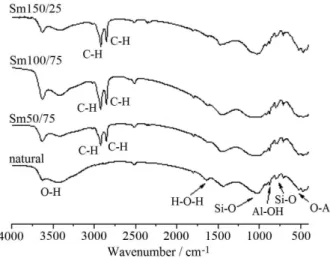
Fourier transform infrared spectroscopy (FTIR)
Figure 3 presents infrared spectra of the natural clay and organophilic clays Sm50/75, Sm100/75 and Sm150/25. Comparison of the spectra shows the presence of peaks at
3630 and 3436 cm-1, which deine the bands related to the
free and/or combined OH group.64 The presence of H
2O is
conirmed by the absorption at approximately 1630 cm-1,
corresponding to the H−O−H angular deformation. The
spectra also have peaks at 1025 cm–1, characteristic
of asymmetric Si−O stretching, Al−OH deformation
vibrations at 872 cm-1 and Si−O and O−Al vibrations at
793 and 507 cm-1, respectively.65,66 The presence of the
same peaks in all samples, except that corresponding
to the H−O−H angular deformation, indicates that the
structures of the modiied clay samples were maintained after organophilic treatment.
Table 1. Basal spacings of the natural and organophilic clay samples
CECa Preparation
temperature / °C Nomenclature
Spacing, d001 / nm
Natural − Natural 1.51
50%
25 Sm50/25 2.10
55 Sm50/55 −
75 Sm50/75 2.16
100%
25 Sm100/25 1.95
55 Sm100/55 1.96
75 Sm100/75 1.97
150%
25 Sm150/25 1.93
55 Sm150/55 1.75
75 Sm150/75 1.71
aCation exchange capacity.
Table 2. Chemical composition, in oxides, of the clay samples
Oxide Chemical composition / %
Natural Sm50/75 Sm100/75 Sm150/25
SiO2 42.70 44.87 45.01 44.92
CaO 28.73 26.55 26.43 26.55
Al2O3 13.74 13.87 13.83 13.81
Fe2O3 7.18 7.24 6.57 6.39
MgO 3.48 3.01 3.07 2.99
K2O 2.36 2.44 2.22 2.22
Na2O 0.06 0.06 0.05 0.06
Br − 0.25 1.24 1.51
The spectra of the organophilic clays contain a pair
of bands between 2851 and 2918 cm-1, which result from
asymmetric and symmetric vibrational C−H stretching of
the CH3 and CH2 groups present in the amine chains. The
appearance of these peaks conirms the organophilization
of the clay.64,67
Thermogravimetric analysis (TG)
The samples (natural, Sm50/75, Sm100/75 and Sm150/25) were analyzed by thermogravimetry. All curves exhibited three thermal decomposition ranges. The irst occurred at a temperature between 15 and 136 °C, where the natural sample presented mass loss of 3.95% and the organophilic clays Sm50/75, Sm100/75 and Sm150/25 underwent losses of 1.95, 1.38 and 1.26%, respectively, indicating the existence of less free water
in the organophilic clays.68,69 Between temperatures of
200 and 600 °C, a second thermal decomposition step occurred. In this range, the natural clay lost 1.74% of its mass, while the organophilic clays Sm50/75, Sm100/75 and Sm150/25 lost approximately 11.0, 16.7 and 20.2% of their masses, respectively. This greater mass loss can be attributed to the decomposition of the CTAB salt used for organophilization of the samples, with a larger mass loss
with higher concentration of that salt.29
The last decomposition step is attributed to the dehydroxylation of the clay mineral and occurred at a temperature above 700 °C, where there was mass loss of
about 12% in all the samples.68,70 Overall, sample Sm150/25
lost the most mass (37.2%), followed by Sm100/75 and Sm50/75, which lost 32.5 and 30.5%, respectively. All these losses were greater than for the natural clay, which lost 19.1% of its mass, indicating effective intercalation of the CTAB salt.
Specific surface area and average pore diameter
The results of measuring the surface area by the BET method and average pore diameter by the BJH method are shown in Table 3.
The surface area value of 27.8 m2 g-1 found for the
natural clay is considered low, but this is a characteristic of smectite clays and is in line with the values reported in the
literature.16,58,71 The organophilization reduced the surface
area, due to the aggregation of the quaternary ammonium salts, which prevents the entrance of nitrogen molecules. The results of other studies indicate this tendency is observed most of the time, although the speciic surface
area of clay can increase after modiication.29,59
The addition of the CTAB salt increased the average pore diameter. The value found for sample Sm150/25 (12.69 nm) was smaller than for samples Sm50/75 (13.04 nm) and Sm100/75 (13.18 nm). This pattern can
be explained by the decrease in d001 basal spacing, shown
in Table 1 (XRD) and in Figure 3 (XRD), enabling the occurrence of saturation at exchange capacity of 100% of the CEC by the natural clay. The variation in average pore diameters results from the alteration of the basal spacing
caused by the modiication with CTAB salt.65
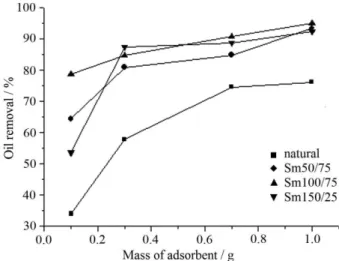
Oil adsorption study
Figure 4 shows the capacities for adsorption of oil from the contaminated saltwater for each of the adsorbents. In these tests, we used an initial oil concentration of 50 ppm and different adsorbent masses (0.1, 0.3, 0.7 or 1.0 g), at a temperature of 25 °C, rotation speed of 100 rpm and time of 240 min. The results show that the organophilic clays were better at removing oil than the untreated clay. This can be explained by the fact that organophilization enables the adsorption of organic compounds such as petroleum. Figure 4 also shows that the oil removal increased with rising adsorbent mass, and the best results were obtained with 1.0 g of the adsorbent. The oil removal rates with 1.0 g of adsorbent for all the samples are shown in Table 4. It can be seen that the removal rates of the three organophilic clays are very close to each other, with a small reduction Figure 3. Infrared spectra of the natural and organophilic clay samples.
Table 3. Surface area and average pore diameter
Sample Surface area / (m2 g-1) Pore diameter / nm
Natural 27.8 1.53
Sm50/75 2.85 13.04
Sm100/75 1.83 13.18
for sample Sm150/25. This is related to the smaller average pore diameter and smaller surface area, as shown in Table 3. The performance of the organophilic clays is even better than or comparable to other methods or adsorbents types. For example, the eficiency cited in literature is 90, 90, 93, 78, 86.58, and 93.54%, respectively, for catalytic
oxidation,72 biological techniques,73 membranes,74 wool,75
zeolite,38 and activated coal.6
To determine the adsorption equilibrium time, the oil absorption percentages were studied in function of contact time, which varied from 15 to 240 min, using 1.0 g of adsorbent and oil concentration in the saltwater of 50 ppm. The results are depicted in Figure 5. The percentage of oil removed increased with longer contact time. This behavior was more accentuated early in the process, and then became slower as time progressed. This can be explained by the fact that the number of voids available for adsorption declines as time progresses, so the oil removal capacity also diminishes.
Figure 5 shows that the adsorption equilibrium times of samples Sm50/75, Sm100/75 and Sm150/25 were 30, 180 and 120 min, respectively; while for the natural clay the balance was reached at 180 minutes. The quantity of oil removed by the organophilic clays was greater than for the untreated clay after all the contact times, evidencing that organophilic clay obtained by treatment with CTAB is effective for oil removal.
Conclusions
The characterization of the clay samples conirmed effective modiication, based on the good oil removal rates of the organophilic clay samples. The XRD revealed a signiicant increase in the basal spacing of the modiied clays in relation to the natural clay, evidencing the intercalation of the CTAB salt in the interlamellar structure of the clay and that this salt can accommodate different forms in the interlamellar region, enabling
variation of the d001 basal spacing. The appearance
of bands corresponding to the CH2 and CH3 supplied
by the quaternary ammonium salt (FTIR spectra), the greater mass loss in the region corresponding to organic compounds (TG) and the reduced surface area and average pore diameters of the organophilic clays conirmed the presence of the surfactant CTAB and thus the organophilization of the clay.
The organophilic clays were better at removing oil than the untreated clay, with rates of 93.45, 94.98 and 92.40% for samples Sm50/75, Sm100/75 and Sm150/25, respectively. Even the untreated clay was relatively effective in removing oil (76.16%). All told, the results indicate the outstanding potential of the smectite clay studied in removing oil from contaminated efluents, especially after organophilization, with the added advantage of low cost of the clay due to its plentiful availability.
Acknowledgments
We thank the Labs Analysis and Research of Food, Beverage and Environmental (IFMA); the Analytical Materials Center and the Analytical Center (UFMA); to the Nucleus of Catalysis (UFRJ) and to the Interdisciplinary Laboratory for Advanced Materials (UFPI), for conducting Table 4. Oil percentages removed with 1 g of adsorbent after contact
for 240 min
Sample Natural Sm50/75 Sm100/75 Sm150/25
Oil removed / % 76.16 93.45 94.98 92.40
Figure 4. Oil removal capacity with different adsorbent masses. Conditions: 50 ppm of oil, 25 ºC, rotation of 100 rpm, contact time of 240 min.
the analyses. E. F. Lucas thanks CNPq, FAPERJ and Petrobras.
References
1. Scanlon, J.; J. Hazard. Mater. 2001, 86, 121.
2. Pottmaier, D.; Melo, C. R.; Sartor, M. N.; Kuester, S.; Amadio, T. M.; Fernandes, C. A. H.; Marinha, D.; Alarcon, O. E.;
Renewable Sustainable Energy Rev.2013, 19, 678.
3. Karhu, M.; Kuokkanen,T.; Rämö, J.; Mikola M.; Tanskanen, J.; J. Environ. Manage.2013, 128, 413.
4. https://www.iea.org/oilmarketreport/omrpublic/, accessed in May 2016.
5. Fakhru’l-Razi, A.; Pendashteh, A.; Abdullah, L. C.; Biak, D. R. A.; Madaeni, S. S.; Abidin, Z. Z.; J. Hazard. Mater. 2009,
170, 530.
6. Okiel, K.; El-Sayed, M.; El-Kady, M. Y.; Egypt. J. Pet. 2011,
20, 9.
7. https://www.epa.gov/oil-spills-prevention-and-preparedness-regulations, accessed in May 2015.
8. Wake, H.; Estuarine, Coastal Shelf Sci. 2005, 62, 131. 9. Alfaro, M. A. Q.; Ferro, S.; Martínez-Huitle, C. A.; Vong, Y.
M.; J. Braz. Chem. Soc.2006, 2, 227.
10. Guerra, D. L.; Santos, M. R. M. C.; Airoldi, C.; J. Braz. Chem. Soc.2009, 4, 594.
11. Diya’uddeen, B. H.; Daud, W. M. A. W.; Aziz, A. R. A.; Process Saf. Environ. Prot. 2011, 89, 95.
12. Guimarães, J. R.; Gasparini, N. C.; Maniero, M. G.; Mendes, C. G. N.; J. Braz. Chem. Soc.2012, 9, 1680.
13. Moazed, H.; Viraraghavan, T.; J. Can. Pet. Technol. 2001, 40,
37.
14. Ko, C. H.; Fan, C.; Chiang, P. N.; Wang, M. K.; Lin, K. C.; J. Hazard. Mater. 2007, 149, 275.
15. Aivalioti, M.; Papoulias, P.; Kousaiti, A.; Gidarakos, E.; J. Hazard. Mater. 2012, 207-208, 117.
16. Nourmoradi, H.; Nikaeen, M.; Khiadani, H. M.; Chem. Eng. J.
2012, 191, 341.
17. Silva, C. M. F.; Barros, C. C.; Queirós, Y. G. C.; Marques, L. R. S.; Louvisse, A. M. T.; Lucas, E. F.; Chem. Chem. Technol.
2012, 6, 415.
18. Sharma, A. K.; Lee, B.; J. Environ. Manage.2013, 128, 787. 19. Simplicio, S.; Santa Maria, L. C.; Costa, M. A. S.; Lucas, E.
F.; Queirós, Y. G. C.; Marques, L. R. S.; Costa L. C.; Hui, W. S.; Silva, M. R.; Polímeros2013, 23, 590.
20. Aversa, T. M.; Queirós, Y. G. C.; Lucas, E. F.; Polímeros 2014,
24, 45.
21. Li, D.; Kaplan, D. I.; Knox, A. S.; Crapse, K. P.; Diprete, D. P.;
J. Environ. Radioact. 2014, 136, 56.
22. Silva, C. M. F.; Rocha, Q. C.; Rocha, P. C.; Louvisse, A. M. T.; Lucas, E. F.; J. Environ. Manage.2015, 157, 205.
23. Churchmann, G. J.; Appl. Clay Sci. 2001, 21, 177.
24. Mansur, C. R. E.; Oliveira, R. S.; Akeda, V.; Queirós, Y. G. C.; Spinelli, L. S.; Lucas, E. F.; J. Appl. Polym. Sci. 2012, 123,
218.
25. Alther, G.; Filtr. Sep.2008, 45, 22.
26. Chen, X.; Hong, L.; Xu, Y.; Ong, Z. W.; ACS Appl. Mater. Interfaces 2012, 4, 1909.
27. Sidik, S. M.; Jalil, A. A.; Triwahyono, S.; Adam, S. H.; Satar, M. A. H.; Hameed, B. H.; Chem. Eng. J.2012, 203, 9.
28. Ahmaruzzaman, M. D.; Adv. Colloid Interface Sci. 2008, 143, 48.
29. Paiva, L. B.; Morales, A. R.; Valenzuela-Diaz, F. R.; Appl. Clay Sci.2008, 42, 8.
30. Espantaleón, A. G.; Nieto, J. A.; Fernández, M.; Marsal, A.;
Appl. Clay Sci. 2003, 24, 105.
31. Ijagbemi, C. O.; Baek, M. H.; Kim, D. S.; J. Hazard. Mater.
2009, 166, 538.
32. Moazed, H.; Viraraghavan, T.; Energy Sources, Part A 2005,
27, 101.
33. Costa Filho, A. P.; Gomes, A. S.; Lucas, E. F.; Polímeros2005,
15, 212.
34. Mirmohamadsadeghi, S.; Kaghazchi, T.; Soleimani, M.; Asasian, N.; Appl. Clay Sci. 2012, 59-60, 8.
35. Odom, I. E.; Philos. Trans. R. Soc., A1984, 311,391. 36. Murray, H. H.; Appl. Clay Sci.2000, 17, 207.
37. Silva, A. R. V.; Ferreira H. C.; Revista Eletrônica de Materiais e Processos2008, 3, 26.
38. Barbosa, R.; Morais, D. D. S.; Araújo, E. M.; Mélo, T. J. A.;
Cerâmica 2012, 58, 495.
39. Rodrigues, M. G. F.; Cerâmica 2008, 49, 152.
40. Coelho, A. C. V.; Santos, P. S.; Quim. Nova2007,30, 146.
41. Menezes, R. R.; Ávila Jr, M. M.; Santana, L. N. L.; Neves, G. A.; Ferreira, H. C.; Cerâmica 2008, 54, 152.
42. Iturri, L. A.; Buschiazzo, D. E.; Catena2014, 121, 81. 43. Hongping, H.; Lingya, M.; Jianxi, Z.; Ray, L. F.; Benny, K. G.
T.; Faïza, B.; Appl. Clay Sci.2014, 100, 22.
44. Chatterjee, A.; Ebina, T.; Onodera, Y.; Mizukami, F.; J. Chem. Phys. 2004, 120, 3414.
45. Cerri, G.; Langella, A.; Pansini, M.; Cappelletti, P.; Clays Clay Miner. 2002, 50, 127.
46. Su-Lin, H.; Juang R.-S.; J. Environ. Manage. 2009, 90, 1336.
47. Jincheng, W.; Xiaoyu, Z.; Wenli, H.; Nan, X.; Xingchen, P.;
Powder Technol. 2012, 221, 80.
48. Mehlich, A.; Soil Sci. 1948, 66, 429.
49. Brunauer, S.; Emmett, P. H.; Taylor, E.; J. Am. Chem. Soc.1938,
60, 309.
50. Barret, E. P.; Joyner, L .G.; Halenda, P. P.; J. Am. Chem. Soc.
1951, 73, 373.
51. Santos, P. S.; Ciências e Tecnologias das Argilas, 2a ed., vol. 3;
Edgard Blucher: São Paulo, Brazil, 1992.
53. Carvalho, M. N.; Motta, M.; Benachour, M.; Sales, D. C. S.; Abreu, C. A. M.; J. Hazard. Mater. 2012, 239-240, 95.
54. Villar, M. V.; Gómez-Espina, R.; Gutiérrez-Nebot, L.; Appl. Clay Sci. 2012, 65–66, 95.
55. Odom, I. E.; Philos. Trans. R. Soc., A1984, 311, 391. 56. Nilgün, Y.; Cengiz, B.; Mü erref, Ö.; Yüksel, S.; Appl. Surf. Sci.
2012, 258, 2534.
57. Wu, S.; Zhang, Z.; Wang, Y.; Liao, L.; Zhang, J.; Mater. Res. Bull. 2014, 59, 59.
58. Lopes, C. W.; Penha, F. G.; Braga, R. M.; Melo, D. M. A.; Pergher, S. B. C.; Petkowicz, D. I.; Quim. Nova 2011, 34, 1152. 59. Yu, W. H.; Ren, Q. Q.; Tong, D. S.; Zhou, C. H.; Wang, H.;
Appl. Clay Sci. 2014, 97-98, 222.
60. Delbem, M. F.; Valera, T. S.; Valenzuela-Diaz, F. R.; Demarquette, N. R.; Quim. Nova 2010, 33, 309.
61. Zhengwen, H.; Gaohong, H.; Yuanfa, L.; Chunxu, D.; Xuemei, W.; Wei, Z.; Appl. Clay Sci.2013, 75–76, 134.
62. Wei, H. Y.; Qian, Q. R.; Dong, S. T.; Chun, H. Z.; Wang, H.;
Appl. Surf. Sci. 2014, 97-98, 222.
63. Gammoudi, S.; Frini-Srasra, N.; Srasra, E.; Appl. Clay Sci.
2012, 69, 99.
64. Zhou, Y.; Jin, X. Y.; Lin, H.; Chen, Z. L.; Chem. Eng. J. 2011,
166, 176.
65. Gámiz, B.; Celis, R.; Hermosín, M. C.; Cornejo, J.; Johnston, C. T.; Appl. Clay Sci. 2012, 58, 8.
66. Scholtzová, E.; Tunega, D.; Madejová, J.; Pálková, H.; Komadel, P.; Vib. Spectrosc.2013, 66, 123.
67. Silverstein, R.; Webster, F. X.; Kiemle, D.; Silverstein, R. M.;
Spectrometric Identification of Organic Compounds, 7th ed.;
Wiley: New York, USA, 2005.
68. Xi, Y.; Martens, W.; He, H.; Frost, R. L.; J. Therm. Anal. Calorim. 2005, 81, 91.
69. Lv, G.; Chang, P. H.; Xing, X.; Jiang, W. T.; Jean, J. S.; Li, Z.;
Arab. J. Chem. in press. DOI: 10.1016/j.arabjc.2015.04.016. 70. Vazquez, A.; López, M.; Kortaberria, G.; Martín, L.;
Mondragon, I.; Appl. Clay Sci. 2008, 41, 24.
71. Mrad, I.; Ghorbel, A.; Tichit, D.; Lambert, J. F.; Appl. Clay Sci.
1997, 12, 349.
72. Adams, M.; Campbell, I.; Robertson, P. K. J.; Int. J. Photoenergy
2008, 2008, 1.
73. Jou, C. J. G.; Huang, G. C.; Adv. Environ. Res.2003, 7, 463.
74. Rahman, M. M.; Al-Malack, M. H.; Desalination2006, 191, 16.
75. Rajakovic, V.; Aleksic, G.; Radetic, M.; Rajakovic, L.;
J. Hazard. Mater.2007, 143, 494.