ISSN 0104-6632 Printed in Brazil
www.abeq.org.br/bjche
Vol. 23, No. 04, pp. 531 - 538, October - December, 2006
BrazilianJournal
of Chemical
Engineering
THE THERMAL DECOMPOSITION OF
MONOHYDRATED AMMONIUM
OXOTRIS(OXALATE)NIOBATE
F. F. P. Medeiros
1, M. F. V. Moura
2, A. G. P da Silva
3,
C. P. Souza
1,
K. K. P. Gomes
1and U. U. Gomes
21,2
Universidade Federal Rio Grande do Norte, CT, DEQ1 / CCET/DFTE2 , Campus Universitário, Phone: +(55) (84) 3215-3769/Fax: 3215-3770, CEP 59072-970, Natal - RN, Brazil.
E-mail: [email protected]
3
Universidade Estadual do Norte Fluminense, LAMAV, CEP: 28015-620, Campos - RJ, Brazil.
(Received: February 13, 2003 ; Accepted: July 17, 2006)
Abstract - The thermal decomposition in argon of the monohydrated ammonium tris(oxalate)niobate, (NH4)3NbO(C2O4)3.H2O, has been studied by TG/DTG, DTA, DSC, IR absorption and XRD. The material
decomposes stepwise by the release of CO, CO2, NH3 and water. The atomic structure of the complex initially
becomes amorphous and then crystallizes twice in the form of orthorhombic and monoclinic niobium pentoxide.
Keywords: Thermal decomposition; Thermal analysis; Infrared; Niobium complex.
INTRODUCTION
The oxalate ion is a bidentate, chelate ligand that can form complexes with niobium (Cotton and Wilkinson, 1982). The niobium complexes are named according to the number of oxalate groups that bonds to the niobium ion. These complexes can be obtained with the dissolution of hydrated niobium oxide in an aqueous oxalic acid solution, followed by a treatment with a suitable salt. The first niobium complexes were obtained from the alkali metals and were named mono, bus and tris(oxalate) niobate (Khrishnamurty and Harris, 1961).
Mathern et al. (1969), determined the structure of monohydrated ammonium oxotris(oxalate) niobate. Its formula is (NH4)3NbO(C2O4)3.H2O. Niobium is
seven coordinated (to three oxalate groups and to oxygen), forming a pentagonal bipyramid.
Monohydrated ammonium oxotris(oxalate)niobate and monohydrated ammonium oxotris(oxalate)tantalate
have been used for synthesizing NbC and TaC, respectively, at low temperatures (between 950°C and 1050°C) through a gas-solid reaction (Medeiros et al., 2002; Ciaravino et al., 2002). The gaseous reactant is a mixture of CH4 and H2. Methane is the
carbon source. Hydrogen avoids the precipitation of free carbon caused by the cracking of CH4 (Clar,
1964) and acts as a reducer. The solid reactant is the Nb or Ta complex. The cracks and pores that appear during the thermal decomposition of the complexes increase its specific surface area and its reactivity (Medeiros et. al., 2002) The conventional method utilized for producing these carbides uses temperatures as high as 1800°C (Toth, 1971; Storms, 1971).
532 F. F. P. Medeiros, M. F. V. Moura, A. G. P. Silva,C. P. Souza, K. K. P. Gomes and U. U. Gomes EXPERIMENTAL
Synthesis of the Complex
Niobium pentoxide (Nb2O5) is mixed with
sodium hydrogen sulfate (KHSO4) at a 1:7 weight
ratio. The mixture is heated to melting in a platinum crucible. After cooling, the material is crushed and washed in a 1:1 HCl aqueous solution during 24 hours to remove impurities. Subsequently, the material is filtered and washed with hot water. Hydrated niobium oxide is formed. This oxide is added to a solution of oxalic acid and ammonium oxalate (1:1 molar ratio) and the solution is slowly evaporated. The complex precipitates and is dried at 70°C for 24 hours. The granulated material is further powdered in a mortar.
Decomposition Study
The thermal decomposition was studied by means of a combination of techniques described as follows:
Thermogravimetry (TG/DTG) (Shimadzu
TGA-50 thermobalance) in an argon atmosphere. Two temperature programs were used. In the first case, the temperature rises continuously from room temperature (RT) to 900°C at a rate of 5°C/min. In the second case, the temperature range is RT – 630°C, the heating rate is 5°C/min. and there are isotherms of 20 minutes at 140°, 200°, 250° and 620°C.
Differential thermal analysis (DTA) (Netzsch
STA 409C) in argon in the temperature range RT – 950°C and at a heating rate of 5°C/min.
Differential scanning calorimetry (DSC) (DSC-50 Shimadzu) in argon in the temperature range RT – 600°C and at a heating rate of 2°C/min.
C, N and H quantitative elemental analysis of the niobium complex (Perkin Elmer CHN 2400).
X-Ray diffraction (XRD) (Siemens diffractometer, Cu Kα radiation) of Nb2O5, the niobium complex
and the residue of the niobium complex decomposed at 200°, 400°, 700° and 950°C.
Infrared spectroscopy (Perkin Elmer FTIR 16PC) using KBr tablets of Nb2O5, the niobium complex
and its residue after decomposition at 140°, 200°, 250°, 400°, 630°, 700° and 950°C.
Detection of NH3 and CO2 released during
decomposition by traps installed according to Fig. 1.
RESULTS AND DISCUSSION
Thermal Analysis
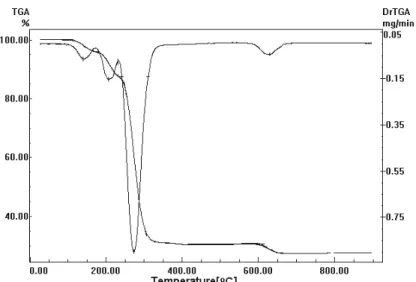
Figures 2-5 show the results of TG/DTG, DTA and DSC of the decomposing niobium complex. The TG/DTG curves (Figs 2-3) show four temperature range in which the sample loses mass. The DTA and DSC curves (Figs. 4-5) show that each mass loss event corresponds to a peak of DTA and DSC. Table 1 summarizes the results shown in Figs. 2-5.
Figure 1: Outline of the apparatus utilized to detect CO2 and NH3
Figure 2: TG/DTG curves of the thermal decomposition in argon of the niobium complex. Heating rate: 5°C/min.
Figure 3: TG/DTG curves of the thermal decomposition in argon of the niobium complex. Temperature increases stepwise.
534 F. F. P. Medeiros, M. F. V. Moura, A. G. P. Silva,C. P. Souza, K. K. P. Gomes and U. U. Gomes
Figure 5: DSC curve of the thermal decomposition in argon of the niobium complex. Heating rate: 2°C/min.
Table 1: Summary of the TG/DTG, DTA and DSC techniques for the decomposition of the niobium complex.
Decomposition Step
Technique Characteristics of
the Event 1 2 3 4
Initial Temperature 98°C 181°C 244°C 600°C
Final Temperature 145°C 223°C 301°C 630°C
Temperature of
Max. Intensity 135°C 207°C 261°C 617°C
TG/DTG
Mass Variation % 4.3 8.4 57.30 3.02
DTA Characteristic of the
Peak endo endo endo exo
Initial Temperature 98°C 172°C 217°C 533°C
Final Temperature 137°C 191°C 268°C 600°C
Temperature of
Max. Intensity 120°C 186°C 233°C 580°C
DSC
Variation Enthalpy
in (KJ/mol) 42.02 47.70 18.15 --
Release of Gas Phase
The releasing of both CO2 and NH3 was
detected by the traps in the temperature intervals corresponding to the second and third mass loss events (Table 1), related to endothermal peaks on the DTA curve. Production of CO2 is also detected
around 600°C, corresponding to the forth event (an exothermal DTA peak). Marta et al. (1983) related the releasing of this gas to the desorption of some of the CO2 produced at a lower temperature and
adsorbed on the surface of the material. But
desorption events are endothermic. Other possibilities for this CO2 release are: (1) the
oxidation of pyrolytically formed carbon by traces of oxygen in the atmosphere and (2) an event related to the decomposition of the niobium complex.
Figure 6 shows the IR spectra of the niobium complex and its residues after decomposition at several temperatures. The spectrum of the initial Nb2O5 is also shown. Table 2 summarizes the results
Figure 6: IR absorption spectra of the niobium complex (precursor), the complex decomposed at 140°, 200°, 250°, 400°, 600°, 700° and 950°C and the niobium oxide used as raw material.
Table 2: Absorption bands of the niobium complex and its residue after decomposition at several temperatures. The types of vibration related to the respective bands are shown.
Decomposition Temperature
Niobium
complex 140°C 200°C 250°C 400°C 630°C 700°C 950°C
Type of Vibration Absorption Bands (cm-1)
N-H 3539 3539 3538 -- -- -- -- --
H-O
3442 3212
3442 3212
3442
3199 3126 -- -- -- --
ν (C=O) 1714
1683
1714 1683
1711
1683 1722 1621 1621 -- --
ν (C=O), ν (C-C) 1387 1387 1389 1396 -- -- -- --
ν (C-O), δ (O-C=C) 1241 1241 1239 1243 -- -- -- --
ν (Nb=O) 889 889 886 -- -- -- -- --
δ (O-C=O) 793 793 790 720 -- -- -- --
ν (C-C), δ (O-C=O) 538 538 534 -- -- -- -- --
δ (O-C=O) +, ν (Nb-O) 479 479 479 479 -- -- -- --
ν (Nb-O) -- -- -- -- 540 540 540
807
536 F. F. P. Medeiros, M. F. V. Moura, A. G. P. Silva,C. P. Souza, K. K. P. Gomes and U. U. Gomes It can be seen that the absorption band related to
N-H is detected only in residues decomposed up to 200°C. This corresponds to the release of the oxalate ions contained in the complex through the releasing of NH3 up to 250°C. The absorption band related to the
hydration water (H-O vibration) is not detected in the residue after decomposition at 400°C. The spectra in Fig. 6 shows that the absorption bands related to the hydration water change significantly above 200°C and vanishes in the residue of decomposition at 400°. This means that the water is released mainly in the third mass loss event, in the range from 240° to300°C.
The absorption bands corresponding to the vibrations C=O, C=C, C-C, O-C=C and O-C=O are related to the oxalate ion. Some other bands are related to the bond between this ion and the niobium atom (Mathern et al., 1969) (Marta et al., 1983; 1979). Most of these bands are not present in the residues of decomposition above 250°C. Combining the results of the IR spectra, TG/DTG and those of the detection of released gases, one concludes that the niobium complex releases the oxalate ions stepwise in the range
from 170° to 300°C. CO2 and CO are released.
Although only CO2 was detected (CO was not
analyzed), the evolution of CO and CO2 is common in
the decomposition of oxalates.
Concerning the evolution of CO2 at around 630°C,
corresponding to the fourth mass loss event detected by the TG/DTG analysis, the IR spectra of the niobium complex that decomposed at 400° and 600°C show a band corresponding to a C=O bond, but a band related to the bond between the oxalate ion and Nb was not detected. This means that the C=O bond is not related to the bond between Nb and the oxalate ion. This result definitively shows that releasing of CO2 at 630°C is not
related to the decomposition of the material.
Crystal Structure
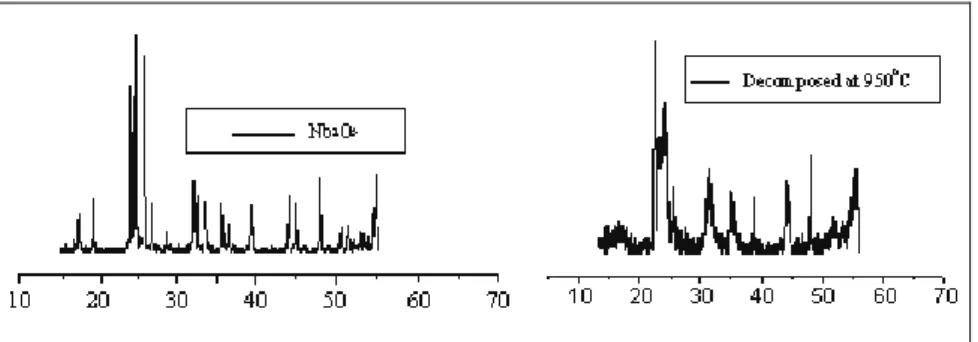
Figure 7 shows the XRD graphs of the niobium complex, its residues after decomposition at several
temperatures and the niobium oxide used as raw material. Negligible differences are seen in the patterns of the niobium complex and its residue after decomposition at 200°C, but the complex that decomposed at 400°C is amorphous, as indicated by the diffraction pattern. The release of CO2 and NH3
that occurred in the second mass loss step (180°-220°C) does not disturb the crystal structure of the niobium complex, but the massive release of NH3,
CO2 and the hydration water does transform the
material into amorphous solids.
The exothermic peak at 600°C in the DTA analysis could be related to crystallization of the material and not to the release of CO2 as mentioned previous. The
residue of the niobium complex decomposed at 700°C is crystalline, corresponding to an orthorhombic structure of Nb2O5 (JCPDS card No. 30-0873). This
crystallization process could occur or start at 600°C. The orthorhombic structure is transformed into amonoclinic structure between 700° and 950°C because the residue of the decomposition at 950°C has another crystal structure (JCPDS card No. 37-1468). This is the same structure as that of the Nb2O5 used as
raw material, but it is not as well crystallized.
Elemental Analysis
Nitrogen, hydrogen and carbon in the niobium complex were quantitatively analyzed. Niobium was indirectly analyzed. The residual mass of the niobium complex after calcination in air at a high temperature was measured and the Nb content was calculated, considering that the calcination product is Nb2O5. The water content is determined by the mass
balance. The results are shown in Table 3, together with a simulation in which the niobium complex formula is assumed to be (NH4)3NbO(C2O4)3.H2O.
Figure 7: XRD patterns of the niobium complex (precursor), the complex decomposed at 200°, 400°, 700° and 950°C and the niobium oxide used as raw material.
Table 3: Quantitative analysis of Nb, C, N, H and H2O in the niobium complex and simulation based on
the formula (NH4)3NbO(C2O4)3.H2O.
Quantities
(weight %) Nb C N H H2O
Measurement 19.4 16.2 9.4 3.2 4.0
Simulation 19.3 16.6 9.7 3.2 4.0
CONCLUSIONS
During heating, the complex monohydrated ammonium oxotris(oxalatE)niobate [(NH4)3NbO(C2O4)3.H2O]
decomposes, releasing stepwise the oxalate ions, NH4
+
and the hydration water in the form of CO2 and
CO, NH3 and water vapor. Transformations also
occur in the atomic structure of the material.
From 98° to 145°C, the humidity evaporates. In the range from 180° to 220°C, there is releasing of NH3 and CO2, corresponding to the partial release of
the NH4 +
and oxalate ions. The crystal structure of the niobium complex is not altered up to this temperature. Between 240° and 300°C, there is an intense loss of mass, corresponding to the evolution of NH3, CO2, CO and the hydration water. The
crystal structure collapses and becomes amorphous. All NH4
+
ions and the hydration water are released. At around 600°, there is an evolution of the residual carbon in the form of CO2. In the same temperature
range, the material crystallizes as orthorhombic Nb2O5.
At higher temperatures, but below 950°C, the structure is transformed into the monoclinic Nb2O5.
ACKNOWLEDGEMENTS
We are grateful to CNPq.
REFERENCES
Ciaravino, C., Medeiros, F.F.P., Souza, C.P., Satre, P. and Roubin, M., Elaboration of Mixed Tantalum and Niobium Carbides from Tantalite Mineral. J. of Materials Science. 37(10), pp.2117-2123 (2002).
538 F. F. P. Medeiros, M. F. V. Moura, A. G. P. Silva,C. P. Souza, K. K. P. Gomes and U. U. Gomes Cotton, F.A. and Wilkinson, G., Química Inorgânica,
LTC, São Paulo, p.118 (1982).
Khrishnamurty, K.V. and Harris, G.M., The Chemistry of Metal Oxalates Complexes. Chem. Rev, 61, 3, pp. 213-246 (1961).
Marta, L., Zaharescu, M. and Macarovici, C.G., Thermal and Structural Investigation of Some Oxalates-Niobium Complexes 3. Strontium Tris(oxalate)oxoniobate. J. Thermal Analysis, 26, p. 87 (1983).
Marta, L., Zaharescu, M. and Macarovici, C.G., Thermal and Structural Investigation of Some Oxalate-niobium Complexes, Potassium Tris(oxalate)oxoniobate. Revue Roumains de Chimie, 24, 8, p.1115 (1979).
Mathern, G., Weiss R. and Rohmer, R., The Crystal Structures of Ammonium Oxotrioxalatoniobate
Monohydrate and Ammonium Diperoxodioxalatoniobate Monohydrate. Chem.
Comm., 70 (1969).
Medeiros, F.F.P., Silva, A.G.P. and Souza, C.P., Synthesis of Niobium Carbide at Low Temperature and Its Use in Hardmetal. Powder Technology 126, pp. 155-160 (2002).
Storms, E.K., Refractory Carbides – A Series of Monographs. Vol. II, Academic Press, New York and London, p. 61, 82 (1971).