Article
Printed in Brazil - ©2016 Sociedade Brasileira de Química0103 - 5053 $6.00+0.00
*e-mail: [email protected]
Iridium Catalysts for C–C and C–O Hydrogenolysis: Catalytic Consequences of
Iridium Sites
Aracelis J. Pamphile-Adrián, Pedro P. Florez-Rodriguez and Fabio B. Passos*
Departamento de Engenharia Química e de Petróleo, Universidade Federal Fluminense, Rua Passos da Pátria, 156, 24210-040 Niterói-RJ, Brazil
The support effect on the properties of iridium catalysts for C–C and C–O hydrogenolysis was investigated. Cyclohexane conversion and glycerol hydrogenolysis were used to compare the behavior of iridium catalysts in terms of C–C and C–O cleavage. The nature of the support influenced the catalyst performance in both cyclohexane conversion and glycerol hydrogenolysis. This effect was more evident on the product selectivity. Ir/SiO2 catalyst presented the highest
cyclohexane hydrogenolysis activity and the highest selectivity to minor hydrocarbons formed from hexane re-adsorption. For glycerol hydrogenolysis, all catalysts displayed a higher selectivity to products formed by C–O cleavage, mainly 1,2-propanediol (1,2-PDO). Ir/ZrO2 catalyst presented
the highest activity in all reaction conditions and the lowest selectivity to minor alcohols produced by C–C cleavage like methanol, ethanol and ethylene glycol. The results were explained in terms of the requirements and the structure of the catalytic sites.
Keywords: iridium catalysts, hydrogenolysis, C–C cleavage, C–O cleavage, support effect
Introduction
Iridium catalysts have been tested for several reactions like isomerization,1,2 hydrogenation,3-6 hydrazine decomposition and several authors reported their high activity for hydrocarbon hydrogenolysis reactions.7-12 For example, McVicker et al.12 studied the selective rupture of naphthenic rings (methylcyclopentane (MCP), methylcyclohexane (MCH), 1,1-, 1,2- and dimethylcyclopentane (1,1-DMCP, 1,2-DMCP and 1,3-DMCP), pentylcyclopentane (PCP) and ethylcyclopentane (ECP)) on Pt/SiO2, Pt/Al2O3, Ni/Al2O3, Ru/Al2O3, Rh/Al2O3 and Ir/Al2O3. Among the mentioned catalysts, Ir/Al2O3 presented the best activity and selectivity for cleavage of non-substituted C–C in five-membered naphthenic rings as MCH and PCP.12
Cyclohexane, a model six-membered naphthenic molecule, has been used to study the direct endocyclic C–C bond cleavage.13,14 Additionally, conversion of cyclohexane is typically used to probe the catalyst surface properties such as apparent dispersion (dehydrogenation to benzene) and surface structure (hydrogenolysis).15-20
Several studies of cyclohexane conversion on Ir catalysts were performed to understand the dependence
of cyclohexane hydrogenolysis activity and reaction mechanism on factors like dispersion, particle size and H2/cyclohexane ratio.13,14,21 Locatelli et al.21 investigated cyclohexane hydrogenolysis over Ir/SiO2 and proposed a reaction mechanism in which the key step is a concerted electronic transfer in a dimetallacyclopentane intermediate. Thus, after hexane formation subsequent hydrogenolysis steps define the minor hydrocarbons that are formed.
On the other hand, less attention have been paid to fundamental investigation of C–O hydrogenolysis over Ir catalysts. Ir-ReOx/SiO2 are active in C–O hydrogenolysis of substrates like glycerol, tetrahydrofurfuryl alcohol, tetrahydrofuran and tetrahydropyran.22-26 Among these substrates, glycerol is a versatile feedstock that is mainly obtained as a by-product of biodiesel production. Consequently, due to the fast growth of biodiesel production worldwide, catalytic transformation of glycerol into high-value products has gained importance in the last decade.
Glycerol hydrogenolysis may yield 1,2- and 1,3-propanediol (1,2-PDO and 1,3-PDO), high-value raw materials for the chemical industry.27 The formation of these and other alcohols requires one or more C–O cleavages, and particularly, 1,3-PDO is difficult to obtain due to the difficult cleavage of the secondary C–O bond.
as H2SO4, silica-alumina, zeolites and ion-exchange resin promoted the activity of the catalyst.24 According to these authors, the mechanism of glycerol hydrogenolysis to 1,3-propanediol occurs through attack of hydride species at the interface between Ir metal surface and ReOx to the adsorbed glycerol on the ReOx cluster.23
In this work, we report cyclohexane conversion and glycerol hydrogenolysis over iridium catalysts supported on γ-Al2O3, SiO2 and ZrO2, comparing these catalysts in terms of C–C and C–O cleavage. We also address the effect of support on the activity and product selectivity in both reactions. This study contributes to a better understanding of the catalytic consequences for both reactions of modification of Ir catalytic sites.
Experimental
Catalyst preparation
Commercial γ-Al2O3 (Puralox HP-14) and SiO2 (DAVICAT), used as catalyst supports, were calcined at 600 and 900 °C, respectively, during 4 h (5 °C min-1). ZrO
2 was synthesized by precipitation of Zr(OH)4. NH4OH (25% v/v) was added to an aqueous solution of ZrO(NO3)2·xH2O until a pH equal to 14 was reached. The precipitated solid was filtered, washed with deionized water and dried overnight at 100 °C. The prepared Zr(OH)4 was calcined at 500 °C during 4 h (5 °C min-1). The calcination temperatures were chosen to obtain similar surface areas of the supports. The catalysts were prepared by incipient wetness impregnation technique using a solution of H2IrCl6·xH2O (Sigma-Aldrich) to yield 2 wt.% Ir. The impregnated solids were dried at 70 °C for 16 h due to the low melting point of H2IrCl6·xH2O (65 °C). Finally, the catalysts were calcined at 400 °C during 4 h (5 °C min-1).
Catalyst characterization
Nitrogen adsorption isotherms of the samples were measured using a Micromeritics ASAP 2020 equipment. Surface areas were calculated using the Brunauer-Emmett-Teller (BET) equation. X-Ray diffraction (XRD) experiments were performed using a Miniflex RIGAKU spectrometer (Cu Kα radiation). The diffractograms were obtained between 2θ = 10 and 80° using a 0.04° step size (1 s per step).
Temperature programmed reduction (TPR), H2 pulse chemisorption and temperature programmed desorption (H2-TPD) experiments were performed with a multipurpose unit coupled to a Prisma quadrupole mass spectrometer (Pfeiffer). For TPR analysis, the samples were dried at
150 °C for 30 min under He flow (30 mL min-1) and cooled to room temperature. Then, the samples were submitted to a 5% H2/Ar gas flow (30 mL min-1) and the temperature was raised to 1000 °C at a heating rate of 10 °C min-1. For H2-TPD experiments, the samples were dried as mentioned before and were reduced at 250 °C. After reduction, a He stream (30 mL min-1) was passed through the catalyst during 30 min at the reduction temperature and then cooled to 27 °C. H2 pulses from a 100 µL loop were injected in a He stream (30 mL min-1) until the area of the pulses remained constant, indicating saturation of the catalyst surface. Then, the temperature was increased to 1000 °C at a heating rate of 10 °C min-1, under He flow, while H
2 desorption was monitored.
X-Ray photoelectron spectroscopy (XPS) analysis was carried out using an ESCALAB 250Xi spectrometer (Thermo Fisher Scientific) with monochromatic Al Kα X-rays (spot size of 900 µm). Surface charging of the electrically insulating materials was compensated using the integrated flood gun with approximate spot size of 900 µm. Survey spectra were obtained with a pass energy of 100 eV and region spectra (Ir4f, Al2p, Si2p, Zr3d) using a pass energy of 58 eV. The base pressure of the analysis chamber was 7 × 10⁻¹⁰ mbar. Spectra were acquired, analyzed and peak fitted using the Avantage software with Lorentzian/Gaussian product function and a Shirley type background. Ir4f spectra were fitted with an energy constraint for Ir4f5/2 within a 3 eV shift relative to the Ir4f7/2 peak, an area ratio of 0.75:1, respectively, and a full width at half maximum (FWHM) in the range 0.5-2.5 eV. The residual standard deviation of the fitted Ir4f spectra was around 0.9 for all catalysts.
Fresh and used catalysts were characterized by Raman spectroscopy with a WITec alpha 300 system. Experiments were performed at 25 °C using 50× objective lens (numerical aperture = 0.75) and a Nd:YAG green laser with 532 nm wavelength with an aperture of 800 cts to avoid the decomposition of possible organic compounds in the sample. The integration time was 0.777 s and the number of scans was 600.
Cyclohexane conversion
The reaction system was gradually heated and samples were collected at 250, 260, 270, 280, 290, 300 and 310 °C. A descending temperature sequence was also performed to detect any deactivation. The reaction products were analysed in a gas chromatograph (GC) HP GC-5890 Series II, equipped with an HP-Innowax capillary column and a flame ionization detector. The products were also analysed in a Micro-GC 490 (Agilent), equipped with three columns: M5A for permanent gases (H2, O2, N2, CH4 and CO), 5CB for hydrocarbons (C3-C6) and PPU for CO2 and ethane.
The conversion was kept below 10%, which enabled comparison of the selectivities at similar conversions.16 The selectivity for the hydrogenolysis products was calculated as the ratio between the amount of cyclohexane converted to a hydrogenolysis product and the total amount of reacted cyclohexane, according to the equation below:
0 Selectivity (%) =
6
Hydrogenolysis
i i
A A
j F
F X
×
×100
× (1)
in which ji is the number of carbons in product i, Fi is the exit flow rate of product i, FA0 is the initial flow rate of
cyclohexane and XA
Hydrogenolysis is the cyclohexane conversion
to hydrogenolysis products.
Glycerol hydrogenolysis
Glycerol hydrogenolysis reactions were performed in a 300 mL autoclave reactor (Parr Instruments Co.). The catalyst was reduced in the autoclave prior the reaction. The reactor was loaded with the necessary amount of water and catalyst, and then was filled with H2, with 200 psi of pressure, the stirring speed was adjusted to 500 rpm and the temperature was set to 250 °C. After 2 h, the reactor was cooled to 25 °C, opened, and glycerol was quickly loaded into the reactor. Then, the reactor was filled with the desired pressure of H2, both the stirring speed and pressure were adjusted, and the temperature was set to the desired value. After the reaction time (12 h), the reactor was cooled to room temperature, gas phase was collected and analyzed in the Micro-GC 490. The liquid phase products were quantified in a gas chromatograph-mass spectrometer (GC-MS) QP2010Plus (Shimadzu) equipped with a capillary column (Rtx-Wax). The products were identified using GC-MS Solutions software comparing with the National Institute of Standards and Technology NIST05 and NIST05s libraries. Initial turnover frequency (TOF) values were estimated for each catalyst from the initial reaction rate, assuming a first order reaction, and using H2 chemisorption to estimate the number of surface
iridium sites. Product selectivity was calculated on carbon basis using the following equation:
Selectivity (%) = i i 100
i i
i
j y j y
× × ×
∑
(2)in which ji is the number of carbons of product i and yi is
the molar fraction of product i.
For all reactions, gas phase products (CO, CO2 and CH4) were not considered for calculations, since their selectivities were negligible (< 0.5%).
Results and Discussion
Characterization of catalysts
X-Ray diffractograms of the catalysts (not shown) displayed the respective main peaks of the supports: SiO2, γ-Al2O3 and ZrO2 (tetragonal and monoclinic phases). However, characteristic peaks of iridium species were not observed due to the low iridium content or to a high dispersion of iridium species on the support.28,29
XPS spectra for Ir4f of the calcined catalysts are presented in Figure 1. In the case of the Ir/γ-Al2O3 (Figure 1b), the Ir4f doublet was not resolved, showing a first evidence of the effect of the support on the characteristics of the surface of the catalysts. The presence of two different iridium species on the surface of the catalyst was evidenced by the deconvolution of the Ir4f peaks. The two doublets (including Ir4f5/2 and Ir4f7/2) were identified in Figure 1 as A and B. The doublets identified as A, of lower energy, can be attributed to surface IrO2.30-32 The doublets identified as B in all spectra can be attributed to the presence of surface iridium chloride species (IrCl3 or IrCl4), as reported by Folkesson33 and Kim and Hatfield.34 The presence of these chloride species was observed in the survey spectrum of all catalysts, with spectral lines of Cl2p (200 eV) and Cl2s (270 eV), indicating that after calcination the chloride species remain on the surface of the catalyst. In the case of Ir/ZrO2, the spectrum showed a higher amount of IrCl4 than IrO2, 87 and 13%, respectively (Table 1), which confirms that the calcination of the catalyst was not efficient to completely eliminate the metal precursor.
Surface and bulk Ir/Si, Ir/Al and Ir/Zr atomic ratios are shown in Table 1. The surface to bulk ratio increased in the order Ir/Zr < Ir/Al < Ir/Si, the same order obtained by H2 pulse chemisorption.
the interaction of the metal precursor and the support.35 In all cases, the reduction peaks can be attributed to the reduction of iridium oxide and iridium chloride species with different interactions with the support,4 whose presence was also confirmed by the XPS experiments. In the case of Ir/γ-Al2O3 (Figure 2a), the reduction peak was broader than the reduction peaks of the other two catalysts. The surface areas obtained for all catalysts were within the desired range for this investigation: Ir/ZrO2 (81 m2 g-1), Ir/SiO2 (167 m2 g-1) and Ir/γ-Al2O3 (119 m2 g-1).
Hydrogen chemisorption results are summarized in Table 2. In general, metal dispersion followed the same trend as surface area of the supports, since higher surface areas often lead to higher metal dispersion.36,37 Ir/SiO
2 presented the highest surface area and dispersion among the studied catalysts, but the values were similar to those obtained for Ir/γ-Al2O3. H2 chemisorption uptakes were used to estimate iridium average particle diameters (Table 2), resulting in similar sizes for Ir/γ-Al2O3 and Ir/SiO2 and somewhat larger size for Ir/ZrO2. H2-TPD profiles for the catalysts are presented in Figure 2b. The
TPD profile of Ir/SiO2 showed a broad peak between 50 and 360 °C due to desorption of H2 from different types of active sites present on the catalyst surface, indicating the surface is non-uniform. In the case of Ir/ZrO2, the TPD profile showed two main desorption peaks. The first one, placed at around 100 °C, can be attributed to desorption of H2 from the metal surface, and the second peak can be due to desorption of spillover hydrogen from the support. Finally, the TPD profile of Ir/γ-Al2O3, Figure 2b, showed a main peak around 304 °C, with a shoulder at 220 °C. The peak can be attributed to strongly adsorbed hydrogen on metallic iridium, and the shoulder can be due to weakly adsorbed hydrogen. This profile also presented a peak around 630 °C that is attributed to desorption of spillover hydrogen from the support.38 Comparing the TPD profiles of all catalysts, H2 desorption temperature increased in the sequence Ir/ZrO2 < Ir/SiO2 < Ir/γ-Al2O3, which can
Table 1. XPS results for prepared catalysts
Catalyst
Ir/Ma
Ir4f7/2 (IrO2)
BE / eV At.%
b Ir4f7/2 (IrClx)
BE / eV At.%
b
Bulk Surface Surface× 100
Bulk / %
Ir/SiO2 0.008 0.0056 69.3 61.6 72 63.7 28
Ir/γ-Al2O3 0.004 0.0026 65.3 61.3 60 63.1 40
Ir/ZrO2 0.013 0.0077 58.8 60.3 13 62.1 87
aCalculated from atomic percentages obtained in survey spectra using Ir4f, Si2p, Al2p and Zr3p peaks; M = Si, Al, Zr; bcalculated atomic percentages using respective Ir4f7/2 peaks. BE: binding energy.
Figure 1. XPS spectra of the Ir4f spectral line of iridium catalysts: (a) Ir/SiO2; (b) Ir/γ-Al2O3; (c) Ir/ZrO2. The doublets can be attributed to (A) surface IrO2 or (B) surface IrCl3 or IrCl4.
indicate different binding strength between hydrogen and the metal sites.
Cyclohexane conversion
Cyclohexane conversion results are summarized in Table 2. Although the dehydrogenation reaction rate is often used as an indicator of metal dispersion, the highest dehydrogenation rate was obtained with Ir/ZrO2. This catalyst presented the lowest dispersion as measured by H2 chemisorption. This was probably caused by the Ir–Zr+ interactions, which could provide the formation of new interfacial sites, which are active for dehydrogenation but inactive for hydrogen adsorption.39
The results for cyclohexane hydrogenolysis rate showed a different trend. The higher hydrogenolysis rate and the lower activation energy obtained for Ir/SiO2 are consistent with the increase of TOF with the dispersion observed for small Ir particles.14,40 The structure sensitivity for hydrogenolysis varies with metal and type of reactant. For example, Sinfelt41 studied the hydrogenolysis of ethane reaction over a series of SiO2 supported Rh catalysts with different metal concentrations (varying from bulk to 0.1 wt.% Rh). For that series of catalysts, the catalytic activity increased with the decrease of particle size for bulk Rh (256.0 nm), 5 wt.% Rh/SiO2 (sintered, 12.7 nm) and 1-10 wt.% Rh/SiO2 (1.2-4.1 nm) catalysts. Within the latter series, the specific activity for the ethane hydrogenolysis varied from 8 to 16 mmol of ethane converted per hour
per square meter of rhodium, increasing with the decrease of particle size.
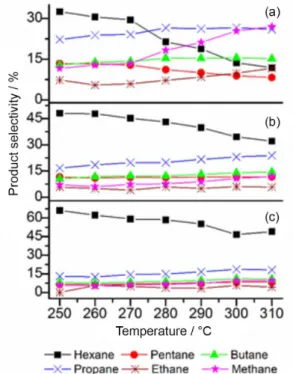
Figure 3 displays the dependence of product selectivity of cyclohexane hydrogenolysis with temperature for all catalysts. A first difference is observed between Ir/SiO2 (that presented the best activity for cyclohexane hydrogenolysis) and the other catalysts regarding the formation of minor hydrocarbons from hexane fragmentation. The selectivity to methane increased with temperature, showing significant cyclohexane fragmentation for this catalyst, in agreement with the results reported by Locatelli et al.21 for cyclohexane
conversion over Ir/SiO2. Methane and pentane selectivities did not follow complementary trends for temperatures higher than 280 °C. This indicates methane was formed via successive terminal hydrogenolysis of intermediate hexane.21
On the other hand, Ir/ZrO2 and Ir/γ-Al2O3 catalysts showed a different behavior (Figures 3b and 3c). For both catalysts, hexane was the main hydrogenolysis product throughout the temperatures range, showing a lower ability of these catalysts for C–C cleavage from hexane, which is in agreement with the values of TOF and reaction rate obtained for this reaction. For these two catalysts, the fragmentation of cyclohexane occurred by C–C cleavage from hexane re-adsorption, giving similar selectivities for the methane-pentane and ethane-butane pairs. This mechanism could be explained by the formation of two different types of hexane re-adsorption on the catalyst surface, one that leads to a CI–CII cleavage (to form
Table 2. Surface characterization of fresh Ir supported catalysts by H2 pulse chemisorption and cyclohexane conversion
Catalyst H2 uptake / (µmol gcatalyst-1)
(H/Ir) × 100
/ % dpa / nm
Cyclohexane rate of reactionb / (mmol h-1 g
cat-1)
TOFc / s-1 Ea / (kcal mol-1)
Dehyd. Hydr. Dehyd. Hydr. Dehyd. Hydr.
Ir/γ-Al2O3 35 67 1.5 29.3 2.9 0.12 0.012 20 17
Ir/SiO2 37 71 1.4 22.6 4.4 0.09 0.018 17 11
Ir/ZrO2 30 57 1.8 44.0 2.8 0.18 0.011 21 15
aParticle size calculated as d
p = 1 / (H / Ir); bcalculated at 260 °C; cturnover frequency calculated from H2 chemisorption. Ea: activation energy; Dehyd.: cyclohexane dehydrogenation; Hydr.: cyclohexane hydrogenolysis.
pentane and methane), and another one that leads to a CII–CIII cleavage (to form ethane and butane) or a CIII–CIV cleavage (to form propane).35 This way, after the primary hydrogenolysis of cyclohexane to hexane, while on Ir/SiO2 catalysts methane is further formed through terminal C–C hydrogenolysis, in the case of Ir/γ-Al2O3 and Ir/ZrO2 internal C–C cleavage was favored. This can be explained by the formation of metal-support adlineation sites on Ir/γ-Al2O3 and Ir/ZrO2 catalysts which hinder the required intermediate for terminal C–C cleavage.
Glycerol hydrogenolysis
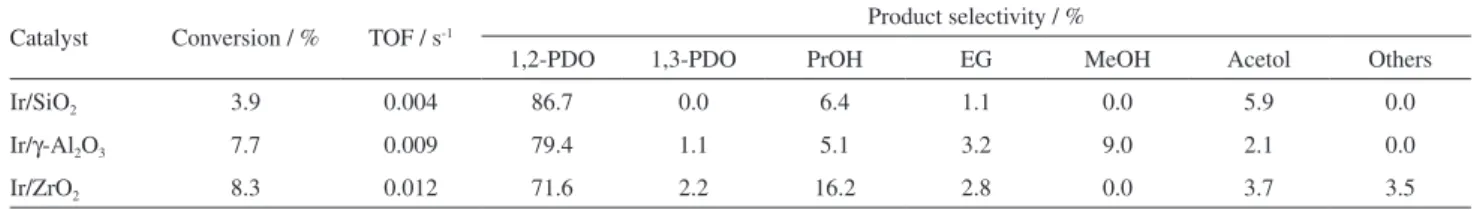
Table 3 lists the conversion and selectivity of glycerol hydrogenolysis over the tested catalysts. Total mass balance closed between 97 and 101% for all reactions. The activity of the catalysts was measured by the TOF based on H2 chemisorption uptakes. All catalysts presented a very low activity for the hydrogenolysis of glycerol in these reaction conditions compared with Ru catalysts tested in the same conditions.42 However, the results can be used to betterunderstand the requirements of the iridium catalytic sites. TOF and conversion values increased in the sequence Ir/SiO2 < Ir/γ-Al2O3 < Ir/ZrO2. The trend in glycerol hydrogenolysis activity was the same as the one observed for the dehydrogenation of cyclohexane, which could indicate that there is an influence of the number of available Ir active sites on the catalysts surfaces on glycerol adsorption or products desorption. Besides, the presence of adlineation metal-support sites on Ir/γ-Al2O3 and Ir/ZrO2 favored glycerol conversion. Raman spectroscopy analysis of spent catalysts did not evidence any presence of carbon compounds. For all catalysts, 1,2-propanediol (1,2-PDO) was the main product. Despite the low activity, Ir/SiO2 showed the highest selectivity to 1,2-PDO (86.7%). Ir/γ-Al2O3 and Ir/ZrO2 presented 1,2-PDO selectivities of 79.4 and 71.6%, respectively. These results indicate that all catalysts favored the selective primary C–O cleavage over C–C cleavage.
For all catalysts, the formation of propanol and methanol can be explained by the subsequent hydrogenolysis of
1,2-PDO and/or 1,3-PDO.43,44 Among the three catalysts, Ir/γ-Al2O3 presented the greater ability for C–C cleavage, forming methanol and ethylene glycol with selectivities of 9.0 and 3.2%, respectively. This result can indicate a better carbon adsorption on the catalyst surface to allow the C–C cleavage and the consequent formation of the mentioned products, which can be related to the properties of the supports. Delgado et al.45 found similar results for glycerol hydrogenolysis reaction on a series of Pt catalysts supported on TiO2, Al2O3 and SiO2-Al2O3. Pt/TiO2, with less acidic sites than the other catalysts, presented higher selectivity to C3 products, whereas the catalysts with more acidic sites yielded the formation of minor alcohols like methanol. The same argumentation could explain the behavior of our series of catalysts, in terms of the difference on the formation of the minor alcohols from subsequent hydrogenolysis of 1,2-PDO.
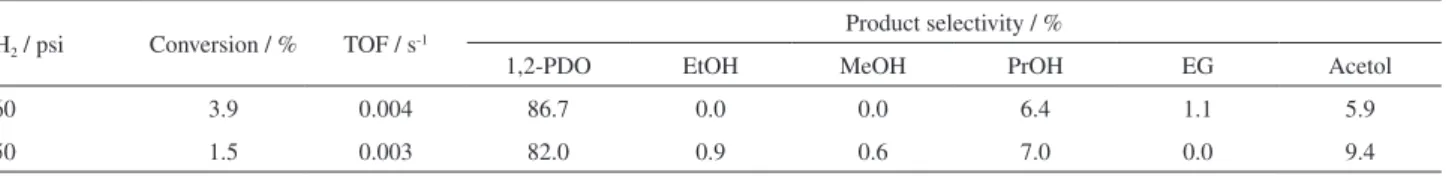
Ir/SiO2 catalyst was used to investigate the effect of increasing the H2 initial pressure from 360 to 550 psi (Table 4). Increasing H2 pressure caused a decrease in glycerol conversion and in selectivity to 1,2-PDO, which decreased from 86.7 to 82%. An interesting difference between these two reactions is observed in the selectivity to acetol, a glycerol dehydration product, which was higher for the reaction performed at higher pressure. This result could indicate that higher pressures have an unfavorable effect on the subsequent hydrogenation of acetol to form 1,2-PDO. For this series of spent catalysts, no characteristic bands of carbon compounds were observed in Raman spectroscopy analysis.
The support effect on glycerol hydrogenolysis was also studied at higher temperature and pressure conditions (Table 5). The total mass balance closed between 98 and 102% for all reactions. In these conditions, glycerol conversion increased in the following sequence: Ir/SiO2 < Ir/γ-Al2O3 < Ir/ZrO2. The higher activity of Ir/ZrO2 is in agreement with several studies which showed Ir/ZrO2 is an active catalyst for hydrogenation reactions.46,47 In this series of reactions, the increase on conversion and the formation of esters, carboxylic acids and long chain alcohols (C4+) could be due to the elevated temperature of
Table 3. Effect of the support on conversion and selectivity of glycerol hydrogenolysis. Reaction conditions: T = 200 °C; PH2 = 360 psi; mcatalyst = 1 g; 150 mL of 20% glycerol solution; treaction = 12 h
Catalyst Conversion / % TOF / s-1 Product selectivity / %
1,2-PDO 1,3-PDO PrOH EG MeOH Acetol Others
Ir/SiO2 3.9 0.004 86.7 0.0 6.4 1.1 0.0 5.9 0.0
Ir/γ-Al2O3 7.7 0.009 79.4 1.1 5.1 3.2 9.0 2.1 0.0
Ir/ZrO2 8.3 0.012 71.6 2.2 16.2 2.8 0.0 3.7 3.5
reaction, since the pressure increase had an insignificant effect on conversion and selectivity over Ir/SiO2.
In summary, the main products for the three catalysts were short chain alcohols (C1-C3), the typical glycerol hydrogenolysis products, including methanol, ethanol, propanol, ethylene glycol, 1,2-PDO and 1,3-PDO. Ir/SiO2 showed the highest selectivity to C1-C3 alcohols (74.7%), whereas the Ir/γ-Al2O3 and Ir/ZrO2 catalysts had selectivity for short chain alcohols of 46.1 and 36.1%, respectively. For all catalysts, 1-propanol was the main product, with selectivities of 46.7% for Ir/SiO2, 30.9% for Ir/γ-Al2O3 and 29.6% when using Ir/ZrO2. Besides, 1,2-PDO was the product with the second highest selectivity among the alcohols: 24.4% for Ir/SiO2, 8.5% for Ir/γ-Al2O3 and 2.8% for Ir/ZrO2. Furthermore, 1,3-PDO was also formed with a selectivity of 0.6% for Ir/SiO2, 2.7% for Ir/γ-Al2O3 and 1.8% for Ir/ZrO2. These results can be attributed to the elevated temperature of the reaction, which could have led 1,2-PDO and 1,3-PDO to further react and form 1-propanol by dehydration, according to reaction mechanisms studies starting from the main products of glycerol hydrogenolysis.43,44
In these reaction conditions, C–O cleavage was favored, and the trend for C–C cleavage in the selectivity of short chain alcohols was Ir/γ-Al2O3 > Ir/SiO2 > Ir/ZrO2 (Table 5). Ir/γ-Al2O3 and Ir/SiO2 catalysts presented similar selectivities for alcohols produced by C–C cleavage (methanol and ethylene glycol), higher than those obtained for Ir/ZrO2, as observed for cyclohexane hydrogenolysis, where Ir/ZrO2 presented the lowest selectivity for products formed by subsequent hexane hydrogenolysis. Thus, these
results can indicate that both C–O and C–C hydrogenolysis are influenced by acidic properties of the support, the electronic state of the active phase and the different metal-support interactions.48
The distribution of oxygenated products formed in the reactions with Ir/γ-Al2O3 and Ir/ZrO2 was interesting. Ir/ZrO2 presented a selectivity to esters of 15.5%, whereas Ir/γ-Al2O3 displayed a selectivity of 7.4%. This fact can indicate that Ir/ZrO2 favored the oxidation of hydrogenolysis products, like alcohols and ketones, by the water present in the reaction media to form more oxygenated products including esters and carboxylic acids.49
Conclusions
Cyclohexane conversion and glycerol hydrogenolysis were used to compare the behavior of iridium catalysts in terms of C–C and C–O cleavage. For cyclohexane hydrogenolysis, Ir/SiO2 showed the best activity and high selectivities for minor hydrocarbons formed by subsequent hexane hydrogenolysis. On the other hand, Ir/ZrO2 catalyst showed the lowest activity for cyclohexane hydrogenolysis and the lowest selectivities for minor hydrocarbons. These differences could be attributed to surface characteristics like particle size, adlineaton sites and electronic state of Ir on the supports, which affect directly the re-adsorption of hexane to form minor hydrocarbons. For glycerol hydrogenolysis, the activity increased in the sequence Ir/SiO2 < Ir/γ-Al2O3 < Ir/ZrO2 in all reaction conditions, the same trend observed for the number of surface active sites
Table 4. Effect of H2 initial pressure on conversion and selectivity of the glycerol hydrogenolysis over Ir/SiO2 catalyst. Reaction conditions: T = 200 °C; mcatalyst = 1 g; 150 mL of 20% glycerol solution; treaction = 12 h
PH2 / psi Conversion / % TOF / s-1
Product selectivity / %
1,2-PDO EtOH MeOH PrOH EG Acetol
360 3.9 0.004 86.7 0.0 0.0 6.4 1.1 5.9
550 1.5 0.003 82.0 0.9 0.6 7.0 0.0 9.4
TOF: turnover frequency; PDO: propanediol; EtOH: ethanol; MeOH: methanol; PrOH: propanol; EG: ethylene glycol.
Table 5. Effect of support on conversion and selectivity of glycerol hydrogenolysis. Reaction conditions: T = 250 °C; PH2 = 550 psi; mcatalyst = 1 g; 150 mL of 50% glycerol solution; treaction = 12 h
Catalyst Conversion / % TOF / s-1
Product selectivity / %
Alcohols
C1-C3 Alcohols
C4+
Ketones Esters Ethers Aldehydes C–C cleavagea C–O cleavageb
Ir/SiO2 21.2 0.05 2.9 71.8 1.5 8.1 7.2 7.9 0.4
Ir/γ-Al2O3 57.2 0.16 3.8 42.3 10.0 18.9 7.4 11.7 1.0
Ir/ZrO2 65.3 0.22 1.6 34.5 12.4 19.7 15.5 10.5 0.9
estimated by cyclohexane dehydrogenation model reaction. The effect of the nature of support was more evident on the product selectivity. Although all catalysts favored C–O cleavage, forming products like 1,2-PDO and propanol, Ir/γ-Al2O3 presented the higher selectivity to minor alcohols formed by C–C cleavage such as methanol and ethylene glycol. Ir/ZrO2 catalyst showed the highest activity in all reaction conditions and the lowest selectivity to minor alcohols produced from C–C cleavage. The differences in the state of surface iridium and support properties were responsible for the catalytic behaviors.
Supplementary Information
Supplementary information (liquid products formed in high temperature reactions) is available free of charge at http://jbcs.sbq.org.br as PDF file.
Acknowledgments
The authors gratefully acknowledge funding from CAPES and CAPES/CNPq-IEL Nacional-Brasil (scholarships for P. P. F. R. and A. J. P. A.), FAPERJ and CNPq.
References
1. Garin, F.; Girard, P.; Weisang, F.; Maire, G.; J. Catal.1981, 70, 215.
2. Din, P. M.; Howarth, J. A.; Hudnott, A. R.; Williams, J. M. J.;
Tetrahedron Lett.1996, 37, 7623.
3. Cunha, D. S.; Cruz, G. M.; Appl. Catal., A2002, 236, 55. 4. Marzialetti, T.; Oportus, M.; Ruiz, D.; Fierro, J. L. G.; Reyes, P.;
Catal. Today2008, 133-135, 711.
5. Cadu, A.; Andersson, P. G.; Dalton Trans.2013, 42, 14345. 6. Xu, Z.; McNamara, N. D.; Neumann, G. T.; Schneider, W. F.;
Hicks, J. C.; ChemCatChem2013, 5, 1769. 7. Foger, K.; Anderson, J. R.; J. Catal.1979, 59, 325. 8. Foger, K.; Anderson, J. R.; J. Catal.1980, 64, 448. 9. Foger, K.; J. Catal.1982, 78, 406.
10. van Senden, J. G.; van Broekhoven, E. H.; Wreesman, C. T. J.; Ponec, V.; J. Catal.1984, 87, 468.
11. Walter, C. G.; Coq, B.; Figueras, F.; Boulet, M.; Appl. Catal., A
1995, 133, 95.
12. McVicker, G.; Daage, M.; Touvelle, M. S.; Hudson, C. W.; Klein, D. P.; Baird Jr., W. C.; Cook, B. R.; Chen, J. G.; Hantzer, S.; Vaughan, D. E. W.; Ellis, E. S.; Feeley, O. C.;
J. Catal.2002, 210, 137.
13. Rodríguez-Gattorno, G.; Alemán-Vázquez, L. O.; Angeles-Franco, X.; Cano-Domínguez, J. L.; Villagómez-Ibarra, R.;
Energy Fuels2007, 21, 1122.
14. Shi, H.; Li, X.; Haller, G. L.; Gutiérrez, O. Y.; Lercher, J. A.;
J. Catal.2012, 295, 133.
15. Passos, F.; Fréty, R.; Schmal, M.; Catal. Lett.1994, 29, 109. 16. Aranda, D. A. G.; Ramos, A. D.; Passos, F. B.; Schmal, M.;
Catal. Today1996, 28, 119.
17. Passos, F. B.; Aranda, D. A. G.; Schmal, M.; J. Catal.1998,
178, 478.
18. Lisboa, J. S.; Santos, D. C. R. M.; Passos, F. B.; Noronha, F. B.;
Catal. Today2005, 101, 15.
19. Lisboa, J. S.; Maia, M. P.; Moreira, A. P. E.; Passos, F. B. In
Studies in Surface Science and Catalysis,vol. 167; Noronha, F. B.; Schmal, M.; Sousa-Aguiar, E. F., eds.; Elsevier: Amsterdam, 2007, pp. 165.
20. Lisboa, J. S.; Terra, L. E.; Silva, P. R. J.; Saitovitch, H.; Passos, F. B.; Fuel Process. Technol.2011, 92, 2075.
21. Locatelli, F.; Candy, J.-P.; Didillon, B.; Niccolai, G. P.; Uzio, D.; Basset, J.-M.; J. Am. Chem. Soc.2001, 123, 1658.
22. Nakagawa, Y.; Shinmi, Y.; Koso, S.; Tomishige, K.; J. Catal.
2010, 272, 191.
23. Amada, Y.; Shinmi, Y.; Koso, S.; Kubota, T.; Nakagawa, Y.; Tomishige, K.; Appl. Catal., B2011, 105, 117.
24. Nakagawa, Y.; Ning, X.; Amada, Y.; Tomishige, K.; Appl. Catal., A2012, 433-434, 128.
25. Chen, K.; Mori, K.; Watanabe, H.; Nakagawa, Y.; Tomishige, K.;
J. Catal.2012, 294, 171.
26. Amada, Y.; Watanabe, H.; Tamura, M.; Nakagawa, Y.; Okumura, K.; Tomishige, K.; J. Phys. Chem. C2012, 116, 23503.
27. Zhou, C. H.; Beltramini, J. N.; Fan, Y. X.; Lu, G. Q.; Chem. Soc. Rev.2008, 37, 527.
28. Siang, J. Y.; Lee, C. C.; Wang, C. H.; Wang, W. T.; Deng, C. Y.; Yeh, C. T.; Wang, C. B.; Int. J. Hydrogen Energy2010, 35, 3456. 29. Tian, H.; Zhang, T.; Sun, X.; Liang, D.; Lin, L.; Appl. Catal., A
2001, 210, 55.
30. Peuckert, M.; Surf. Sci.1984, 144, 451.
31. Atanasoska, L.; Atanasoski, R.; Trasatti, S.; Vacuum1990, 40, 91.
32. Riga, J.; Tenret-Noël, C.; Pireaux, J. J.; Caudano, R.; Verbist, J. J.; Gobillon, Y.; Phys. Scr.1977, 16, 351.
33. Folkesson, B.; Acta Chem. Scand.1973, 27, 287.
34. Kim, Y. I.; Hatfield, W. E.; Inorg. Chim. Acta1991, 188, 15. 35. Bhatia, S.; Beltramini, J.; Do, D. D.; Catal. Today1990, 7, 309. 36. Patel, S.; Pant, K. K.; Fuel Process. Technol.2007, 88, 825. 37. Velu, S.; Kapoor, M. P.; Inagaki, S.; Suzuki, K.; Appl. Catal., A
2003, 245, 317.
38. Krishnamurthy, S.; Landolt, G. R.; Schoennagel, H. J.; J. Catal.
1982, 78, 319.
39. Souza, M. M. V. M.; Schmal, M.; Appl. Catal., A2005, 281, 19.
41. Sinfelt, J. H.; Catal. Rev.1970, 3, 175.
42. Salazar, J. B.; Falcone, D. D.; Pham, H. N.; Datye, A. K.; Passos, F. B.; Davis, R. J.; Appl. Catal., A2014, 482, 137.
43. Kusunoki, Y.; Miyazawa, T.; Kunimori, K.; Tomishige, K.;
Catal. Commun.2005, 6, 645.
44. Miyazawa, T.; Koso, S.; Kunimori, K.; Tomishige, K.; Appl. Catal., A2007, 329, 30.
45. Delgado, S. N.; Yap, D.; Vivier, L.; Especel, C.; J. Mol. Catal. A: Chem.2013, 367, 89.
46. Hong, X.; Lu, J.-q.; Li, B.; Jin, L.-y.; Hu, G.-s.; Wang, Y.-j.; Luo, M.-f.; Indian J. Chem., Sect. A: Inorg., Bio-inorg., Phys., Theor. Anal. Chem.2013, 52, 28.
47. Reyes, P.; Aguirre, M. C.; Pecchi, G.; Fierro, J. L. G.; J. Mol. Catal. A: Chem.2000, 164, 245.
48. Chen, L.; Zhu, Y.; Zheng, H.; Zhang, C.; Zhang, B.; Li, Y.;
J. Mol. Catal. A: Chem.2011, 351, 217.
49. Florez-Rodriguez, P. P.; Pamphile-Adrián, A. J.; Passos, F. B.;
Catal. Today2014, 237, 38.
Submitted: October 18, 2015