Article
J. Braz. Chem. Soc., Vol. 27, No. 5, 849-856, 2016. Printed in Brazil - ©2016 Sociedade Brasileira de Química 0103 - 5053 $6.00+0.00
*e-mail: [email protected]
Electroanalytical Characterization of Montelukast Sodium and Its Voltammetric
Determination in Pharmaceutical Dosage Form and Biological Fluids
Bernu Çölkesen,a Funda Öztürk*,a and Pınar E. Erdenb
aDepartment of Chemistry, Faculty of Science and Art, Namık Kemal University, Tekirdağ, Turkey
bDepartment of Chemistry, Faculty of Science, Ankara University, Ankara, Turkey
The electrochemical properties of montelukast sodium (MKST) at zinc oxide nanoparticles modified carbon paste electrode were investigated by cyclic voltammetry and square wave voltammetry. All studies were based on the irreversible and adsorption-controlled electrochemical reduction signal of montelukast sodium at about –0.7 vs. Ag/AgCl at pH 2.3 in methanol-Britton-Robinson buffer mixture. This adsorptive character of the molecule was used to develop a novel, validated, rapid, selective and simple square wave cathodic adsorptive stripping voltammeric method for the direct determination of montelukast sodium in pharmaceutical and biological fluids without time-consuming steps prior to drug assay. Peak current of electrochemical reduction of montelukast sodium was found to vary linearly with the concentration in the range from 1.0 × 10⁻⁸ to 1.28 × 10⁻⁶ mol L-1. In this method, limit of
detection was found to be 7.7 × 10⁻⁹ mol L-1. The method was applied to determine the content
of MKST tablet and spiked human serum.
Keyword: zinc oxide nanoparticle, square wave cathodic adsorptive stripping voltammetry,
montelukast sodium, pharmaceutical preparation, human serum
Introduction
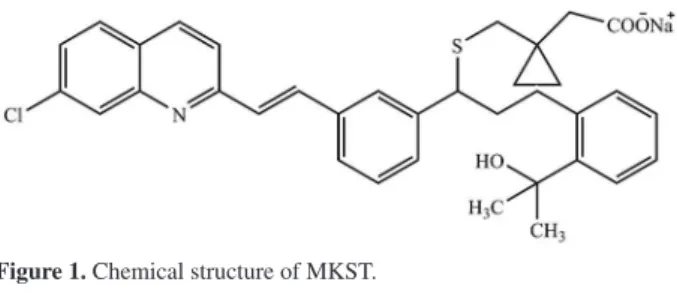
Montelukast sodium (MKST), {the sodium salt of
2-[1-[[(1R)-1-[3-[2-(7-chloroquinolin-2-yl)ethenyl]
phenyl]-3-[2-(2-hydroxypropan-2-yl)phenyl]propyl]sulfanylmethyl] cyclopropyl]acetic acid}, is a potent and selective antagonist of the cysteinyl leukotriene receptor used for the treatment of
chronic asthma and allergic rhinitis.1,2 Its empirical formula
is C35H36ClNO3S and its structural formula is presented in
Figure 1. MKST is freely soluble in ethanol, methanol, and
practically insoluble in acetonitrile and water.3
The different analytical techniques reported so far for the determination of MKST in pharmaceutical formulations
or in biological samples include capillary electrophoresis,4
high performance liquid chromatography (HPLC),5 high
performance thin layer chromatography (HPTLC),6
potentiometric titration7 and spectrophotometry.2
However, all these methods have several limitations. Spectrophotometric methods are generally limited by their low sensitivity or interference from metabolites and other drugs or specificity in mixture analysis, while chromatographic methods often suffer from tedious and time-consuming derivatization procedures and expensive apparatus. Titrimetric methods show lack of selectivity and high limit of detection when compared with modern separation techniques such as HPLC or capillary electrophoresis. In addition, poor quantitative reproducibility limits the practical implementation of
capillary electrophoresis separations in chemical analysis.8
Therefore, a fast, simple, low cost, accurate, precise and sensitive method is very important especially for routine analysis of MKST in its tablets and human body fluids. Compared with above mentioned analytical methods electroanalytical methods have many advantages, in pharmaceutical analysis due to instrumental simplicity, short analysis time, low cost, high sensitivity, wider linear range, lower detection limit and portability. Therefore, they have been used for determination of a wide range of
pharmaceuticals.9 However, available literature indicates
that only a few electrochemical methods have been reported for the determination of MKST in tablets and spiked human
plasma.10-13
Gülcemal et al.10 reported the electrochemical reduction
and determination of montelukast by cyclic voltammetry (CV) and differential pulse voltammetry (DPV) at chitosan
modified carbon paste electrode (CPE). Heli et al.11
reported the synthesis of nickel hydroxide nanopetals through one-pot hydrothermal synthesis in the presence of arginine and used this nanopetals to modify CPEs. These modified CPEs were used for the electrocatalytic oxidation and sensitive determination of montelukast. The authors investigated the electrocatalytic oxidation and determination of montelukast by using CV and
amperometric methods, respectively. Alghamdi12 reported
an adsorptive stripping voltammetric (AdSV) method of MKST on the hanging mercury drop electrode (HMDE).
Alsarra et al.13 investigated the voltammetric behavior of
montelukast using CV, direct current differential pulse polarography (DPP) and alternating current polarography. However, there has been a growing concern about the use of mercury, as an electrode material in voltammetry due to
its toxicity.14 Thus, it is important to develop new methods
for the determination of MKST based on solid electrodes. CPEs have been widely used for electroanalytical
applications since their introduction by Adams15 in 1958.
These electrodes offer the advantages of low background
current, low cost of fabrication and ease of modification.16
Nanomaterials are a broad class of materials that can be made to exhibit novel and significantly improved physical, chemical and biological properties because of their small dimension. The use of metal and metal oxide nanoparticles was reported to improve the performance characteristics
of the electrochemical methods.17-19 Among different
nanomaterials, the zinc oxide (ZnO) nanoparticles possess an important place due to their unique properties such as high specific surface area, optical transparency, high catalytic efficiency, strong adsorption ability, bio-compatibility, nontoxicity, chemical stability, ease of fabrication, fast
electron transfer kinetics and electrochemical activities.20,21
The use of ZnO nanoparticles in carbon paste electrodes is a promising approach to enhance the performance of
electrochemical methods.22,23
This study describes the development of a simple, reliable and sensitive square wave cathodic adsorptive stripping voltammetric method (SWCAdSV) based on ZnO nanoparticles modified carbon paste electrode (ZnO-NP-CPE) for the accurate and precise determination of MKST and its application in pharmaceutical preparations and biological fluids.
Experimental
Materials
MKST (99.0%) sample was supplied from Fako drug manufacturing company, Turkey. Graphite powder, ZnO nanoparticles and paraffin oil were obtained from Sigma-Aldrich Chemical Company (St. Louis, MO, USA). Methanol (MeOH) was purchased from Riedel-de Häen
AG, (Sleeze, Hanover, Germany). NaOH, H3BO3, H3PO4,
and acetic acid were obtained from Merck (Darmstadt, Germany).
Standard stock solutions
A stock solution of MKST (1.0 × 10⁻³ mol L-1) was
prepared by dissolving 5.86 × 10⁻³ g of montelukast in
100 mL of methanol using a bath sonicator. The calibration solutions were prepared by diluting the stock solution with a mixture of MeOH and Britton Robinson (BR) buffer in a volume ratio of 50:50 as solvent-supporting electrolyte mixture. The solubility of montelukast sodium was not satisfactory when the ratio of methanol was lower than 50%. Thus, volume ratio of 50:50 was selected as optimum. The
pH values of these solutions were adjusted using 0.2 mol L-1
NaOH solutions. All MKST solutions were protected from light and used within a day to avoid photochemical decomposition.
Apparatus
All voltammetric measurements such as CV and square wave voltammetry (SWV) were carried out using a Drop Sens µstat 400 electrochemical analyzer (DRP-STAT400, Lianera, Spain). A three electrode cell system incorporating a modified carbon paste electrode (CPE) with 3 mm diameter as working electrode (BAS MP-5023), platinum wire as an auxiliary electrode (BAS MW 1034) and
Ag/AgCl electrode (3.0 mol L-1 KCl) as reference electrode
(BAS MF 2052, West Lafayette, USA) were used in all experiments. All pH measurements were performed using Thermo Orion Model 720A pH-ion meter with an Orion combined glass pH electrode (912600, Waltham, USA).
Ultrapure water (18.2 MΩ cm) was obtained from ELGA
Purelab Classic water purification system (USA). All data were obtained at room temperature.
Preparation of modified CPE
modified electrode was prepared by hand-mixing graphite powder with the nanoparticles and then adding paraffin oil and thoroughly mixing for approximately 30 minutes to form homogeneous modified CP. The paste was placed into the bottom of the working electrode body and the electrode surface was polished with a weight paper to have a smooth surface. The electrode was washed with distillated water and working buffer between measurements.
Preparation of montelukast samples from tablets
Montelukast® tablets containing MKST (10 mg per
tablet) manufactured by Fako were used as the pharmaceutical dosage form. Ten tablets were weighed, powdered finely and mixed in a mortar. The average
mass per tablet was determined and then the powder
equivalent to one tablet was weighed and transferred to a 100.0 mL calibrated flask containing about 50 mL of methanol. The contents of the flask were sonicated for 30 min to achieve dissolution of MKST. After solution step, the content of flask was centrifuged at 1500 rpm for 30 min. An amount of 1.0 mL of sample from the clear supernatant liquor was withdrawn and quantitatively diluted to 100.0 mL with MeOH. This solution was kept at refrigerator and given the name stock tablet solution. Sufficient volumes (such as 0.05, 100, 300, 500 µL) from stock tablet solution were transferred to electrochemical cell containing 10.0 mL of BR buffer-MeOH mixture, pH was adjusted to desired value and performed determination of MKST in tablets using the calibration curve method.
Analysis of serum samples
Serum sample, obtained from healthy individuals was stored frozen until assay. After gentle thawing, 1.0 mL aliquot volumes of serum was added to electrochemical cell containing 10.0 mL of solvent supporting electrolyte mixture and then sufficient volumes (such as 0.01, 0.02, 0.025, 0.03 mL) from stock MKST solution were transferred to this cell. After deareation with nitrogen, measurements were performed to determine MKST content of cell using the calibration curve method.
Voltammetric procedure
In all voltammetric studies, 10.0 mL of MKST solution in MeOH-BR (1:1) mixture were placed into the electrochemical cell at each time. Electrode connections were adjusted and then cell content was deoxygenated with purified nitrogen (99.99% purity) for 1 min before the first run and 30 s between all individual successive runs. After
3 s equilibration time, voltammograms were recorded by applying a negative-going scan (frequency: 10 Hz; potential
Estep: 0.01 V; Eamplitude: 0.01 V).
Results and Discussion
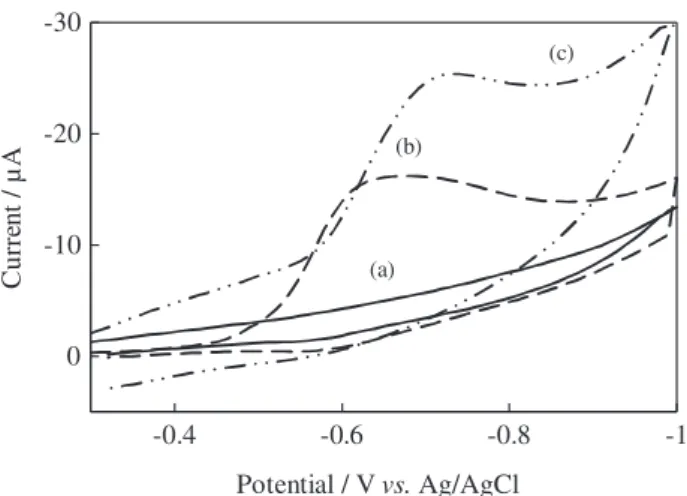
The electrochemical behavior, diffusion and adsorption properties of MKST were studied using CV and SWV. The cyclic voltammograms of MKST at pH 2.3 at bare CPE and ZnO-NP-CPE are presented in Figure 2. In CV studies, a single well defined reduction peak was observed at a potential of –0.62 and –0.70 V at bare CPE and ZnO-NP-CPE at pH 2.3, respectively (Figure 2). There was no peak when a blank MeOH-BR (1:1) solution was scanned at the same conditions. The high peak increased linearly with increasing concentration of MKST. Therefore, it can be concluded that this cathodic reduction peak is due to a reduction of MKST molecules on the bare CPE and ZnO-NP-CPE electrode. As can be seen from Figure 2, there is no anodic peak at reverse scan, indicating that the electrode reaction is totally irreversible. The reduction peak of MKST was higher at ZnO-NP-CPE when compared to bare CPE. This enhanced peak current indicate an enhanced electron transfer rate for MKST at ZnO-NP-CPE. Thus, ZnO nanoparticles were considered to be a suitable modifier for the electrochemical determination of MKST. The electrochemical characterization of CPE and ZnO-NP-CPE was carried out by means of electrochemical impedance spectroscopy (EIS). Figure 3 exhibits the electrochemical
impedance spectra of CPE and ZnO-NP-CPE in 0.10 mol L-1
KCl solution containing 5.0 mmol L-1 Fe(CN)
63−/4−. As
can be seen from Figure 3 the Nyquist plot of impedance spectra includes a semicircle portion and a linear portion. The semicircle portion at high frequencies corresponds to the electron transfer limited process, and the linear portion at low frequencies corresponds to the diffusion process. The diameter of the semicircles is equal to the electron transfer
resistance at the electrode surface.24 The R
ct of CPE was much
larger than ZnO-NP-CPE indicating that charge transfer resistance of the electrode surface decreases and the charge transfer rate increases by employing ZnO-NP-CPE. The results confirmed that presence of ZnO-NPs in CPE matrix had great improvement on the electrochemical response, which was partly due to excellent characteristics such as good electrical conductivity, high chemical stability and high surface area.
The influence of the potential scan rate (υ) on the cathodic
peak current (ip,c) was investigated for 2.5 × 10⁻⁴ mol L-1
MKST in the 0.01-1.0 V s-1 range at pH 2.3. In this range
almost linear dependence between ip,c, and υ, was found
R2 = 0.9807; Figure 4A). The linear relationship between
peak current and scan rate confirms an adsorption controlled mechanism. This relationship indicates that diffusion mechanisms are involved in the electrochemical reaction.
Also a plot of the log ip,c versus the logarithm of the υ
was studied. The equation for the log ip,c versusυ (V s-1)
was found to be log (ip,c) = 0.67 log ν + 1.49 with
R2 = 0.984. (Figure 4B). The value of the slope is between
the theoretical value of 1.0 for adsorbed species and 0.50 for a diffusion-controlled mechanism. Results of all these experimental investigations suggests that electroreduction of MKST molecules on the ZnO-NP-CPE electrode is mainly controlled by diffusion with some adsorption contribution.
In electrochemical studies, pH is one of the variables that commonly and strongly influences the electrochemical behavior of molecules. Therefore, the electrochemical behavior of MKST was studied as a function of pH in the pH range of 2.3-6.0. As can be seen from the SW voltammograms in Figure 4, the potential of the cathodic peak (Ep,c) shifts linearly to more negative values with
increasing pH which can be expressed by the following
equation: Ep,c(V) = 0.055pH + 0.54 with R2 = 0.9915
(Figure 5; inset). The experimental value of the slope of
this curve was found to be about 55 mV per unit pH in the
studied pH range. The slope is very close to the theoretical
value of 59 mV per unit pH required under assumption of
the 2e–/2H+ or 4e–/4H+ process25,26 of the electroreduction
of MKST. Based on the literature, the equation 1 was used to find the ratio of the number of protons to the number of
electrons (∂/n) in the electrode mechanism:27
[ ]Q
[ ]R [H ]
+ ∂RT – + = ln nF ln nF RT E
Ep 0 (1)
In this equation ∂ and n are the number of protons
participating in the reaction and the number of transferred electrons in the electrochemical step, respectively.
According to the obtained results and literature data on the reduction of molecules containing a double bond
-30
-20
-10
0
-1 -0 8.
-0 6. -0 4.
C ur re nt / µ A
Potential / Vvs.Ag/AgCl
(a) (b)
(c)
Figure 2. Cyclic voltammograms of 2.5 × 10⁻⁴ mol L-1 MKST (a) blank solution; (b) bare CPE; (c) ZnO-NP-CPE in MeOH-BR (1:1) at pH 2.3 and scan rate 0.1 V s-1.
0 200 400 600 800 1000 1200 1400
0 500 1000 1500 2000 2500
-Z''
/
k
Ω
Z' / kΩ
Figure 3. The Nyquist curves of () CPE, () ZnO-NP-CPE in 0.10 mol L-1 KCl solution containing 5.0 mmol L-1 Fe(CN)
63−/4−.
-60 -40 -20 0 20 -1.2 -0.7 -0.2 0.3 C ur re nt /µ A
Potential / V . Ag/AgClvs
(a) (f)
y = 0.67x + 1.49 R = 0.982
0 0.5 1 1.5 2
-2.5 -1.5 -0.5 0.5 1.5
lo
g
ip
logν
( )B
y = 41.35x + 1.90 R = 0.982
0 10 20 30
0 0.2 0.4 0.6 0.8
ip
/µ
A
ν/ V s( -1)
( )A
Figure 4. Influence of potential scan rate on both cathodic peak current and cathodic peak potential of 2.5 × 10⁻⁴ mol L-1MKST at pH 2.3 (a) 0.025 V s-1; (b) 0.05 V s-1; (c) 0.075 V s-1; (d) 0.1 V s-1; (e) 0.2 V s-1; (f) 0.3 V s-1. Inset: (A) curve of peak current versus scan rate; (B) curve of logarithm of peak current versus logarithm of scan rate.
-3.5 -3 -2.5 -2 -1.5 -1 -0.5 0 -1.1 -0.6 -0.1 C ur re nt /µ A pH 2 pH 3 pH 4 pH 5 pH 6 y = 0.055x + 0.54
R² = 0.99
0.6 0.8 1
2 4 6 8
Po te nt ial /V .A g / v s AgCl pH
Potential / V . Ag/AgClvs
(C=C), it can be concluded that the R–CH=CH–R1 group
of MKST is reduced to R–CH2–CH2–R1 according to the
following reaction mechanism (Scheme 1).12
Electrochemical determination of MKST
In addition to pH, peak current, peak shape, peak symmetry, linearity range and solubility of MKST are important parameters. The effect of pH on both the peak current and the peak shape was discussed in the previous sections. Peak current, peak shape and peak symmetry were taken into account and a pH value of 2.3 was selected as the optimum value (Figure 5). In the present study, electrochemical assay of MKST was presented with adsorptive techniques to achieve lower limits of detection
than the values in the reported references.28 For this purpose,
the instrumental parameters and experimental conditions such as deposition time and deposition potential were optimized to develop an assay method for determination of MKST at pH 2.3. In stripping method, the influence of
the deposition time on the peak height for 1.0 × 10⁻⁶ mol L-1
MKST was examined at different deposition times over the range from 15 to 150 s. The resulting peak current increases with the increase of the deposition time from 15 to 90 s; then, begins to decrease with increasing deposition time. The value of the peak current is higher when the deposition time is 90 s, however the peak has a wider shape than the peak at 60 s. As a result, optimum deposition time was selected to be 60 s for MKST. The influence of the deposition potential (from 0.0 to –0.5 V) on the SWCAdSV
signal was studied for 1.0 × 10⁻⁶ mol L-1 MKST solution.
The dependence of the peak current on the deposition potential displayed a decrease at more negative potentials after 0.0 V. The maximum peak current in the deposition step was observed for the deposition potential of 0.0 V in SWCAdSV method.
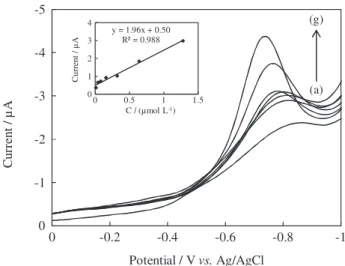
Calibration curves were plotted by using eight standard
MKST solution in the range of 1.0 × 10⁻⁸-5.0 × 10⁻⁶ mol L-1
to establish the working concentration range of MKST in SWCAdSV. For each concentration, three reproducible measurements were made and the mean of these measurements was used to plot the calibration curve (Figure 6). The characteristics of the calibration plots were summarized in Table 1. Result of concentration studies showed that the average peak current of reduction peak changes linearly with MKST concentration in the range
from 1.0 × 10⁻⁸ mol L-1 (0.0059 mg L-1) to 1.28 × 10⁻⁶ mol L-1
(0.7503 mg L-1).
-5
-4
-3
-2
-1
0
-1 -0.8
-0.6 -0.4
-0.2 0
C
ur
ren
t /
µ
A
Potential / Vvs.Ag/AgCl
(a) (g) y = 1.96x + 0.50
R² = 0.988
0 1 2 3 4
0 0.5 1 1.5
C
ur
re
nt
/µ
A
C / (µmol L-1)
Figure 6. SWCAdS voltammograms of MKST at different concentrations (in µmol L-1): (a) 0.01; (b) 0.04; (c) 0.08; (d) 0.16; (e) 0.32; (f) 0.64; (g) 1.28. Inset: calibration curve for corresponding concentrations. N
Cl
S COO-Na+
HO
CH3 H3C
2H /2e+ –
N Cl
S COO-Na+
HO
CH3 H
3C
Scheme 1. Electrochemical reduction mechanism of MKST.
Table 1. Regression data of the calibration curve for assay of MKST by SWCAdSV
Calibration parameter Value
Linearity range / (mol L-1) 1.0 × 10⁻⁸-1.28 × 10⁻⁶ Slope of calibration curve (m) / (µA L mol-1) 1.96
Intercept / A 5.0 × 10⁻⁷
Application of method to dosage form and biological samples
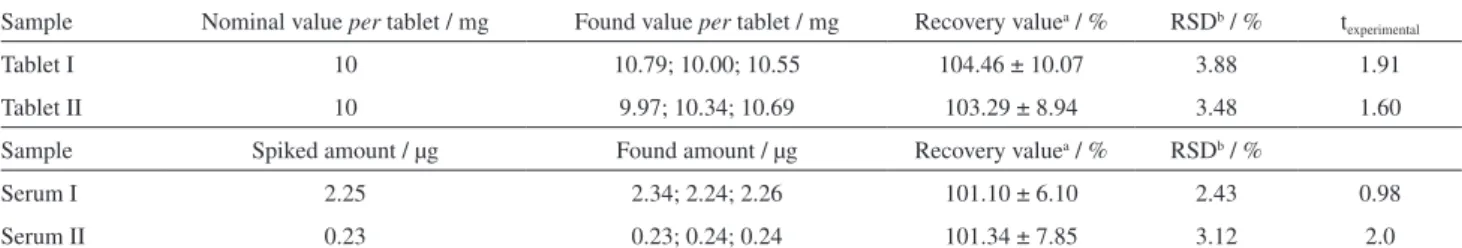
MKST determination in pharmaceutical dosage forms was investigated by using the calibration curve method. This study has also been performed using standard addition method. However, the results of both standard addition and calibration curve method were similar. Thus, the results of the latter were discussed. The results of analysis found using the proposed method for pharmaceutical preparations and spiked human serum are given in Table 2. It can be seen that average recovery values are in good agreement with RSD values less than 5%, which is good evidence for the validity of the method. It can be seen from Table 2 that the mean recoveries and RSD values are in the range of 101.10-104.46% and 2.43-3.88, respectively. These results indicate that the content of MKST in the pharmaceuticals and biological fluids can be safely determined by using the proposed voltammetric method without interference from other substances in the samples after a simple dilution step. The performance of the method was also assessed
by calculation of texp-values using experimental results and
the nominal value. The results recorded in Table 2 showed
that the texp-values did not exceed the tcritical values. It can be
concluded that there is no difference between the results of the presented method and the nominal value or spiked amount at a confidence level of 95%.
Validation of the method
Validation of an analytical method is the process by which it is established that the performance characteristics of the method meets the requirements for the intended analytical applications. The elements required for method validation are: linearity range, limits of detection and quantitation, accuracy, reproducibility, stability, selectivity
and robustness.29
Results of working concentration range studies were given in early section and shown in Figure 6. The regression equation
was obtained as ip,c (µA) = 1.96CMKST (mol L-1) + 0.5. A good
linearity is evident from the values of R2 of 0.988 thus the
validity of the SWCAdSV method for the assay of MKST (Table 1) was confirmed.
Limit of detection (LOD) and limit of quantification (LOQ) values were calculated using the relations:
LOD = 3s / m and LOQ = 10s / m.28 The abbreviation of s is
the standard deviation of intercept of calibration curve and m is the slope of the related calibration curve. LOD and LOQ
values were found to be 7.7 × 10⁻⁹ mol L-1 (0.0045 mg L-1)
and 2.6 × 10⁻⁸ mol L-1 (0.015 mg L-1), respectively. Both LOD
and LOQ values confirmed that the proposed method could be used to determine the MKST content of highly diluted biological samples such as serum and urine.
The accuracy of measurements by means of the described procedure was checked by calculating the recovery of a known concentration of MKST following the proposed method at optimum instrumental and experimental conditions. Recovery values ranged between 103.29 and 104.46% for the tablet analysis, and they were found to be between 101.10 and 101.34% for serum analysis (Table 2). From these recovery values, it is concluded that the proposed method is highly accurate. The high sensitivity of an analytical method is usually accompanied by a very good reproducibility. This analytical performance was evaluated from three repeated measurements of electrochemical signal of different MKST solutions following the proposed method. The precision of the proposed procedure is excellent because the relative standard deviation of recovery values ranges between 2.43 and 3.88% for all measurements, including tablets and serum samples (Table 2).The stability of MKST in the BR buffer of pH 2.3 was evaluated under the optimal procedural conditions monitoring the changes in both the cathodic peak potential and the cathodic peak current of standard MKST solution. Relative standard deviations of peak current and peak potentials for three series of measurements were found to be 3.0 and 0.08%, respectively (Table 1). As a result, no significant change in peak potential and peak current
Table 2. Results of MKST amounts in tablets and results of MKST amounts in serum spiked by standard MKST solution determined using the proposed SWCAdSV method
Sample Nominal value per tablet / mg Found value per tablet / mg Recovery valuea / % RSDb / % t experimental
Tablet I 10 10.79; 10.00; 10.55 104.46 ± 10.07 3.88 1.91
Tablet II 10 9.97; 10.34; 10.69 103.29 ± 8.94 3.48 1.60
Sample Spiked amount / µg Found amount / µg Recovery valuea / % RSDb / %
Serum I 2.25 2.34; 2.24; 2.26 101.10 ± 6.10 2.43 0.98
Serum II 0.23 0.23; 0.24; 0.24 101.34 ± 7.85 3.12 2.0
aResults of recovery values are given as mean ± ts / √N (at 95% confidence level); bRSD: relative standard deviation; t
critical value for 95 % confidence level
confirms the stability of MKST over the time period of measurements.
Table 3 compares the characteristics of electrochemical methods developed for the determination of MKST with the presented method. According to data in this table, the presented method has shown to have good operating characteristics such as low detection limit, wider linear range and good recovery. Among the carbon paste based methods for MKST presented method shows the best analytical characteristics.
Conclusions
In this study, electrochemical determination of MKST in pharmaceutical formulations and human serum was studied on ZnO-NP-CP electrode with CAdSV method for the first time, to the best of our knowledge. Incorporating ZnO nanoparticles into carbon paste matrix improved the analytical characteristics of the purposed method such as LOD, LOQ and linear working range. The method developed here provides a sensitive, fast, cost-effective, high throughput and simple approach to the determination of MKST in tablet dosage forms, and spiked human serum sample. Furthermore, when applied to tablet and serum samples, the proposed method offers the advantage of no requirement of prior extraction procedure.
Acknowledgments
This work was supported by the Research Fund of the Namik Kemal University. Project No. NKU BAP.00.10. YL.14.03. The authors would like to thank to Prof Esma Kiliç for her valuable comments and suggestions on the manuscript.
References
1. Narin, İ.; Sarioğlan, S.; Anılanmert, B.; Sari, H.; J. Solution Chem. 2010, 39, 1582.
2. Satish, A. P.; Patel, D. J.; Patel, N. J.; Int. Res. J. Pharm.2011, 2, 154.
3. Sane, R. T.; Menezes, A.; Mote, M.; Moghe, A.; Gundi, G.;
J. Planar Chromatogr.-Mod. TLC2004, 17, 75.
4. Shakalisava, Y.; Regan, F.; J. Sep. Sci. 2008, 31, 1137. 5. Alsarra, I. A.; Saudi Pharm. J.2004, 12, 136.
6. Rathore, A. S.; Sathiyanarayanan, L.; Mahadik, K. R.; Pharm.
Anal. Acta2010, 1, 1.
7. Aslan, N.; Erden, P. E.; Canel, E.; Kiliç, E.; Bulg. Chem.
Commun. 2014, 46, 497.
8. Bonfilio, R.; de Araujo, M. B.; Salgado, H. R. N.; WSEAS Trans.
Biol. Biomed. 2010, 7, 316.
9. Siddiqui, M. R.; AlOthman, Z. A.; Rahman, N.; Arabian J.
Chem.2013, DOI:10.1016/j.arabjc.2013.04.016.
10. Gülcemal, Y.; Aydogmus, Z.; Kauffmann, J. M.; Electroanalysis 2013, 25, 1796.
11. Heli, H.; Sattarahmadya, N. R.; Vais, D.; Karimian, K.; Sens.
Actuators, B2014, 196, 631.
12. Alghamdi, A. F.; Port. Electrochim. Acta2014, 32,51. 13. Alsarra, I.; Al-Omar, M.; Gadkariem, E. A.; Belal, F.; Farmaco
2005, 60, 563.
14. Mikkelsen, Ø.; Schrøder, K. H.; Electroanalysis2003, 15, 679. 15. Adams, N. R.; Anal. Chem. 1958, 30, 1576.
16. Švancara, I.; Vytas, K.; Barek, J.; Zima, J.; Crit. Rev. Anal.
Chem. 2001, 31,311.
17. Dalkiran, B.; Kacar, C.; Erden, P. E.; Kilic, E.; Sens. Actuators, B 2014, 200, 83.
18. Toh, H. S.; Ambrosia, A.; Pumera, M.; Catal. Sci. Technol. 2013, 3, 123.
19. Karimi-Maleh, H.; Rostami, S.; Gupta, V. K.; J. Mol. Liq. 2015,
20,102.
20. Hwa, K. Y.; Subramani, B.; Biosens. Bioelectron. 2014, 62, 127. 21. Gupta, V. K.; Norouzi, P.; Ganjali, H.; Faridbod, F.; Ganjali,
M. R.; Electrochim. Acta2013, 100, 29.
22. Taherkhani, A.; Jamali, T.; Hadadzadeh, H.; Karimi-Maleh, H.; Beitollahi, H.; Taghavi, M.; Karimi, F.; Ionics2014, 20, 421. 23. Tashkhourian, J.; Hemmateenejad, B.; Beigizadeh, H.;
Hosseini-Sarvari, M.; Razmi, Z.; J. Electroanal. Chem. 2014, 714, 103.
Table 3. Characteristics of electrochemical methods developed for the determination of MKST
Method Working electrode Linear range / (mol L-1)
Detection limit /
(mol L-1) Recovery tablet / % Recovery serum / % Reference CVa and DPVb CHc-CPEd 1.7 × 10⁻⁷-1.83 × 10⁻⁵ 5.3 × 10⁻⁸ 99.5-101.6 89.1-99.9 10 CVa and CAe NHN-CPEf 1.0 × 10⁻⁴-1.77 × 10⁻³ 8.9 × 10⁻⁶ 96.0-103.4 96.0-103.4 11
AdSVg HMDEh 5 × 10⁻⁸-1.0 × 10⁻⁶ 4.0 × 10⁻⁹ 98.0-102.0 100.0-102.0 12
DPPi HMDEh 3.4 × 10⁻⁶-3.4 × 10⁻⁵ 3.41 × 10⁻⁷ 99.6-102.7 98.7-105.8 13
24. Shahmiri, M. R.; Bahari, A.; Karimi-Malehb, H.; Hosseinzadeh, R.; Mirnia, N.; Sens. Actuators, B2013, 17, 70.
25. Wang, J.; Analytical Electrochemistry, 2nd ed.; Wiley-VCH:
New York, 2000.
26. Barek, J.; Peckova, K.; Vyskocil, V.; Curr. Anal. Chem. 2008, 4, 242.
27. Jemelkova, Z.; Zima, J.; Barek, J.; Collect. Czech. Chem.
Commun. 2009, 74, 1503.
28. Öztürk, F.; Küçükkolbaşi, S.; Kaçar, C.; Kiliç, E.; J. Braz. Chem. Soc.2014, 25, 920.
29. International Conference on Harmonisation of Technical Requirements for Registration of Pharmaceuticals for Human Use (ICH); Validation of Analytical Procedures: Text and
Methodology, ICH Q2(R1); ICH: London, 2005.
Submitted:October 15, 2015