Article
Printed in Brazil - ©2016 Sociedade Brasileira de Química0103 - 5053 $6.00+0.00*e-mail: [email protected]
Degradation of the Dye Reactive Blue 4 by Coupled Photoassisted Electrochemistry
at DSA
®-Type Electrode
Rodrigo G. da Silva and Adalgisa R. de Andrade*
Departamento de Química, Faculdade de Filosofia, Ciências e Letras de Ribeirão Preto, Universidade de São Paulo, 14040-901 Ribeirão Preto-SP, Brazil
We investigated the photoelectrochemical oxidation of the dye Reactive Blue 4 in the presence of a DSA®-type electrode of nominal composition Ti/Ru0.3Ti0.7O2 under ultraviolet radiation, aiming to enhance the degradation yields of this dye. We conducted the photoelectrocatalytic treatment under galvanostatic control, using an 80 W mercury vapor lamp as the UV source. We also compared unassisted electrooxidative processes and photocatalytic processes with photoelectrochemical oxidation, to gain better insight into the employed advanced oxidation processes and to evaluate their applicability. The photoelectrooxidative process conducted at 37.8 mA cm-2 promoted fast color removal in the tested solution. The chemical oxygen demand and total organic carbon decreased by approximately 64.7 and 42.7%, respectively. High performance liquid chromatography, gas chromatography coupled to mass spectrometry helped to identify the intermediate compounds produced along the photoelectrochemical process, namely phthalic anhydride, phthalimide, phthalide, 1,3-indanone, and benzoic acid.
Keywords: Reactive Blue 4, photoelectrochemical oxidation, DSA® electrode, environmental electrochemistry
Introduction
Proper treatment of effluents sources, including domestic sewage and industrial waste are a matter of great concern nowadays. Scientists have proposed several degradation processes to remediate water containing highly toxic organic compounds such as dyes, herbicides, pesticides, pharmaceuticals, and detergents, among other contaminants.1-5 However, the industrial application of
remediation processes requires the design of cheaper and more efficient methods with minimum side effects.
Synthetic dyes are widely applicable in the textile, paper, leather dyeing, food, and agricultural technology industries.6-8 Nevertheless, these plants generate a large
amount of wastewater that has to undergo physical and biological treatment before their discharge into the environment.9 Unfortunately, these effluents are highly
toxic: the natural physical appearance and water coloration change even at very low concentrations of contaminants, which negatively affects photosynthetic processes and consequently, the aquatic ecosystem.10,11
The present study deals with the photoelectrochemical
oxidation of the dye Reactive Blue 4 (RB-4/CI 61205). RB-4 (Figure 1) bears anthraquinone as the chromophore group. It is a very reactive dye with well-known applications in the textile industry. During the dyeing process, RB-4 binds to cellulose at alkaline pH, to form a covalent bond between the dichlorotriazinyl group and the textile fibers.12 Nowadays,
when applying bi-reactive dyes fixation ranges to 60-80%,13
nevertheless, dyes are still highly resistant to traditional treatment processes.14,15 Moreover, anthraquinone dyes
are widely soluble in water and little biodegradable under aerobic conditions, so they constitute potentially mutagenic and carcinogenic waste.15,16 In this context, semiconducting
materials based on TiO2 have emerged as an attractive
strategy to photoelectrooxidize these contaminants under different experimental conditions.16-21 To this end, it is
necessary to irradiate TiO2 nanoparticles (in the form of a
colloidal suspension or as a thin TiO2 film deposited onto a
conductive substrate) with UV photons of suitable energy, to promote an electron from the valence to the conduction band, and create a positively charged vacant site.22,23
The hydroxyl radical, ●OH, has high oxidation potential Eº = 2.79 V vs. SHE (standard hydrogen electrode); therefore, it can react with most organic pollutants and promote their mineralization to CO2, H2O, and inorganic
compounds.24
In this work, we investigated a photoassisted electrochemical oxidation system employing a homemade Ti/Ru0.3Ti0.7O2 electrode. We examined how different
parameters, such as current density and total electrolysis time/charge, affected electrolysis. We will present a comparison of the electrochemical (EP), photochemical (PP), and photoassisted electrochemical (PAEP) processes as analyzed by usual control analytical techniques and we will describe how we identified the reaction intermediates by high performance liquid chromatography (HPLC) and gas chromatography coupled with mass spectrometry (GC-MS).
Experimental
Chemicals
The dye RB-4 was purchased from Sigma-Aldrich (dye content 35%, USA) and used as received. The commercial dye concentration was kept constant at 100 mg L-1 furnishing real dye concentration of
35 mg L-1. All chemicals were analytical reagent grade
and were used without further purification. The ionic strength was kept constant (µ = 1.5) by adjustment with a proper amount of Na2SO4. The electrolytic solution
was prepared with high-purity water from a Millipore Milli-Q system; its initial pH was adjusted to 3.0 with analytical grade sulfuric acid from Merck (Germany). This pH value has been chosen based on our previous results,25,26 which indicate that the stability and the lifetime
of the anodes and hydroxyl radicals are enhanced in acid media. Furthermore, this pH enhances the formation of chloroactive species when the electrolyte contains chloride ions and can be used as a comparative basis among the various researches involving the degradation of reactive dyes.27 No substantial change in pH occurred
during the electrochemical or photoelectrochemical process, because a one-compartment cell was employed.
Electrolytic system and electrodes
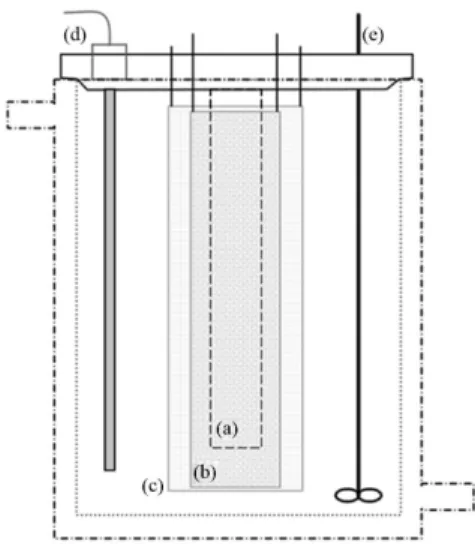
Electrolysis were performed in a 0.8 L reactor designed to operate independently or under applied current and UV irradiation, to accomplish the electrochemical, photochemical, and photoassisted electrochemical processes, respectively. Figure 2 brings a schematic representation of the cell employed in our experiments.
A homemade working anode with a nominal composition of Ti/Ru0.3Ti0.7O2 and 265 cm2 area was
prepared by thermal decomposition, as described before.29
Briefly, the precursor mixtures were applied onto both sides of the pretreated cylindrical Ti-mesh support by brushing. Details about the preparation methodology and the physical and electrochemical characterization of this anode are given elsewhere.28,29 A cylindrical titanium mesh
was used as cathode, which was housed around the anode. All the potentials were referred to the saturated calomel electrode (SCE).
Photochemical treatment was performed by introducing a quartz tube with a diameter of 2.3 cm into the cell; the outer wall of the cell was left in contact with the solution. An 80 W high-pressure mercury vapor lamp (Philips) was placed inside this tube; the main light emission was at 254 nm. This arrangement placed the quartz tube 1.5 cm away from the cathode and 0.5 cm away from the anode, which allowed for total irradiation of the inner loop of the anode.
The electrolysis experiments were accomplished in the galvanostatic mode, under mechanical stirring.
Figure 2. Schematic illustration of the reactor employed for the photochemical, electrochemical, and photoassisted electrochemical degradation of RB-4. (a) Compartment for the quartz tube and high pressure mercury vapor lamp; (b) cylindrical Ti/Ru0.3Ti0.7O2 anode; (c) cylindrical titanium meshcathode; (d) compartment to allocate the thermocouple or the SCE reference electrode; and (e) mechanical stirrer. Externally, the system is connected to a cooler system, to control the cell temperature (T = 28 oC).
HN
SO3H NH2 O
O
SO3H
N
H N
N N
Cl
Cl
Electrochemical experiments (cyclic voltammetry and galvanostatic electrolysis) were conducted using a potentiostat/galvanostat Autolab, mode PGSTAT30 coupled to the BOOSTER10A module (Netherlands). All the experiments were carried out at 28 ± 1 ºC.
Analytical control
The efficiency of the degradation processes was monitored through the disappearance of three wavelengths, one in the visible (λ = 598 nm) and two in the UV region
(λ = 220, 280 nm) on a spectrophotometer Varian, Cary 50
Series model (USA). Mineralization of the dye solution was followed by chemical oxygen demand (COD) and total organic carbon (TOC) measurements. COD analysis employed the closed reflux colorimetric method conducted in a reactor, using the DR2800 spectrophotometer (Hach,
USA). TOC was determined with a Shimadzu TOC-VCPN
Total Organic Analyzer (Japan). All the results are based on the assay of triplicate samples.
Chromatographic analyses were performed by reverse-phase on a Shimadzu LC chromatograph (Japan) containing the following modules: an SCL-10A VP controlling system, an LC-10AT VP isocratic pump, a CTO-10AS VP oven, as well as an SPD-10A VP UV-detector and an RID-10A refraction index detector coupled in series. The aromatic byproducts and RB-4 were analyzed using a Nucleosil C18 (Merck, Germany) column followed by UV-Vis detection at λ = 228 nm. The column compartment
temperature was set at 25 ºC; the injection loop volume was 25.0 µL. The ion-pairing agent was tributylamine (TBA) 1 mmol L-1 and acetic acid 1 mmol L-1 dissolved in the
mobile phase consisting of water/methanol (50:50, v/v). The eluent flow rate was 0.5 mL min-1; an isocratic method
was employed.
The GC-MS experiments were accomplished on a Shimadzu GC-2010 gas chromatograph (Japan) combined with an AOC-20i auto-injector; the chroma-tography system was coupled to a mass spectrometer Shimadzu GCMS-Qp 2010 Plus equipped with an electron ionization source (EI) and a quadrupole analyzer. The split less injection mode with a sample volume of 100 µL was employed; ultra-pure Helium (99.9999%) was the carrier gas. The intermediate compounds were separated in a DB-5 column (30-m length × 0.25-mm internal diameter × 0.25-m film thickness); the injector temperature was 250 °C. The temperature program steps were as follows: 40 °C for 10 min, increase to 100 °C at 12 °C min-1, increase to
200 °C at 5 °C min-1, increase to 270 °C at 20 °C min-1,
270 °C for 5 min, increase to 300 °C at 10 °C min-1, and
300 °C for 5 min.30
The dye Reactive Blue 4, dye content 35%, had low purity, so GC-MS was accomplished at a higher initial dye concentration (175 mg L-1); the samples were collected at
different times (1-4 h). After electrolysis, the samples were submitted to liquid-liquid extraction in acid and alkaline conditions, separately, using dichloromethane (Merck, Germany). First, the samples were extracted in alkaline medium using a sodium hydroxide solution, followed by neutralization and acidification with concentrated sulfuric acid, to promote extraction under acidic conditions. Dichloromethane was used in each extraction step (three aliquots). The portions were joined and dehydrated with anhydrous sodium sulfate. The extracts were then concentrated in a rotary evaporator operating at 40 °C, under reduced pressure. The concentrated sample was allocated in an Eppendorf flask and resuspended in
n-hexane, to achieve a final sample concentration of 1 mg L-1. The intermediates were identified by comparison
with standard mass spectra obtained from NIST and Wiley libraries. All the organic solvents were either HPLC or analytical grade from Merck (Germany).
Results and Discussion
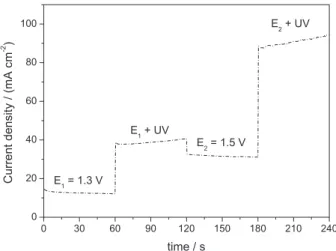
Figure 3 depicts how irradiation of high-energy photons (UV-light) on the electrode material contributes to current density. After elimination of the thermal effect due to temperature rise, the current density increases considerably. The photocurrent results from the excitation of the electrons by absorption of the UV light on the photoactive areas of the anode (Ti/RuO2-TiO2).
Above 1.3 V, the photocatalytic activity of the Ti/Ru0.3Ti0.7O2 anode improves, because titanium oxide has
a photoactive character.20 Irradiation of the TiO
2 interface
0 30 60 90 120 150 180 210 240
0 20 40 60 80 100
C
u
rr
e
n
t
densit
y
/
(m
A
c
m
-2 )
time / s E1= 1.3 V
E 1+ UV
E2= 1.5 V
E2+ UV
with light of higher energy than the energy of the band gap of the semiconductor favors photon absorption, generating electron-hole pairs. As the photogenerated electrons move to the semiconductor bulk, they may reach an external circuit, which increases the current. Consequently, at potentials higher than 1.3 V, the photooxidation process enhances the current activity.
Figure 4 compares the three investigated experimental degradation processes. PP, which occur under 80 W UV-light irradiation without any electrochemical assistance, provides only 8.3% dye mineralization. The low efficiency of the PP process stems from the diminished photon efficiency of the photochemical process over the dark color of the dye solution; the low fraction of light absorbed by the heterogeneous catalyst (TiO2) placed at the anode
compartment limits the efficiency of the PP system.
Using the Ti/Ru0.3Ti0.7O2 anode, EP furnishes 28.5%
TOC removal at the end of the electrolysis. The better efficiency of EP as compared with the PP process evidences that EP is able to enhance oxidation of the dye. In fact, EP over dimensionally stable anode (DSA) is known as a mild oxidative process - the ●OH generated
during the electrochemical step (equation 1) undergoes a fast reaction, to form a higher oxide (equation 2) on the ruthenium-based anodes. The higher oxide species (MOx+1) is a much milder oxidant than the ●OH radical
itself, so the reaction should produce less oxidized byproducts. Although this mechanism was proposed long ago,31 only recently has the higher oxide species been
experimentally detected.32
MOx + H2O → MOx(●OH) + H+ + e- (1)
MOx(●OH) → MOx+1 + H+ + e- (2)
Throughout the implementation of PAEP, TOC removal reaches 43% of the initial dye concentration. Two parallel steps account for the higher efficiency of PAEP as compared with PP and EP. In the first step, the photons emitted upon UV radiation reach the electrode surface, to generate excited radicals MOx(●OH)*. During PAEP, the applied
electrochemical bias diminishes the electron-vacancy pair recombination process of the single photochemical process.14 Thus, UV-light irradiation with simultaneous
application of high current densities at the DSA® anode
enhances the generation of hydroxyl radicals and the oxidability of the anode environment increases improving dye mineralization. Moreover, the linear addition of TOC removal from the two individual processes, PP and EP (37%) still is 6% lower than the TOC decay promoted by PAEP (43%). Thus, the combination of UV irradiation with electrolysis elicits a slightly synergistic effect for pollutant mineralization, which denotes a cooperative behavior between the photo and electrochemical processes.20
Current density effect on the photoassisted electrochemical RB-4 degradation
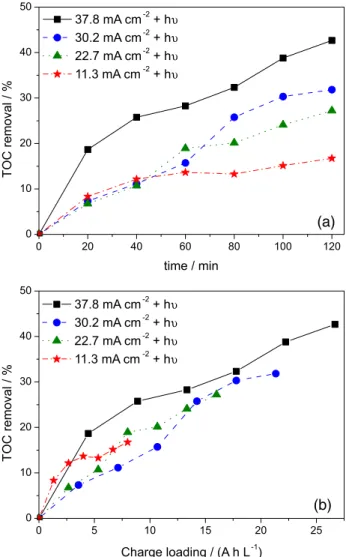
We investigated how the current density affects the mineralization/oxidation of the dye RB-4 during PAEP. To this end, we applied four different current densities, namely 11.3, 22.7, 30.2, and 37.8 mA cm-2, under UV-light
irradiation. We measured TOC and COD to verify the oxidation profile during the proposed treatment. Figure 5 summarizes the obtained representative results.
During EP process, at DSA anode besides the RB-4 oxidation, O2 formation is an important side reaction. This
side reaction is a problem because implies in lower current efficiency since a substantial part of the current is applied to obtain an undesirable product (O2). Nevertheless, at
photoassisted electrochemical process one can make this undesirable reaction to promote degradation. Photoassisted electrochemical process enhances the RB-4 mineralization since generates different oxidizing species like O2●–,
H2O2, and ●OH. As a result, larger amounts of hydroxyl
radicals arise through the following sequence of equations (equations 5-8).23
Ti/Ru0.3Ti0.7O2 + hν→ecb– + hvb+ (3)
hvb+ + H2O(ads)→●OH + H+ (4)
O2(ads) + ecb–→ O2●–(ads) (5)
O2●–(ads) + H+→ HO2●(ads) (6)
2 HO2●(ads)→ H2O2(ads) + O2 (7)
0 20 40 60 80 100 120
0 5 10 15 20 25 30 35 40 45
T
OC
re
moval
/
%
time / min PAEP
EP + PP EP PP
Figure 4. TOC removal from the RB-4 dye solution (35 mg L-1) by different degradation processes: () PAEP = (I = 37.8 mA cm-2 + λ
UV), () EP = (I = 37.8 mA cm-2), () PP = (λ
UV), (- ⋅ - ⋅ -) addition of EP + PP. Cylindrical Ti/Ru0.3Ti0.7O2 mesh anode of 265 cm2, cylindrical titanium mesh cathode. Reactor volume = 0.8 L, RB-4 in Na2SO4, pH = 3.0, and µ = 1.5.
0 20 40 60 80 100 120
0 5 10 15 20 25 30 35 40 45
T
OC
re
moval
/
%
time / min PAEP
EP + PP EP PP
Figure 4. TOC removal from the RB-4 dye solution (35 mg L-1) by different degradation processes: () PAEP = (I = 37.8 mA cm-2 + λ
UV), () EP = (I = 37.8 mA cm-2), () PP = (λ
H2O2 + ecb–→●OH + OH– (8)
DyeRB-4 + ●OH → oxidation product (9)
DyeRB-4 + TiO2(hvb+) → oxidation product (10)
On the basis of the oxidation products identified we can inferred that the general UV irradiation step on the semiconductor promotes degradation of organics (equations 3-10). Photoanodes generally consist of Ti/TiO2 thin films or Ti/Ru0.3Ti0.7O2 dimensionally stable
anodes.14,17,20,21,33-41 During the photooxidation of dyes, the
yield of TOC removal will depend on the experimental conditions used in the treatment. Catanho et al.17 irradiated
UV light (250 W) on Ti/Ru0.3Ti0.7O2 anodes to investigate
the oxidation of Reactive Red 189. Upon application of high current densities (89 mA cm-2), the authors obtained
45% TOC decay in 120 min. Carneiro et al.21 reported
similar results: they achieved 37% TOC removal during the photoelectrocatalysis of solution of RB-4. Carneiro et al.14
showed that photoelectrocatalysis of a Reactive Orange 16 solution on a TiO2 thin film irradiated with UV light
removes a good amount of TOC (56%). It is very difficult to compare the data from different laboratories, because experimental arrangements differ. Here, we employed low energy and obtained results similar to the data reported by other authors.35,37 There is an increase of the oxidation due
formation of more oxidable species. Also the recombination process must be hindered when the electric field is applied. This makes a poor semiconductor type material (TiO2 in
rutile form) enhance its photoactivity.
When we analyze the degradation profile as a function of the total loaded charge or current density we can see that degradation at the first hour of treatment is almost independent of the current density. In fact, the oxidative process conducted under milder conditions just requires longer treatment time (Figure 5b). This indicates that mass transfer and not electronic factors limits the process.38 The
amount of oxidant generated even under mild condition is more than enough to saturate the working electrode.31
COD curves behave similarly (not shown), indicating that the dye RB-4 does not form any recalcitrant compound.42
After that, more recalcitrant byproducts must be formed and higher currents are more effective.
Energy cost
To examine the feasibility of PAEP, we calculated the energy cost using a variation of the equation proposed by Brillas and Martínez-Huitle,24 which correlates the energy
cost with the experimental TOC decay observed during PAEP:
–1
exp S (P + VI)t Energy cost (kWh g TOC) =
Δ(TOC) V (11)
where P is the power density of the high-pressure mercury lamp (W), V is the average potential of the cell (V), I is the applied current (A), t is the time during which the process is applied (h), VS is the total volume of the
photoelectrochemical cell (L), and ∆(TOC)exp is the TOC
decay during the treatment (g L-1). Figure 6 brings the
energy cost for two different applied current densities as a function of the TOC removal for EP and PAEP experiments.
Low current densities incur lower energy costs once RB-4 mineralization is low. As the degradation proceeds, i.e., after a longer time, the energy cost curve with time (data not shown) reaches a plateau, making the processes carried out under drastic electrolysis conditions more energy-friendly once the degradation is enhanced. The degradation-resistant byproducts increase the energy cost, which in turn results in slower mineralization;
0 20 40 60 80 100 120
0 10 20 30 40 50
(a)
T
OC
removal
/
%
time / min 37.8 mA cm-2+ hυ
30.2 mA cm-2+ hυ
22.7 mA cm-2+ hυ
11.3 mA cm-2+ hυ
0 5 10 15 20 25
0 10 20 30 40 50
(b)
T
OC
removal
/
%
Charge loading / (A h L-1) 37.8 mA cm-2+ hυ
30.2 mA cm-2+ hυ
22.7 mA cm-2+ hυ
11.3 mA cm-2+ hυ
Figure 5. TOC removal as a function of the electrolysis time (a) and charge loading (b) for the RB-4 photoelectrochemical treatment with the Ti/Ru0.3Ti0.7O2 anode. V = 0.8 L, 35 mg L-1 RB-4 in Na2SO4, pH= 3.0, and µ = 1.5.
0 20 40 60 80 100 120
0 10 20 30 40 50
(a)
T
OC
removal
/
%
time / min
37.8 mA cm-2+ hυ
30.2 mA cm-2+ hυ
22.7 mA cm-2+ hυ
11.3 mA cm-2+ hυ
0 5 10 15 20 25
0 10 20 30 40 50
(b)
T
OC
removal
/
%
Charge loading / (A h L-1)
37.8 mA cm-2+ hυ
30.2 mA cm-2+ hυ
22.7 mA cm-2+ hυ
consequently, it is necessary to apply larger amounts of energy for longer periods. At lower current density the energy consumption for EP and PAEP are similar nevertheless, UV light furnish higher TOC removal. However, when the current density is increased besides higher dye mineralization PAEP affords lower energy consumption compared with EP. Introduction of UV light simultaneously can increase substantially the degradation of the organic compounds decreasing the energy cost.
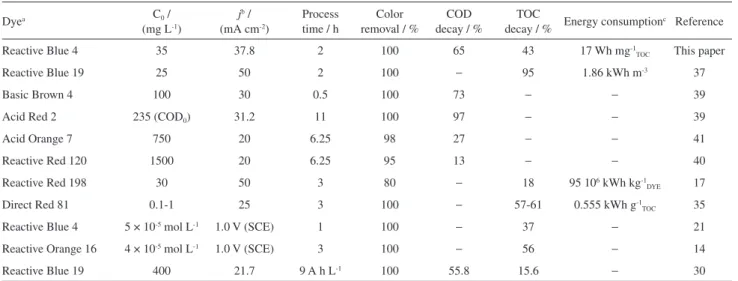
It is very difficult to compare results obtained by different laboratories: the dye, the supporting electrolyte, the solution pH, the concentration, and the reactor design are frequently different. However, Table 1 enables us to infer that Ti/Ru0.3Ti0.7O2 coupled with PAEP affords
TOC decay equal to or higher than the values reported in
the literature, with the advantage that this process relies on milder oxidation conditions, i.e., lower UV lamp power (80 W), absence of heavy metals in the electrode composition, and lower current densities. This consequently reduces the energy consumption, as discussed later in this paper.
RB-4 degradation mechanism
Figure 7a displays the color removal and the absorbance reduction in the UV region for a RB-4 solution 35 mg L-1
as a function of the electrolysis time. The figure represents the three investigated processes, PP, and EP and PAEP at a fixed current of 37.8 mA cm-2. We selected three different
wavelengths for this analysis, λ = 228, 280, and 598 nm,
which are the most intense bands in the spectrum of the dye RB-4. The results are expressed as the percentage of color removal (color removal = [A0 - At] / A0 × 100, where
A0 and At are the absorbance of the wastewater before and
after electrolysis, respectively).24 The maximum absorbance
located at 598 nm corresponds to π →π* transitions,
characteristic of the anthraquinone chromophore group. The n →π* transitions due to the C=N and C=O bonds
exhibit weak or medium intensity absorbance bands at 228 and 280 nm, nevertheless. The π→π* transitions in
aromatic rings should also contribute to the UV peak at 228 nm.44
In the case of EP and PAEP, the dye solution changes from dark blue to pale yellow after just a few minutes (13 min). Both processes exhibit virtually the same decolorization/degradation pattern indicating that the anthraquinone chromophore group breaks easily. In both
0 10 20 30 40
0 5 10 15 20 25
Energy
c
o
s
t
/
(Wh mg
-1
T
O
C
)
TOC removal / %
37.8 mA cm-2+ h
υ
22.7 mA cm-2+ hυ
37.8 mA cm-2 22.7 mA cm-2
Figure 6. Energy cost for EP (circle symbol) and PAEP (square symbol) as a function of TOC removal with the Ti/Ru0.3Ti0.7O2 anode. V = 0.8 L, 35 mg L-1 RB-4 in Na
2SO4, pH= 3.0, and µ = 1.5.
Table 1. Different parameters for the photo-assisted and electrochemical process applied to promote the dye oxidation using DSA®-based anodes (adapted from reference 43)
Dyea C0 /
(mg L-1)
jb / (mA cm-2)
Process time / h
Color removal / %
COD decay / %
TOC
decay / % Energy consumption
c Reference
Reactive Blue 4 35 37.8 2 100 65 43 17 Wh mg-1
TOC This paper
Reactive Blue 19 25 50 2 100 − 95 1.86 kWh m-3 37
Basic Brown 4 100 30 0.5 100 73 − − 39
Acid Red 2 235 (COD0) 31.2 11 100 97 − − 39
Acid Orange 7 750 20 6.25 98 27 − − 41
Reactive Red 120 1500 20 6.25 95 13 − − 40
Reactive Red 198 30 50 3 80 − 18 95 106 kWh kg-1
DYE 17
Direct Red 81 0.1-1 25 3 100 − 57-61 0.555 kWh g-1
TOC 35
Reactive Blue 4 5 × 10⁻⁵ mol L-1 1.0 V (SCE) 1 100 − 37 − 21
Reactive Orange 16 4 × 10⁻⁵ mol L-1 1.0 V (SCE) 3 100 − 56 − 14
Reactive Blue 19 400 21.7 9 A h L-1 100 55.8 15.6 − 30
aColor Index (common) name; bapplied current density; cdifferent units reported.
0 10 20 30 40
0 5 10 15 20 25
Energy
c
o
s
t
/
(Wh mg
-1
T
O
C
)
TOC removal / % 37.8 mA cm-2+ h
υ
22.7 mA cm-2+ hυ
cases, color removal is 80% after 20 min of reaction. After 50 min, the absorbance band present in the visible range disappears, affording total color removal. Small differences appear at lower wavelengths (higher energy), the absorption bands obtained for the solution treated via PAEP are slightly less intense as compared with the solution submitted to EP.
HPLC experiments confirm the formation of different degradation products during PAEP and EP (Figure 7b). Initially, just the peak relative to RB-4 appears (tR = 16.9 min),
but it disappears after 120 min for both EP and PAEP. A common byproduct peak, named “unknown product”, arises (tR = 9.8 min) as the electrolysis proceeds. PAEP efficiently
degrades this intermediate after 120 min. Nevertheless, EP fails to oxidize this byproduct, as seen from the continuous increase in its concentration. PP cannot degrade RB-4 effectively (just 30% of removal), and it also gives small amount of the intermediate, hence, light alone will take much longer to oxidize RB-4. A second degradation byproduct, with retention time of 6.6 min, arises during EP, highlighting
that PAEP and EP have different degradation rates and corroborating with the UV-Vis spectra.
The monitoring of the PAEP at different electrolysis times (1, 2, 3, and 4 h) by GC-MS (we raised the concentration of RB-4 to 175 mg L-1 to facilitate
identification and isolation of the byproducts) reveals five aromatic molecules byproducts. Figure 8 displays the concentration profile of these intermediate compounds. During the first 2 hours of PAEP, 1,3-indanone (m/z 146), phthalic anhydride (m/z 148), and phthalide (m/z 134) arise. After 3 h, phthalimide (m/z 147) and benzoic acid (m/z 122) appear. As the oxidation proceeds, the oxidizing environment leads the intermediates to quinone structures and small aromatic rings. These molecules finally form short chain aliphatic acids such as succinic, formic, maleic, oxalic and acetic acids, final byproducts before total mineralization.45
Scheme 1 displays three different reaction degradation pathways for RB-4 degradation. The identified products are showed with solid arrows.
Conclusions
PAEP and EP can effectively oxidize the dye RB-4, giving similar coloration decay behavior. The use of a low-cost material (Ti/Ru0.3Ti0.7O2 anode) in the photoassisted
electrochemical process (PAEP) yields significant values of TOC removal. Slight synergy for pollutant degradation occurs during the combined process (43% TOC removal) as evidenced by the linear addition (37%) of the two individual processes. PP does not remediate the dye solution satisfactorily. Photoassisted electrochemical process
0 60 120 180 240
time / min
m/z147
m/z122
m/z146
m/z134
m/z148
50.000 u.a.
Abundanc
e
Figure 8. Byproducts formation during the RB-4 photoassisted electrochemical process on the Ti/Ru0.3Ti0.7O2 anode at different treatment times. V = 0.8 L, 175 mg L-1 RB-4 in Na
2SO4, pH = 3.0, and µ = 1.5.
0 20 40 60 80 100 120
0 20 40 60 80 100
Color removal /
%
PAEP EP PP
(a)
0 20 40 60 80 100 120 0.4
0.5 0.6 0.7 0.8 0.9 1.0
Af
/
A0
time / min Solid Line = 228 nm Dashed Line = 280 nm
0 20 40 60 80 100 120
0 20 40 60 80 100
time / min
RB-4 relative intensity /
%
0 2000 4000 6000 8000 10000
(b)
PAEP PP EP
Unknown product - relative
area
Figure 7. (a) Color removal (λ = 598 nm) for the different degradation processes, V = 0.8 L, 35 mg L-1 RB-4 in Na
2SO4, pH = 3.0, µ = 1.5, I = 10 A, and P = 80 W. The inset graph shows how the absorbance decreases at different wavelengths (λ = 228 and 280 nm) for PAEP and EP; (b) chromatographic behavior of the dye RB-4 (tR = 16.9 min) and the common byproduct (tR = 9.8 min) formed during the different treatment processes. Closed symbols: relative intensity (%) of the dye RB-4; open symbols: unknown product.
0 60 120 180 240
time / min
m/z147
m/z122
m/z146
m/z134
m/z148
50.000 u.a.
Abundanc
e
0 20 40 60 80 100 120
0 20 40 60 80 100
Color removal /
%
PAEP EP PP
(a)
0 20 40 60 80 100 120
0.4 0.5 0.6 0.7 0.8 0.9 1.0
Af
/
A0
time / min Solid Line = 228 nm Dashed Line = 280 nm
0 20 40 60 80 100 120
0 20 40 60 80 100
time / min
RB-4 relative intensity /
%
0 2000 4000 6000 8000 10000 (b)
PAEP PP EP
Unknown product - relative
increases substantially the degradation of the organic compounds decreasing the energy cost.
Three primary reaction pathways contribute to degradating RB-4 during PAEP. In this process, 1,3-indanone (m/z 146), phthalic anhydride (m/z 148), phthalide (m/z 134), phthalimide (m/z 147), and benzoic acid (m/z 122) arises as aromatic byproducts.
Acknowledgments
Financial support from FAPESP, CAPES, and CNPq is gratefully acknowledged. The authors express their sincere thanks to Ms. J. N. M. G. Silva for her help in the GC-MS data.
???
1,4-Diaminoanthraquinon 238
m/z
Benzene 78 m/z
Benzoic acid 122 m/z Phthalimide
147 m/z 1,3-Indanone
146 m/z
Phthalide 134 m/z
Phthalic anhydride 148 m/z
4,6-Dichloro-1,3,5-triazin-2-amine
164 m/z
HN HN N
N N
Cl Cl
SO3H
O
O NH2
SO3H
O
O NH2 NH2
N N
N
Cl Cl H2N
COOH
O
O
O O
O O
O
NH O
O
CO
2+
short chain aliphatic acids
+
inorganic compounds
Scheme 1. Proposed pathways for the RB-4 degradation throughout the PEAP. Dashed black arrows ( ): proposed break; dotted red arrows ( ): undefined pathways; and solid blue arrows ( ): identified byproducts.
???
1,4-Diaminoanthraquinon238 m/z
Benzene 78 m/z
Benzoic acid 122 m/z Phthalimide
147 m/z 1,3-Indanone
146 m/z
Phthalide 134 m/z
Phthalic anhydride 148 m/z
4,6-Dichloro-1,3,5-triazin-2-amine
164 m/z
HN HN N
N N
Cl Cl
SO3H O
O NH2
SO3H
O
O NH2
NH2
N N
N
Cl Cl
H2N
COOH O
O
O O
O O
O
NH O
O
CO
2+
short chain aliphatic acids
+
inorganic compounds
References
1. Boye, B.; Dieng, M. M.; Brillas, E.; Environ. Sci. Technol.2002,
36, 3030.
2. Hou, M. F.; Liao, L.; Zhang, W. D.; Tang, X. Y.; Wan, H. F.; Yin, G. C.; Chemosphere2011, 83, 1279.
3. Ruiz, E. J.; Arias, C.; Brillas, E.; Hernandez-Ramirez, A.; Peralta-Hernandez, J. M.; Chemosphere2011, 82, 495. 4. Sillanpaa, M. E. T.; Kurniawan, T. A.; Lo, W. H.; Chemosphere
2011, 83, 1443.
5. Garcia-Segura, S.; Dosta, S.; Guilemany, J. M.; Brillas, E.;
Appl. Catal., B2013, 132, 142.
6. Malik, R.; Ramteke, D. S.; Wate, S. R.; Waste Manage.2007,
27, 1129.
7. Raghu, S.; Basha, C. A.; J. Hazard. Mater.2007, 149, 324. 8. Slampova, A.; Smela, D.; Vondrackova, A.; Jancarova, I.;
Kuban, V.; Chem. Listy2001, 95, 163.
9. Robinson, T.; McMullan, G.; Marchant, R.; Nigam, P.;
Bioresour. Technol.2001, 77, 247.
10. Bae, J. S.; Freeman, H. S.; Dyes Pigm.2007, 73, 81.
11. Andrade, L. S.; Tasso, T. T.; da Silva, D. L.; Rocha, R. C.; Bocchi, N.; Biaggio, S. R.; Electrochim. Acta2009, 54, 2024. 12. Aspland, J. R. In Color for Science, Art and Technology;
Nassau, K., ed.; Elsevier Science Publ. B. V.: Amsterdam, 1998, ch. 11.
13. Sala, M.; Lopez-Grimau, V.; Gutierrez-Bouzan, C.; Materials
2014, 7, 7349.
14. Carneiro, P. A.; Osugi, M. E.; Sene, J. J.; Anderson, M. A.; Zanoni, M. V. B.; Electrochim. Acta2004, 49, 3807.
15. Chequer, F. M. D.; Lizier, T. M.; de Felicio, R.; Zanoni, M. V. B.; Debonsi, H. M.; Lopes, N. P.; De Oliveira, D. P.; Toxicol. In Vitro2015, 29, 1906.
16. Almeida, L. C.; Silva, B. F.; Zanoni, M. V. B.; Chemosphere
2015, 136, 63.
17. Catanho, M.; Malpass, G. R. P.; Motheo, A. J.; Appl. Catal., B
2006, 62, 193.
18. Pupo, M. M. S.; da Costa, L. S.; Figueiredo, A. C.; da Silva, R. S.; Cunha, F. G. C.; Eguiluz, K. I. B.; Salazar-Banda, G. R.;
J. Braz. Chem. Soc.2013, 24, 459.
19. Wu, T. F.; Lin, W. C.; Hsiao, Y. C.; Su, C. H.; Hu, C. C.; Huang, C. P.; Muniyandi, R.; J. Electrochem. Soc.2014, 161, H762. 20. Pelegrini, R.; Peralta-Zamora, P.; de Andrade, A. R.; Reyes, J.;
Duran, N.; Appl. Catal., B 1999, 22, 83.
21. Carneiro, P. A.; Osugi, M. E.; Fugivara, C. S.; Boralle, N.; Furlan, M.; Zanoni, M. V. B.; Chemosphere2005, 59, 431. 22. Sires, I.; Brillas, E.; Oturan, M. A.; Rodrigo, M. A.; Panizza, M.;
Environ. Sci. Pollut. Res.2014, 21, 8336.
23. Ajmal, A.; Majeed, I.; Malik, R. N.; Idriss, H.; Nadeem, M. A.;
RSC Adv.2014, 4, 37003.
24. Brillas, E.; Martinez-Huitle, C. A.; Appl. Catal., B2015, 166, 603.
25. Cestarolli, D. T.; de Andrade, A. R.; Electrochim. Acta2003,
48, 4137.
26. Li, G. T.; Zhu, M. Y.; Chen, J.; Li, Y. X.; Zhang, X. W.;
J. Environ. Sci.2011, 23, 744.
27. Wang, J. L.; Xu, L. J.; Crit. Rev. Environ. Sci. Technol.2012,
42, 251.
28. Coteiro, R. D.; Teruel, F. S.; Ribeiro, J.; de Andrade, A. R.;
J. Braz. Chem. Soc.2006, 17, 771.
29. Coteiro, R. D.; de Andrade, A. R.; J. Appl. Electrochem.2007,
37, 691.
30. Rajkumar, D.; Song, B. J.; Kim, J. G.; Dyes Pigm.2007, 72, 1. 31. Comninellis, C.; de Battisti, A.; J. Chim. Phys.-Chim. Biol.
1996, 93, 673.
32. Fierro, S.; Nagel, T.; Baltruschat, H.; Comninellis, C.;
Electrochem. Commun.2007, 9, 1969.
33. Da Silva, R. G.; Neto, S. A.; de Andrade, A. R.; J. Braz. Chem. Soc.2011, 22, 126.
34. Osugi, M. E.; Umbuzeiro, G. A.; Anderson, M. A.; Zanoni, M. V. B.; Electrochim. Acta2005, 50, 5261.
35. Socha, A.; Sochocka, E.; Podsiadly, R.; Sokolowska, J.; Color. Technol.2006, 122, 207.
36. Guaraldo, T. T.; Pulcinelli, S. H.; Zanoni, M. V. B.; J. Photochem. Photobiol., A2011, 217, 259.
37. Andrade, L. S.; Ruotolo, L. A. M.; Rocha, R. C.; Bocchi, N.; Biaggio, S. R.; Iniesta, J.; Garcia-Garcia, V.; Montiel, V.;
Chemosphere2007, 66, 2035.
38. Comninellis, C.; Chen, G.; Electrochemistry for the Environment, 1st ed.; Springer Science & Business Media: New York, USA, 2010.
39. Awad, H. S.; Galwa, N. A.; Chemosphere2005, 61, 1327. 40. Chen, X. M.; Chen, G. H.; Gao, F. R.; Yue, P. L.; Environ. Sci.
Technol.2003, 37, 5021.
41. Chen, X. M.; Chen, G. H.; Yue, P. L.; Chem. Eng. Sci.2003,
58, 995.
42. Dubber, D.; Gray, N. F.; J. Environ. Sci. Health, Part A: Toxic/ Hazard. Subst. Environ. Eng.2010, 45, 1595.
43. Martinez-Huitle, C. A.; Andrade, L. S.; Quim. Nova2011, 34, 850.
44. Pavia, D.; Lampman, G. M.; Introduction to Spectroscopy - A Guide for Students of Organic Chemistry, 2nd ed.;Saunders College Publishing: Orlando, USA, 1996.
45. Zhu, X. P.; Ni, J. R.; Wei, J. J.; Xing, X.; Li, H. N.; J. Hazard. Mater.2011, 189, 127.
Submitted: July 1, 2015
Published online: December 1, 2015