Article
J. Braz. Chem. Soc., Vol. 26, No. 3, 475-483, 2015. Printed in Brazil - ©2015 Sociedade Brasileira de Química 0103 - 5053 $6.00+0.00
A
*e-mail: [email protected]
Element Determination in Pharmaceuticals Using Direct Solid
Analysis-Electrothermal Vaporization Inductively Coupled Plasma Optical Emission
Spectrometry
Suelem Kaczala,a Adilson B. Costa,b Ederson L. Posselt,b Juliano S. Barin,c
Erico M. M. Floresa and Valderi L. Dressler*,a
aDepartamento de Química, Universidade Federal de Santa Maria,
97105-900 Santa Maria-RS, Brazil
bDepartamento de Biologia e Farmácia, Universidade de Santa Cruz do Sul,
96815-900 Santa Cruz do Sul-RS, Brazil
cDepartamento de Alimentos, Universidade Federal de Santa Maria,
97105-900 Santa Maria-RS, Brazil
A solid sampling electrothermal vaporization inductively coupled plasma optical emission spectrometry (ETV-ICP OES) method for determination of As, Cd, Cr, Cu, Mn, Mo, Ni, Pb, Pd, Pt, Rh, Ru and V in pharmaceuticals is proposed. Tricyclic pharmaceuticals were directly analyzed due to their difficult decomposition with acids. Pyrolysis and vaporization temperature, sample mass, and reaction gas (Freon) flow rate were evaluated. The effect of organic and inorganic compounds was evaluated for matrix matching. The limits of detection ranged from 0.04 µg g−1 (Cu) to 107 µg g−1 (As) and the relative standard deviation was lower than 10%. The investigated elements were not detected in the analyzed samples with the exception of Cr in cyclobenzaprine hydrochloride. Since there was no certified reference materials available for metals and metalloids in pharmaceuticals, the accuracy of the method was evaluated by an independent technique and by analyte recovery. Inductively coupled plasma mass spectrometry was employed for analyte determination after sample decomposition by microwave induced combustion. The agreement of the results found by both techniques was better than 87% and analyte recoveries ranged from 91 to 103%.
Keywords: pharmaceuticals, metals, ETV-ICP OES
Introduction
Pharmaceuticals are recommended by both modern and traditional medicine. They are commonly present in human life to prevent and treat several diseases. According to the
World Health Organization,1 pharmaceuticals must be safe,
effective and of good quality for use in life.
Some pharmaceuticals are metal-based as for instance
cis-platinum and carboplatin used as therapeutic agent in
anticancer therapy or barium sulfate used as X-ray contrast agent. Although in these pharmaceuticals the metals are active ingredients, in others metals and metalloids they
are not desired.2
Despite efforts of pharmaceuticals industries, toxic elements may be present as impurities in the final product.
These impurities may be originated from several sources, like manufacturing equipment, excipients or reagents used
during the synthesis, mostly metal catalysts.3
It is known that some elements are extremely toxic for human health, even at low concentrations. The International
Conference on Harmonization (ICH)3 elaborated a
Mg, Mn, Na, Zn and W). In general, most cited elements have persistent and cumulative effect in the human body. Therefore, quality control of pharmaceuticals, especially with respect to contamination with toxic elements, is necessary.
The United States Pharmacopoeia (USP),4 Brazilian
Pharmacopoeia (FBRAS),5 and European Pharmacopoeia
(Ph.Eur.)6 describe several assays for using in the quality
control of pharmaceuticals. Regarding to potentially toxic elements, the limit test is usually recommended. This test is based on the visual comparison of the precipitate produced when thioacetamide is added to an aliquot of the sample solution (usually 1.0 g of sample in 25 mL) and to a standard solution of Pb (usually 2.0 mL of solution
containing 10 mg L−1 of Pb). The main drawback of this
method is its lack of specificity and sensitivity, since there are toxic and non-toxic elements that may be precipitated by thioacetamide. On the other hand, not all analyte elements can precipitate with thioacetamide or the color of the precipitate may be different from that in the Pb standard solution. Furthermore, the elements must be as free ions in solution. Therefore, other methods for element determination must be developed in order to have more reliable results. Methods using flame atomic absorption spectrometry (FAAS), inductively coupled plasma optical emission spectrometry (ICP OES) and inductively coupled plasma mass spectrometry (ICP-MS) have been proposed by the
pharmacopoeias for element determination.4-6 In this case,
samples must be in solution, preferentially decomposed to minimize interferences in measurement step.
Several authors have proposed methods for element determination in pharmaceuticals and respective raw
materials involving the use of FAAS,7 graphite furnace
atomic absorption spectrometry (GF AAS),8 ICP OES,9
total reflectance X-ray fluorescence (TXRF)10 and
laser induced breakdown spectrometry (LIBS).11
Nevertheless, the ICP-MS technique is very appropriate
for element determination in pharmaceuticals12,13 due to
its multielemental capability and excellent sensitivity
(detection limits in the range of ng L−1 or ng g−1).
Excepting TXRF and LIBS, pharmaceutical samples are preferably analyzed when they are solubilized and the respective solutions analyzed. Therefore, direct solubilization of the pharmaceutical in water or another solvent is carried out. Decomposition of the pharmaceutical sample with inorganic acids is also used for reducing the
organic content and ensure accurate results.14,15 However,
pharmaceuticals such as tricyclic antidepressants are difficult to decompose by acid even at high temperature and pressure. When nitric acid is used, nitro groups can bind the benzene ring and produce very insoluble
compounds.16 Thus, the conventional acid decomposition
becomes ineffective. Sample combustion in open vessel and element absorption in a solvent are not recommended, by considering the analyte loss in the first case and the organic matrix that remains in the solution in the latter. In this sense, microwave induced combustion (MIC) is useful
as already demonstrated.16-18
Direct analysis of solid sample has been proposed, which simplifies the analysis and reduces sample contamination
and analyte losses of volatile elements.19 Electrothermal
vaporization (ETV) associated with ICP OES or ICP-MS allows direct solid sampling analysis. Several applications
dealing with biological,20 environmental,21 geological,22
polymers,23 refractory materials,24 and forensic samples25
analysis are reported. Nevertheless, only one work about direct element determination in solid pharmaceuticals was
found.26 However, in such work, a slurry of the sample
under sonication was introduced in the graphite tube in the ETV system hyphenated with ICP-MS. To the best of our knowledge, determination of elemental impurities present in pharmaceuticals by electrothermal vaporization inductively coupled plasma optical emission spectrometry (ETV-ICP OES) has not been reported. Therefore, in the present work, the use of ETV-ICP OES is proposed for As, Cd, Cr, Cu, Mn, Mo, Ni, Pb, Pd, Pt, Rh, Ru and V determination in ten different types of pharmaceuticals, including matrices that are difficult to decompose by acids.
Experimental
Instrumentation
An electrothermal vaporization unit (Spectral Systems, model ETV-4000c, Germany) was used for solid sampling analysis. Pyrolytic coated graphite tubes and graphite platforms (both from Spectral Systems) were used. In this way, the diffusion of metals on graphite wall and
oxidation of graphite is reduced.27 The graphite tubes are
and auxiliary gas in the ICP OES instrument. The ETV and ICP OES parameters are summarized in Table 1.
A micro-balance (Sartorius, model M2P, Germany) with a resolution of 0.001 mg and maximum capacity of 2 g was used for sample weighing. A SpeedWave four (Berghof,
Germany) equipped with twelve vessels (TFM) and operated at maximum power, temperature and pressure of 1450 W, 230 °C and 50 bar, respectively, was used to assists the sample decomposition using acid. A Multiwave 3000 (Anton Paar, Austria) equipped with eight quartz vessels and operated at maximum power, temperature and pressure of 1400 W, 280 °C and 80 bar, respectively, was used for microwave induced combustion. An ICP-MS spectrometer from PerkinElmer-SCIEX (model Elan DRC II, Canada) equipped with a baffled cyclonic spray chamber and a concentric nebulizer was used for element determination in the solutions of the acid-decomposed samples. Instrumental conditions are shown in Table 1.
Reagents, standards and samples
The water used to prepare the solutions was distillated, deionized and then purified using a Milli-Q system
(Millipore, Billerica, USA, 18.2 MΩ cm). HNO3 65% m m−1
(Merck, Darmstadt, Germany) was used for sample decomposition and calibration solutions preparation. This acid was double distilled in a duoPUR 2.01E sub-boiling system (Milestone, Italy). All other reagents were of analytical grade. Calibration solutions were prepared by serial dilution of multielement stock solutions SCP33MS
10 mg L−1 (SCP Science, Canada) and CLMS-3 10 mg L−1
(Spex CertiPrep, USA) in HNO3 0.72 mol L−1. The
calibration solutions used for determinations by ICP-MS
ranged from 0.10 to 10.0 µg L−1. Aliquots of 0.5 to 25 µL
of the solutions cotanining the investigated elements were transferred directly on the graphite platform in order to obtain the calibration curves for ETV-ICP OES.
Freon R12 (CCl2F2)was used as reaction gas. Citric
acid (C6H8O7, Synth, Brazil), ascorbic acid (C6H8O6, Belga
Química, Brazil), oxalic acid (C2H2O4, Nuclear, Brazil),
ethylenediaminetetraacetic acid (C10H16N2O8, Reagen,
Brazil) and sodium chloride (NaCl, Merck, Germany) were also evaluated for matrix matching. Ammonium nitrate
(NH4NO3, SigmaAldrich) 6 mol L−1 was used as igniter
for MIC. Oxygen with purity of 99.9991% (White Martins, Brazil) was used to pressurize the quartz vessels for MIC. Ten samples of pharmaceuticals, including amitriptyline hydrochloride, carbamazepine, clozapine, cyclobenzaprine hydrochloride, imipramine hydrochloride, ketotifen fumarate, loratadine, nortriptyline hydrochloride, promethazine hydrochloride and tetracycline hydrochloride, were obtained from local drugstores. The samples were in powder or tablet form. Those in tablet form were grounded in an agate mortar to have particles size lower than 65 µm. Then, they were stored in decontaminated plastic vials. The pharmaceuticals
in powder form were analyzed without any treatment.
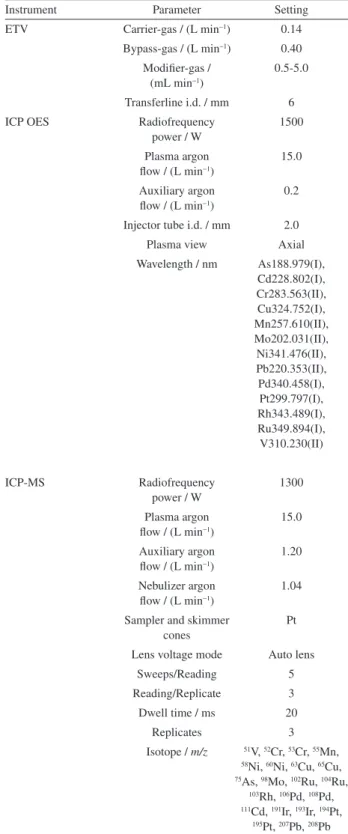
Table 1. ETV-ICP OES and ICP-MS instrumental parameters
Instrument Parameter Setting
ETV Carrier-gas / (L min−1) 0.14
Bypass-gas / (L min−1) 0.40
Modifier-gas / (mL min−1)
0.5-5.0
Transferline i.d. / mm 6
ICP OES Radiofrequency power / W
1500
Plasma argon flow / (L min−1)
15.0
Auxiliary argon flow / (L min−1)
0.2
Injector tube i.d. / mm 2.0
Plasma view Axial
Wavelength / nm As188.979(I), Cd228.802(I), Cr283.563(II), Cu324.752(I), Mn257.610(II), Mo202.031(II),
Ni341.476(II), Pb220.353(II), Pd340.458(I), Pt299.797(I), Rh343.489(I), Ru349.894(I),
V310.230(II)
ICP-MS Radiofrequency power / W
1300
Plasma argon flow / (L min−1)
15.0
Auxiliary argon flow / (L min−1)
1.20
Nebulizer argon flow / (L min−1)
1.04
Sampler and skimmer cones
Pt
Lens voltage mode Auto lens
Sweeps/Reading 5
Reading/Replicate 3
Dwell time / ms 20
Replicates 3
Isotope / m/z 51V, 52Cr, 53Cr, 55Mn, 58Ni, 60Ni, 63Cu, 65Cu, 75As, 98Mo, 102Ru, 104Ru,
103Rh, 106Pd, 108Pd, 111Cd, 191Ir, 193Ir, 194Pt,
Procedures
ETV-ICP OES
The ETV-ICP OES method was optimized in order to find conditions that would allow the analysis of all the pharmaceutical samples. A steel tweezers provided by the ETV manufacturer was used for graphite platform handling whereas a steel spatula was used to tranfer the sample to the platform. Before use, the empty graphite platform was cleaned by submiting it to the heating program of the ETV at temperature up to 2400 °C. The amitriptyline hydrochloride sample was used for method development. To this end, 2.5 mg of sample were weighed into the graphite platform and submitted to the heating program of the ETV. For better signal visualization, the sample
was spiked with 5 µL of solution containing 300 ng of As,
150 ng of Mo and 30 ng of the other analytes. This solution was added onto the sample on the graphite platform and then dried using the drying bank set at 90 °C. A graphite
platform containing only 5 µL of HNO3 0.72 mol L−
1 was
used as blank. For standard addition calibration, different volumes of calibration solutions were added onto the sample previously weighed in the graphite platform. When solution or sample spiked with the anlaytes were analyzed, they were dried before introducing the graphite platform into the furnace.
The analytes signal intensities were obtained by setting the ICP OES spectrometer for 40 readings during 0.01 s each. Peak area was used for signal and data processing, which was possible by means of a software developed (Sisvap, Brazil) in order to integrate the transient signals.
Sample preparation by MIC
Since there was no certified reference materials (CRM) available, results were validated by comparison with those obtained by ICP-MS after sample decomposition using MIC and by analyte recovery test. More details of the MIC
procedure are described by Flores et al.28 Briefly, pellets of
samples (125 mg) were prepared by pressing the powdered material in a manual hydraulic press (Specac, UK) set at 5 ton for 30 s. The pellets were transferred to the quartz sample holder containing a purified filter paper humidified
with 50 µL of 6.0 mol L−1 NH
4NO3 solution. The NH4NO3
acts as igniter. Quartz flasks were pressurized with O2 to
20 bar. A 14.4 mol L−1 HNO
3 solution (6 mL) was used as
absorbing solution. The microwave oven program used for MIC consisted of an irradiation step for 5 min at 1400 W, followed by a cooling step for 20 min (0 W). The absorbing solution was further diluted to 30 mL with water and the investigated elements determined in the final solution using ICP-MS.
Results and Discussion
Since carbon is the major constituent of the analyzed samples, the ETV heating program was adjusted in order to eliminate the carbon matrix before the analyte vaporization. It was observed that at temperature from 300 to 350 °C, the sample matrix was almost completely eliminated. This was verified by weight loss after the sample is submited to pyrolysis step. Thus, the furnace was heated up to 200 °C using a fast temperature ramp and then the temperature was slowly raised to 350 °C (Table 2). In this way, the organic matter was eliminated and matrix effects reduced as observed by the similarity of the analyte signal profiles in the presence and absence of sample. Additionally, as
observed by Detcheva et al.29 and Barth et al.,24
halogen-containing modifiers (such as CCl2F2) buffer differences
related with the analyte chemical form, which may be different in samples and calibration solution. Consequently, the analyte present in the solid sample and in the dried solution has a quite similar vaporization behavior, as observed in the present work.
Modifier evaluation
It is well known that elements such as Cr, V, Mo, B and U are difficult to vaporize by electrothermal heating in graphite tube since these elements form carbides that
are volatilized only at 3000 °C or higher tempertures.30,31
An alternative is to produce more volatile species of these elements, making possible their determination using electrothermal vaporization. To this end, several studies have reported the use of oxinates and halogenated compounds. Ammonium fluoride, PTFE, and halogenated gases as
CCl2F2 are among the most commonly used halogenated
compounds.30 In the case of CCl
2F2, it decomposes at
temperature around 700 °C, producing CF2, CF3Cl, CF4,
and C2F4 radicals, which promote the analyte conversion
into volatile halides.32 The analyte transport increasing as
a consequence of cluster formation is another advantage
of using halogen modifiers in ETV.33-35 By considering
the vaporization temperature, the elements investigated in the present work could be more or less classified in three
groups: (i) As and Cd as volatile elements; (ii) Pd, Pt, Rh,
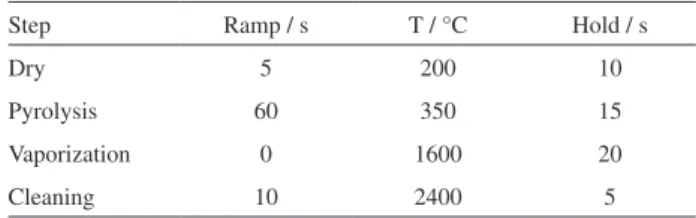
Table 2. Heating program of the ETV
Step Ramp / s T / °C Hold / s
Dry 5 200 10
Pyrolysis 60 350 15
Vaporization 0 1600 20
and Ru as refractory elements and (iii) Cr, Cu, Mo, Ni and V as carbide forming elements.
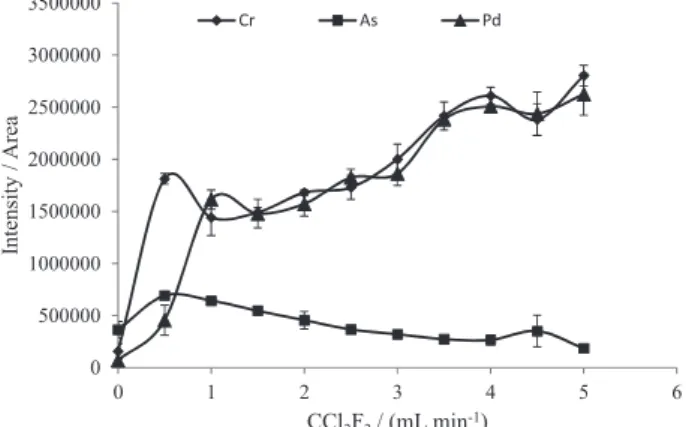
Freon was used as reaction gas in the present work, whereas the gas flow rate was evaluated in the range of 0.5
to 5.0 mL min−1. As expected, the vaporization temperature
of several elements decreased drastically in the presence of Freon as a consequence of the formation of halogenated compounds. The influence of the Freon flow rate on As, Cr, Pd and Pt is shown in Figure 1. For this experiment, the pyrolysis and vaporization temperatures were set at 350 °C and 1800 °C, respectively, whereas 2.5 mg of amitriptyline hydrochloride spiked with 300 ng of As, 150 ng of Mo and 30 ng of the other investigated elements were analyzed. As can be observed in Figure 1, Cr and Pd exhibit similar behavior as a function of the Freon flow rate, differently of As that is a more volatile element. Similar behavior was observed for Cd (not shown in Figure 1), that is, the maximum Cd signal intensity was observed when the Freon
flow rate was around 1.0 mL min−1. It was observed that the
Cr signal intensity as well as those of Cu, Mo, Ni, V, Mn and Pb decreased at lower Freon flow rate when compared to Pd, Pt, Rh and Ru (not shown in Figure 1), probably due to the generation of halogenated compounds at lower Freon flow rate. In general, 80% of the maximum signal of Cr, Cu,
Mo, Ni, V, Mn and Pb was observed when 0.5 mL min−1
of Freon was added to the carrier gas. On the other hand,
the Freon flow rate should be at least 1.0 mL min−1 for
Pd, Pt, Rh and Ru exhibit 80% of their maximum signal. In general, the analyte signal intensity increased with the Freon flow rate increase, differently of As and Cd. The signals of these two more volatile elements decreased with the Freon flow rate increase because the added gas impairs the nucleation process, preventing the analyte transport to the ICP. Therefore, it can be stated that effect of Freon on nucleation is more pronounced for more volatile elements.
However, suppression of the As and Cd signals may also have occured as a consequence of energy transfer change in the ICP caused by Freon. Thus, as a compromise condition,
the Freon flow rate was fixed in 3.0 mL min−1.
The analyte vapor transport is usually improved in
the presence of some compounds,33 which can promote
the formation of clusters. Therefore, the effect of organic compounds such as citric acid, ascorbic acid, oxalic acid, ethylenediaminetetraacetic acid, and NaCl were evaluated. These substances not only increase the analyte transport, but also serve as matrix matching. In this way, calibration can be carried out with aqueous standards instead of solid standards. However, the analyte transport was only little improved when up to 100 mg of each compound above cited was added. Besides, the carrier effect was not the same for all elements, probably because Freon masked the effect caused by the added substance. Thus, only Freon was used in further experiments, which acts as reaction gas (lowering the vaporization temperature) and carrier of several elements.
Heating program of the ETV system
The pyrolysis (300 to 800 °C) and vaporization (800 to 2000 °C) temperatures as well as the time of each step were evaluated in order to obtain a compromise condition for the determination of all elements simultaneously at
a Freon flow rate of 3.0 mL min−1. Experiments using
standard solutions and sample spiked with standards were carried out. In these experiments, 300 ng of As, 150 ng of Mo and 30 ng of each of the other elements were directly analyzed or added to 2.5 mg of amitriptyline hydrochloride on the graphite platform. The ETV program evaluated and
set consisted of four heating steps: (i) fast heating (5 s)
to reach 200 °C and holding for 10 s; (ii) heating (about
60 s) up to the pyrolysis temperature and holding for 15 s, the temperature was slowly increased in this step with the aim to eliminate the sample matrix slowly in order to prevent the plasma extiction due to the matrix overloading;
(iii) vaporization at maximum power (3000 °C s−1) and
holding for 20 s and (iv) cleaning at 2400 °C for 5 s. The
ETV program established is given in Table 2. When the pyrolysis temperature was evaluated that of the vaporization was fixed at 2000 °C; when the vaporization temperature was evaluated that of pyrolysis was set at 350 °C. Figure 2 shows the pyrolysis and vaporization temperature curves of As, Cr and Pd, where one can observe that the behavior of the elements is different with respect to the pyrolysis temperature. Arsenic is lost at lower temperature than Cr and Pd. Similar behavior was observed for Cr, Cu, Mn, Ni, Mo and Pb, which were lost at pyrolysis temperature higher than 500 °C. With respect to the other investigated
0 500000 1000000 1500000 2000000 2500000 3000000 3500000
0 1 2 3 4 5 6
Intensity
/
Ar
ea
CCl2F2/ (mL min-1)
Cr As Pd
Figure 1. Effect of CCl2F2 flow rate on the analytes signals intensities.
elements, no losses were observed up to 800 °C. These findings agree with the results reported by Matousek and
Satumba30 and Ren and Salin.32
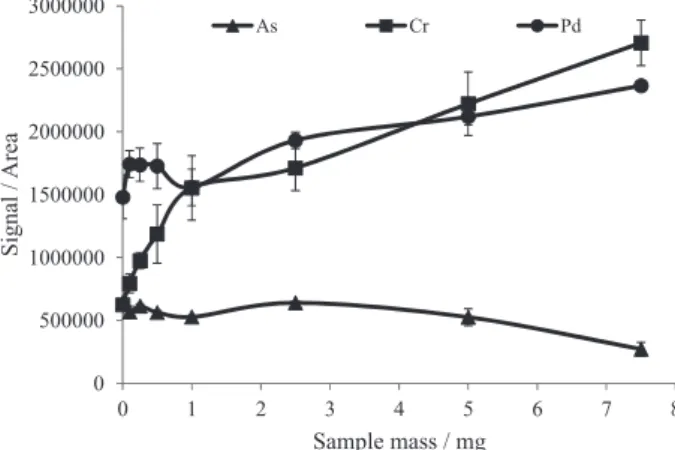
Sample mass evaluation
The evaluation of the effect of sample mass was carried out using amitriptyline hydrochloride spiked with the analytes, whereas the sample mass ranged from 0.1 to 7.5 mg. The minimum sample mass was limited by the difficulty in weighing sample mass lower than 0.1 mg, while the maximum sample mass was by the graphite platform capacity (about 10 mg for this kind of sample). In addition, higher sample mass would lead to plasma instability or even its extinction, mainly when the whole matrix could not be eliminated at the pyrolysis step (Table 2). The effect of the sample mass was not the same for all investigated elements and according to the results obtained in this step,
they could be grouped in distinct groups: (i) the As, Cd, V
and Mo signal intensity was suppressed when the amount
of sample was higher than 5.0 mg; (ii) the Cr, Cu, Mn, Ni
and Pb signal intensity increased gradually with the sample
mass increasing; (iii) the Pd, Rh and Ru signal intensity
increased with the sample mas increasing up to 0.5 mg and
then remained almost constant; (iv) the maximum signal of
Pt was observed for 0.5 mg of sample, which decreased for higher sample mass. The effect of sample mass on the As, Cr, Pd signals can be seen in Figure 3. As a compromise condition for multielement determination, in the present work, the sample mass was fixed at 2.5 mg.
The sample constituents can increase the analyte vapor transport to the ICP, increasing the analyte signal as a
consequence.36 On the other hand, too much amount of
sample overload the plasma where there is no more sufficient
energy for analyte excitation. Some authors36 stated that
signal increasing and/or suppression is related to the element volatility. However, with the exception of As, in the present work, different behavior was observed for elements with similar volatility. Therefore, additional investigations are necessary by considering also the energy of the emission line involved. The effect of Freon in the ICP must also be considered because a mixed gas plasma is generated. In addition, the excitation conditions in the ICP changes
in the presence of carbon as observed by Lu and Jiang,37
Ho and Jiang38 and Li et al.39
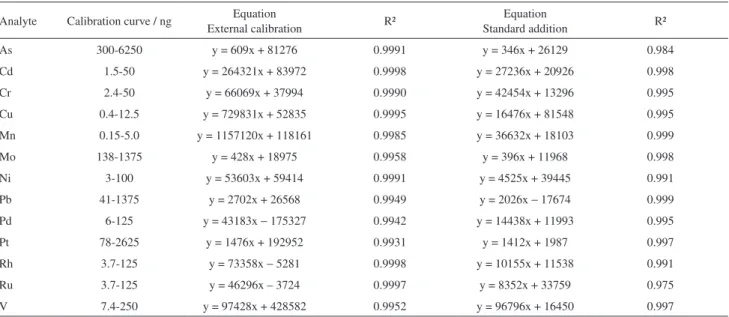
Calibration, limits of detection and precision
The external calibration (a) and standard addition (b) methods were evaluated using a multielement standard solution where the analyte concentration was in accordance with its sensitivity. Increasing volumes of this solution were transferred to the graphite platforms, with or without sample, and dried on the drying bank. Blank replicates consinting of
5 µL of 0.72 mol L−1 HNO
3 were also analyzed. The mass
range used for both calibration methods, the coefficient
of determination (r2) and the linear regression equation
of calibration curves are summarized in Table 3. Better
coefficient of determination was observed (r² ≥ 0.99) for
the external calibration. Although Freon acts as reaction and carrier gas, minimizing differences for the analyte in aqueous solution and in the presence of sample, the standard addition method was still necessary in view of the different sensitivity observed for the analyte in prescence and absence of the sample matrix. With respect to precision, the relative standard deviation (RSD) was typically lower than 10%.
The limits of detection were calculated using the 3σ
criterion. The standard deviation (σ) was obtained from
10 measurements of the empty graphite platforms. The
0 300000 600000 900000 1200000 1500000 1800000 2100000 2400000
300 500 700 900 1100 1300 1500 1700 1900
Intensity
/
Area
Temperature / °C
As Cr Pd
Figure 2. Pyrolysis and vaporization temperatures. Sample: 2.5 mg of amitriptyline hydrochloride spiked with 300 ng of As and 30 ng of Cr and Pd; CCl2F2 flow rate: 3 mL min−1; pyrolysis and vaporization temperature:
350 and 2000 °C, respectively. Each point is the mean and standard deviation of three measurements.
0 500000 1000000 1500000 2000000 2500000 3000000
0 1 2 3 4 5 6 7 8
Signa
l
/
Area
Sample mass / mg
As Cr Pd
Figure 3. Effect of the sample mass on the analyte signal intensity. Sample: spiked with 300 ng of As and 30 ng of Cr and Pd; CCl2F2 flow rate of 3 mL min−1; pyrolysis and vaporization temperature: 300 °C and
limits of detection (LODs) of the proposed ETV-ICP OES are given in Table 4, where one can compare with those of the MIC ICP-MS method and the limits recommended
by USP4 and FBRAS.5 As can be observed in Table 4, the
proposed method attends the limits recommended by USP4
for Cd, Cu, Ni, Rh and Ru and those of Cd, Cr, Cu, Mn, Ni,
Pd, Pt, Rh, Ru and V recommended by FBRAS.5
Samples analysis
For quantification of the investigated elements in the pharmaceuticals samples, 2.5 mg of each sample were
weighed directly into the graphite platforms, transferred to ETV and then vaporized by applying the heating program
given in Table 2 under Freon at 3.0 mL min−1. Ten samples
were analyzed, whereas chromium was the unique element
detected (concentration: 5.7 ± 0.4 µg g−1) and only in
cyclobenzaprine hydrochloride. The concentration of Cr was lower than the maximum limit recommended
by FBRAS (25 µg g−1).5 The concentrations of all other
elements were lower than the respective LODs.
Considering the 16 elements recommended by the
Pharmacopoeias,4,5 only Ir, Hg and Os were not included in
the present method. Osmiun is very volatile and the difficult Table 3. Parameter of the calibration curves obtained by external calibration and standard addition methods by using ETV-ICP OES
Analyte Calibration curve / ng Equation
External calibration R²
Equation
Standard addition R²
As 300-6250 y = 609x + 81276 0.9991 y = 346x + 26129 0.984
Cd 1.5-50 y = 264321x + 83972 0.9998 y = 27236x + 20926 0.998
Cr 2.4-50 y = 66069x + 37994 0.9990 y = 42454x + 13296 0.995
Cu 0.4-12.5 y = 729831x + 52835 0.9995 y = 16476x + 81548 0.995
Mn 0.15-5.0 y = 1157120x + 118161 0.9985 y = 36632x + 18103 0.999
Mo 138-1375 y = 428x + 18975 0.9958 y = 396x + 11968 0.998
Ni 3-100 y = 53603x + 59414 0.9991 y = 4525x + 39445 0.991
Pb 41-1375 y = 2702x + 26568 0.9949 y = 2026x − 17674 0.999
Pd 6-125 y = 43183x − 175327 0.9942 y = 14438x + 11993 0.995
Pt 78-2625 y = 1476x + 192952 0.9931 y = 1412x + 1987 0.997
Rh 3.7-125 y = 73358x − 5281 0.9998 y = 10155x + 11538 0.991
Ru 3.7-125 y = 46296x – 3724 0.9997 y = 8352x + 33759 0.975
V 7.4-250 y = 97428x + 428582 0.9952 y = 96796x + 16450 0.997
Table 4. Limits of detection of the ETV-ICP OES and MIC ICP-MS methods and limits established by the USP and FBRAS pharmacopeias
Element ETV-ICP OES MIC ICP-MS Limits / (µg g
−1)
LODs / ng LODs / (µg g−1) LODs / (µg g−1) FBRAS USP
As 267 107 0.4 1.5 0.15
Cd 0.5 0.2 0.005 0.5 0.25
Cr 1.7 0.7 0.4 25 a
Cu 0.1 0.04 0.9 250 25
Mn 0.1 0.04 0.4 250 −
Mo 114 46 0.9 25 1.0
Ni 2.1 0.85 1.1 25 5.0
Pb 6.3 2.5 0.2 1.0 0.5
Pd 4.9 2.0 0.002 10 1.0
Pt 18 7.2 0.002 10 1.0
Rh 0.2 0.08 0.001 Σ < 10 1.0
Ru 0.5 0.2 0.001 Σ < 10 1.0
V 6.2 2.5 1.0 25 1.0
determination of Os is well documented.40 Mercury was
not included in view of its higher volatility compared with the other investigated elements. Furthermore, halogenated
compounds decrease the Hg transport to the ICP.35 Iridium
was not included in the method due to the low sensitivity and low precision observed.
Accuracy
The accuracy of the results obtained using ETV-ICP OES were checked using an independent method. The
Pharmacopoeias4-6 recommend sample decomposition using
microwave assisted digestion for water insoluble samples and adequate techniques for element detection. However, it was not possible to decompose all analyzed samples by using the recommended sample decomposition method. The obtained sample solutions had elevated residual carbon content (RCC) and precipitate, likely products of
nitration reactions.16 The FBRAS5 recommends the use
of MIC for samples of difficult decomposition, instead of microwave assisted digestion. MIC has already been used for pharmaceuticals decomposition whereas the RCC
content in the final sample solution was very low.16 It is
worth citing that low RCC content is very important in ICP-MS determination because carbon promotes spectral and non-spectral interferences. Therefore, the analytes determination in the pharmaceuticals samples was carried using MIC for sample decomposition. External calibration was used for element quantification using ICP-MS. The Cr concentration found in cyclobenzaprine hydrochloride
was 6.12 ± 0.12 µg g−1, which is not different of that found
using ETV-ICP OES at 95% of confidence level (t-test).
The other investigated elements were also not detected by using MIC and ICP-MS. In addition, analyte recovery test was also done. Analyte solutions were added to 2.5 mg of sample mass in order to achieve concentration values about five-fold higher than the LOD of each element. Recoveries in the range of 91 to 103% were observed. Therefore, these results attest the good accuracy of the proposed ETV-ICP OES method.
Conclusions
An ETV-ICP OES method for direct determination of metals and metalloids in solid pharmaceuticals was developed. High sample throughput, good sensitivity, low or no sample preparation that reduces the risk of contamination and analyte losses are the main advantages of the proposed method.
Freon was used as reaction gas, which promoted the analytes vaporization at lower temperature. By adequate
optimization of ETV-ICP OES parameters, 13 elements were accurately determined in 10 pharmaceutical samples. From the list of 16 elements that must be controlled in pharmaceuticals, only Ir, Hg and Os could not be included in the method, due to low sensitivity and/or losses in the pyrolysis step. The investigated elements were not detected in the analyzed samples, with the exception of Cr. Cyclobenzaprine hydrochloride was the only sample where Cr was detected, but the concentration found was lower than the concentration limit recommended by the pharmacopoeias. The LODs of Cd, Cr, Cu, Mn, Ni, Pd, Pt, Rh, Ru and V are lower than the maximum limits
recommended by the FBRAS.5 However, the method does
not attend the limits established by USP4 for As, Mo, Pb,
Pd, Pt and V.
Acknowledgements
The authors gratefully acknowledge the support of the Conselho Nacional de Desenvolvimento Científico e Tecnológico (CNPq) and Coordenação de Aperfeiçoamento de Pessoal de Nível Superior (CAPES).
References
1. World Health Organization (WHO), http://www.who.int/topics/ pharmaceutical_products/en/ accessed in December 2014. 2. Meermann, B.; Sperling, M.; Anal. Bioanal. Chem.2012, 403,
1501.
3. International Conference on Harmonisation of Technical Requirements for Registration of Pharmaceuticals for Human Use (ICH), ICH Harmonized Tripartite Harmonized, Guideline for Elemental Impurities; ICH Q3D Guideline, Geneva,
2014.
4. The United States Pharmacopoeia 35; Elemental Impurities-Limits 232, Pharm. Forum, 37, 2011.
5. Agência Nacional de Vigilância Sanitária - Farmacopeia Brasileira, 5ª ed.; Brasília, 2010.
6. European Pharmacopoeia, 5th ed.; Council of Europe: Strasbourg, 2005.
7. Scripcariu, M.; Tanase, I. G.; Fleschin, S.; Magearu, V.; Rev. Roum. Chim.2008,53, 149.
8. Tanase, A.; Miu, A.; Rev. Roum. Chim.2012,57, 971. 9. Raghuram, P.; Soma Raju, I. V.; Sriramulu, J.; Pharmazie 2010,
65, 15.
10. Antosz, F. J.; Xiang, Y.; Diaz, A. R.; Jensen, A. J.; J. Pharm. Biomed. Anal. 2012, 62, 17.
11. Carvalho, G. G. A.; Nunes, L. C.; Souza, P. F.; Krug, F. J.; Alegre, T. C.; Santos Jr., D.; J. Anal. At. Spectrom.2010,25, 803. 12. Lewen, N.; Mathew, S.; Schenkenberger, M.; Raglione, T.;
13. Van Hoecke, K.; Catry, C.; Vanhaecke, F.; J. Anal. At. Spectrom.
2012,27, 1909.
14. Mester, Z.; Sturgeon, R. In Comprehensive Analytical Chemistry - Sample Preparation for Trace Element Analysis; Barceló, D.;
ed.; Elsevier: Amsterdam, 2003, p. 1338.
15. Mitra, S. In Sample Preparation Techniques in Analytical Chemistry;Kebbekus, B. B.; ed.; John Wiley & Sons: New
Jersey, 2003, ch. 5.
16. Barin, J. S.; Tischer, B.; Picoloto, R. S.; Antes, F. G.; Silva, F. E. B.; Paula, F. R.; Flores, E. M. M.; J. Anal. At. Spectrom. 2014, 29, 352.
17. Pereira, J. S. F.; Pereira, L. S. F.; Schmidt, L.; Moreira, C. M.; Barin, J. S.; Flores, E. M. M.; Microchem. J. 2013,109, 29. 18. Antes, F. G.; Duarte, F. A.; Mesko, M. F.; Nunes, M. A. G.;
Pereira, V. A.; Müller, E. I.; Dressler, V. L.; Flores, E. M. M.;
Talanta2010,83, 364.
19. Kurfürst, U.; Solid Sample Analysis Direct and Slurry Sampling Using GF-AAS and ETV-ICP, Springer: Heidelberg, 1998.
20. Grindlay, G.; Mora, J.; Gras, L.; Loos-Vollebregt, M. T. C.;
Anal. Chim. Acta2009, 652, 154.
21. Masson, P.; Dauthieu, M.; Trolard, F.; Denaix, L.; Spectrochim. Acta, Part B 2007,62, 224.
22. Wu, Y.; Hu, B.; Jiang, Z.; Chen, S.; J. Anal. At. Spectrom. 2002,
17, 121.
23. Resano, M.; Aramendíaz, M.; Devos, W.; Vanhaecke, F.; J. Anal. At. Spectrom.2006, 21, 891.
24. Barth, P.; Hassler, J.; Kudrik, I.; Krivan, V.; Spectrochim. Acta, Part B 2007, 62, 924.
25. Asfaw, A.; Wibetoe, G.; Beauchemin, D.; J. Anal. At. Spectrom.
2012, 27, 1928.
26. Lin, M. -L.; Jiang, S. -J.; J. Anal. At. Spectrom.2011, 9, 1813. 27. Majidi, V.; Smith, R. G.; Xu, N.; McMahon, M. W.; Bossio, R.;
Spectrochim. Acta, Part B2000, 55, 1787.
28. Flores, E. M. M.; Barin, J. S.; Mesko, M. F.; Knapp, G.;
Spectrochim. Acta, Part B2007, 62, 1051.
29. Detcheva, A.; Barth, P.; Hassler, J.; Anal. Bioanal. Chem.2009,
394, 1485.
30. Matousek, J. P.; Satumba, R. T.; Spectrochim. Acta, Part B 1989,
44, 1005.
31. Schäffer, U.; Krivan, V.; Anal. Chem.1999, 71, 849.
32. Ren, J. M.; Salin, E. D.; Spectrochim. Acta, Part B 1994, 49, 555.
33. Kántor, T.; Maestre, S.; Loos-Vollebregt, M. T. C.; Spectrochim. Acta, Part B 2005, 60, 1323.
34. Kántor, T.; Güçer, S.; Spectrochim. Acta, Part B 1999, 54, 763. 35. Grégoire, D. C.; Sturgeon, R. E.; Spectrochim. Acta, Part B
1999, 54, 773.
36. Kántor, T.; Loos-Vollebregt, M. T. C.; Spectrochim. Acta, Part B 2003, 58, 1901.
37. Lu, H. H.; Jiang, S. J.; Anal. Chim. Acta2001, 429, 247. 38. Ho, C. Y.; Jiang, S. J.; J. Anal. At. Spectrom. 2002, 17, 688. 39. Li, Y. C.; Jiang, S. J.; Chen, S. F.; Anal. Chim. Acta1998, 372,
365.
40. Houk, R. S.; Jarvis, K. E.; Gray, A. L.; Handbook of Inductively Coupled Plasma Mass Spectrometry, Blackie & Son Ltd.:
Glasgow, 1992.
Submitted: September 11, 2014
Published online: January 13, 2015