Article
J. Braz. Chem. Soc., Vol. 26, No. 6, 1211-1217, 2015. Printed in Brazil - ©2015 Sociedade Brasileira de Química 0103 - 5053 $6.00+0.00
A
*e-mail: [email protected]
Evaluation of Direct Analysis for Trace Elements in Tea and Herbal Beverages by
ICP-MS
Raquel F. Milani,a,b Marcelo A. Morgano,a Elisabete S. Saron,a Fabio F. Silvac and Solange Cadore*,b
aInstituto de Tecnologia de Alimentos, Av. Brasil, 2880, P.O. Box 139, 13070-178 Campinas-SP, Brazil
bInstituto de Química, Universidade Estadual de Campinas, P.O. Box 6154,
13083-970 Campinas-SP, Brazil
cAgilent Technologies Brasil Ltda., Av. Marcos Penteado de Ulhoa Rodrigues, 939,
06460-040 Barueri-SP, Brazil
In general, inductively coupled plasma mass spectrometry (ICP-MS) food analysis requires numerous sample treatment steps that imply an increase of analysis time and the use of chemicals. In this study, the main objective was to evaluate the applicability of the direct analysis by ICP-MS to determine twelve elements (Al, As, Ba, Cd, Cr, Cu, Fe, Mn, Ni, Pb, Se and Zn) in tea and herbal beverages. Direct analysis method was compared with two other sample treatments: minimum treatment (acid dilution) and using a destructive method (microwave assisted digestion). Besides the lowest time of analysis, direct analysis provides a reliable response and agrees with the “green chemistry” principles. High sensitivity was also observed by low values of limits of detection and quantification, in general, below 2.5 µg L-1. The method accuracy was evaluated by spiked
experiments and values ranged between 82 and 120%. Low values of coefficient of variation were also observed, 2 to 17%, for all analytes. The method exhibited applicability for commercial tea samples as well as for drinks made by herb infusion.
Keywords: tea, trace elements, direct analysis, ICP-MS
Introduction
Traditionally known as a beverage made by brewing the leaves of Camellia sinensis, tea is one of the most consumed non-alcoholic drink around the world due to its nutritional importance as a source of several minerals (e.g., Fe, Mn, K, and Zn) and antioxidants such as catechin and flavonoids.1-3 The health benefits related to tea consumption
also include the prevention of diseases, such as skin cancer, myocardial infarction, and Parkinson’s disease,4 as well as
the reduction of cholesterol levels in the blood and the risk for type 2 diabetes.5
The inorganic components of teas include essential minerals such as Cu, Fe, Mn, and Zn and non-essential minerals or contaminants such as As, Cd, and Pb.6,7 The
accumulation of trace elements in tea leaves is based on the acidophilic nature of their plants: metal dissolution increases in acidic soils compared with neutral or alkaline soils.8 Aluminum absorption, for example, occurs via
passive diffusion from the soil to the leaves during the plant’s life9,10 and can have toxic effects in humans,
particularly those with chronic renal diseases.6
Trace elements are usually quantified by spectrometric techniques, such as graphite furnace atomic absorption spectrophotometry (GFAAS),11 flame atomic absorption
spectrometry,12,13 inductively coupled plasma optical emission
spectrometry (ICP OES)14,15 and inductively coupled plasma
mass spectrometry (ICP-MS).13 Plasma emission techniques
are especially attractive for trace element analysis in tea due to their low values of limits of detection, wide concentration ranges and simultaneous or fast sequential quantification.16,17
Other techniques such as X-ray fluorescence spectrometry (XRFS)18 and neutron activation analysis (NAA)19 are also
applied to tea samples. Direct XRFS analysis is usually used with partial least squares regression (PLS) due to its strong matrix and inter-element effects.20 Nonetheless, it is
well known that one of the most important interferences in spectrometric analysis is the organic matrix.21
microwave-assisted digestion22,23 or direct analysis after
sample dilution or acidification with HNO324 or even
undiluted or unacidified samples.25 However, few works
described direct analysis and ICP techniques, and almost all of them have used ICP OES.2 Although ICP-MS provides
low values of limits of detection (LOD) and quantification (LOQ), matrix effects and mass interferences must be evaluated and corrected in order to obtain a reliable instrumental report. According to our best knowledge, there is no work on the evaluation of direct analysis and ICP-MS for the determination of Al, As, Ba, Cd, Cr, Cu, Fe, Mn, Ni, Pb, Se, and Zn in tea and herbal drinks.
Motivated by the increasing consumption of tea and herbal beverages26 and considering all the aspects reported
above, the main purpose of this study is to verify the applicability of the direct analysis and ICP-MS for the determination of inorganic constituents in tea and herbal beverages sold in Brazil. For this, the direct analysis was compared to other sample treatment procedures, validated and applied for tea and herbal beverages (soft drinks and the ones prepared by brewing the leaves).
Experimental
Reagents
Materials utilized in analysis were previously decontaminated using 5% (v/v) HNO3 bath for at least 12 h
and thus rinsed with deionized water. Distilled nitric acid (Sub-Boiling Distillacid, Berghof, Eningen, Germany) and reverse osmosis-purified water (Gehaka, São Paulo, Brazil, 18.2 MΩ cm) were applied for all analyses.
Analytical curves were prepared by successive dilutions of a 1000 mg L-1 certified standard solutions (Merck,
Darmstadt, Germany): 0.1-100 µg L-1 for As, Cd, Cr, Cu,
Ni, Pb and Se and 10-2000 µg L-1 for Al, Ba, Fe, Mn and
Zn in 0.2% (v/v) nitric acid. Internal standard solution of 250 µg L-1 Sc, Ge and Y was obtained by dilution of
100 mg L-1 certified standard solutions (Specsol, São Paulo,
Brazil) in 0.2% (v/v) nitric acid.
Instrumentation
An inductively coupled plasma mass spectrometer (7700x, Agilent Technologies, Tokyo, Japan) equipped with octopole reaction system (ORS) using He as collision gas, a discrete sampling introduction system (ISIS-DS) and auto sampler with 89 positions (Agilent Technologies, Tokyo, Japan) was used for fast sequential determination of Al, As, Ba, Cd, Cr, Cu, Fe, Mn, Ni, Pb, Se and Zn. Experimental conditions are described in Table 1.
Samples and analytical procedure
Samples of ten tea and herbal leaves were purchased at local markets in southeastern of Brazil: black, green and white teas (Camellia sinensis); boldo (Pneumus boldus
Molina); lemongrass (Cymbopogon citratus); mate
(Ilex paraguariensis) and strawberry fruits (a mix consisting of Fragaria spp. and Pyrus malus L. fruits and Hibiscus sabdariffa l. flowers). Origin or age (young or old) of the herbal leaves was unavailable. Two types of samples were analyzed: beverages prepared by brewing the leaves and soft drinks usually sold in aluminum cans and mixed with lemon or peach juice.
Infusions were prepared considering the recommended proportion for consumption: 1 bag (ca. 1.5 g) for a cup of 200 mL. Boiling water was added to the leaves and kept for 3 min covered with a watch glass.27 A 250
µm
polymeric membrane was used for filtration and, after cooling, beverages were acidified with distilled nitric acid to obtain a 0.2% (v/v) acid concentration. For soft drinks, samples were degassed in ultrasonic bath (Cristófoli, Campo Mourão, Paraná, Brazil) for 8 min and also acidified with distilled nitric acid to reach an acid concentration of 0.2% (v/v). All analyses were carried out in triplicate and analytical blanks were also prepared following the same procedure used for the samples.
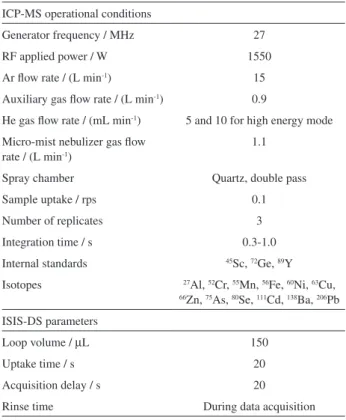
Table 1. Operational conditions for ICP-MS and ISIS-DS used for trace element quantification
ICP-MS operational conditions
Generator frequency / MHz 27
RF applied power / W 1550
Ar flow rate / (L min-1) 15
Auxiliary gas flow rate / (L min-1) 0.9
He gas flow rate / (mL min-1) 5 and 10 for high energy mode
Micro-mist nebulizer gas flow rate / (L min-1)
1.1
Spray chamber Quartz, double pass
Sample uptake / rps 0.1
Number of replicates 3
Integration time / s 0.3-1.0 Internal standards 45Sc, 72Ge, 89Y
Isotopes 27Al, 52Cr, 55Mn, 56Fe, 60Ni, 63Cu, 66Zn, 75As, 80Se, 111Cd, 138Ba, 206Pb
ISIS-DS parameters
Loop volume / µL 150
Uptake time / s 20
Acquisition delay / s 20
Evaluation of contact time between boiling water and tea leaves in beverage preparation
The contact time between boiling water and tea leaves during the beverage preparation is important to evaluate the extraction of inorganic contaminants from the tea leaves.2,14
Beverages of three different types of tea were prepared keeping boiling water in contact for 3, 5, 10 and 15 min with the herbal leaves. The final solutions were analyzed by ICP-MS.
Evaluation of method
Analytical curves were prepared by external calibration and analyte addition using beverages prepared by the brew of two different tea leaves. The concentrations were the same for both curves and blank solutions were prepared using nitric acid solution or tea acidified beverage.
The evaluation of method was also carried out by the analysis of green tea beverages (n = 15) using different procedures: direct sample vs. acid dilution and direct sample
vs. microwave assisted digestion.28 Blank experiments were
also used in each method.
Method A: direct analysis
This method consisted in performing the analysis without sample treatment steps. Tea and herbal beverages (previously acidified to 0.2% (v/v) HNO3 concentration)
were transferred to ICP-MS autosampler vials for trace element quantification.
Method B: acid dilution
In this method, the analysis was performed using a minimum sample treatment. Five mL of each beverage and 5 mL of 0.2% (v/v) HNO3 were transferred to a
10 mL volumetric flask and the resultant solutions were transferred to ICP-MS autosampler vials for quantification.
Method C: microwave assisted digestion
In this method, trace element analysis was carried out using a destructive sample treatment: closed microwave digestion (Start D, Milestone, Sorisole, Italy). An aliquot of 2.5 mL of sample was transferred to a Teflon polytetrafluoroethylene (PTFE) digestion vessel, and 5 mL of purified water and 5 mL of distilled HNO3 were
added. Sample decomposition was performed at maximum temperature of 160 ºC for 25 min and the final solutions were transferred to 25 mL volumetric flasks using purified water before analysis by ICP-MS.
Method validation and quality control
The analytical method was validated according to Instituto Nacional de Metrologia, Qualidade e Tecnologia (Inmetro).29 The correlation coefficient (with r2≥ 0.999),
LOD and LOQ, precision and accuracy were verified using beverages spiked with the analytes at different levels. For evaluation, analyses were performed in triplicate and analytical blanks were prepared following the same procedure used for samples.
Results and Discussion
Method and matrix interference evaluation
Although direct analysis consists in a simple and fast procedure (approximately 2 min for measurement time), the organic compounds are not completely eliminated and may cause interferences in trace element quantification.21
To verify matrix effect, the applicability of direct analysis method and ICP-MS was evaluated comparing the results obtained with the ones using sample treatment procedures: minimum sample treatment (acid dilution) and a destructive method (microwave assisted digestion). To provide these data, green tea beverages were analyzed and experimental results as well as statistical analysis (Wilcoxon matched pairs test) are presented in Table 2. Initially, green tea beverages (n = 15) were spiked with 20 µg L-1 of each analyte in order to provide analytical
response for all the twelve trace elements, and were then analyzed using three different sample treatment procedures:
Table 2. Results (mean value and standard deviation) for green tea samples spiked with 20 µg L-1 of analytes using direct analysis (method A), acid
dilution (method B) and microwave digestion (method C)
Element Green tea / (µg L
-1)
Method A Method B Method C Al 8250 ± 1111 9428 ± 979 7855 ± 170
As 20.5 ± 2.1 21.6 ± 1.4 18.0 ± 1.2 Ba 67.0 ± 9.2 71.5 ± 7.7 63.8 ± 1.8
Cd 19.4 ± 7.3 23.4 ± 4.5 19.7 ± 0.6 Cr 19.0 ± 0.8 19.9 ± 0.9 22.2 ± 0.9 Cu 39.4 ± 16.2 44.6 ± 12.4 41.2 ± 5.9
Fe 61.5 ± 7.8 68.4 ± 4.5 50.2 ± 16.2 Mn 3905 ± 528 4343 ± 436 3560 ± 66
Ni 45.5 ± 2.1 47.2 ± 1.6 47.5 ± 1.4 Pb 20.1 ± 2.8 22.9 ± 1.8 19.3 ± 1.1 Se 17.9 ± 0.8 17.8 ± 0.9 17.2 ± 0.9
direct analysis (method A), acid dilution (method B) and microwave assisted digestion (method C).
Data from Table 2 were submitted to statistical tests in order to verify differences at 99% confidence level. At first, the variance of the results provided by methods A, B and C were evaluated using F-test and statistical differences at 99% confidence level for some trace elements were observed (Fcalc > F99%). Therefore, the median values were
compared using the non-parametric Wilcoxon matched pairs test. The test was performed using Statistica software (StatSoft, Tulsa, OK, USA) and consisted in comparing the mean results provided by method A with the ones obtained by method B and C. For all analytes, the test demonstrated that there is no statistical difference at 99% confidence level for all trace elements evaluated (p > 0.01).
Considering these aspects, it is possible to conclude that direct analysis method provides an equivalent measure to the methods which contain sample treatment steps since there is no statistical difference at 99% confidence level for all trace elements evaluated.
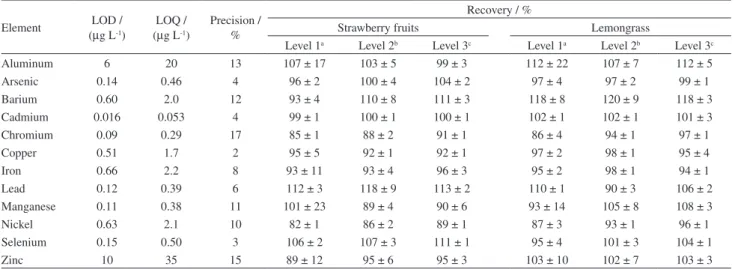
Method validation
The experimental results obtained for the method validation are shown in Table 3. LOD and LOQ were calculated as 3 and 10 times the standard deviation of 10 analytical blanks. For some elements (Al, As, Cd and Zn) analytical blanks were spiked in a level near the lowest concentration of the analytical curve in order to provide a quantitative response. As beverages were prepared simulating the consumers’ consumption, the dilution factor is equal to 1.
The accuracy was evaluated by spiked experiments. Triplicates of infusions of two different teas (strawberry
fruits and lemongrass) were spiked with three different concentration levels (As, Cd, Cr, Cu, Ni, Pb and Se at 10, 25 and 50 µg L-1 and Al, Ba, Fe, Mn and Zn at 50, 250 and
500 µg L-1). The precision of the method was determined
by the analysis of 16 tea infusions spiked at 25 µg L-1 level
in two different days (8 replicates per day).
Analytical curves were obtained with a correlation coefficient (r) equal or close to 1 (r > 0.999) and the LOD and LOQ values obtained were considered adequate for herbal beverage analysis. Recovery tests were performed using different types of tea in order to provide data for samples basically consisting of flowers and fruits and of herbal leaves. Experimental results were satisfactory for all levels within a range of 82 to 120% in agreement with AOAC.30
Additionally, the precision of the measurement (expressed as coefficient of variation) for samples analyzed in two different days presented a small percentage, 2 to 17%.
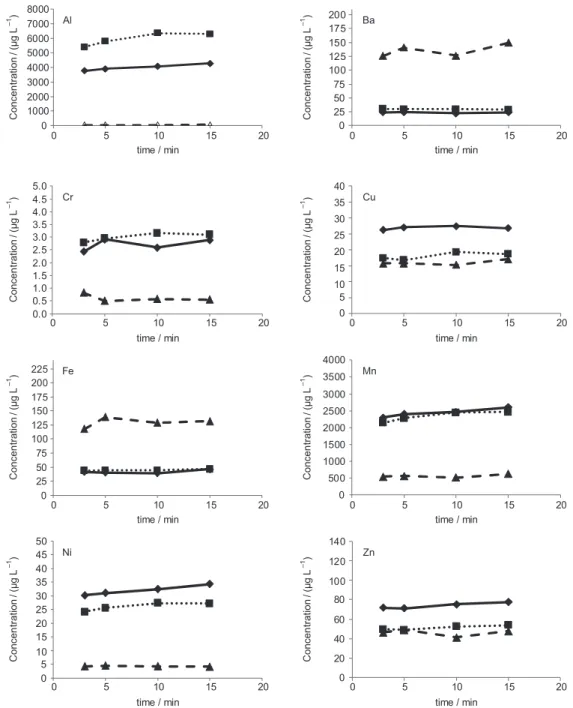
Evaluation of contact time between boiling water and tea leaves
Different procedures for tea brewing are described in the literature2,31 and for this study the predominant
manufacturer recommendation of consumption were assumed: proportion of 1 bag with tea leaves (ca. 1.5 g) for a cup of tea (200 mL). In order to verify the effect of increasing the contact time with the leaves, three different tea infusions (white, green and flower and fruits) were prepared using 3, 5, 10 and 15 min for contact time with boiling water. The results obtained are shown in Figure 1.
For all the trace elements studied an approximately linear behavior was observed demonstrating that beverages prepared in the range from 3 to 15 min have similar
Table 3. Method validation: limits of detection (LOD) and quantification (LOQ), precision and accuracy (spiked in three levels)
Element LOD / (µg L-1)
LOQ / (µg L-1)
Precision / %
Recovery / %
Strawberry fruits Lemongrass
Level 1a Level 2b Level 3c Level 1a Level 2b Level 3c
Aluminum 6 20 13 107 ± 17 103 ± 5 99 ± 3 112 ± 22 107 ± 7 112 ± 5
Arsenic 0.14 0.46 4 96 ± 2 100 ± 4 104 ± 2 97 ± 4 97 ± 2 99 ± 1
Barium 0.60 2.0 12 93 ± 4 110 ± 8 111 ± 3 118 ± 8 120 ± 9 118 ± 3
Cadmium 0.016 0.053 4 99 ± 1 100 ± 1 100 ± 1 102 ± 1 102 ± 1 101 ± 3
Chromium 0.09 0.29 17 85 ± 1 88 ± 2 91 ± 1 86 ± 4 94 ± 1 97 ± 1
Copper 0.51 1.7 2 95 ± 5 92 ± 1 92 ± 1 97 ± 2 98 ± 1 95 ± 4
Iron 0.66 2.2 8 93 ± 11 93 ± 4 96 ± 3 95 ± 2 98 ± 1 94 ± 1
Lead 0.12 0.39 6 112 ± 3 118 ± 9 113 ± 2 110 ± 1 90 ± 3 106 ± 2
Manganese 0.11 0.38 11 101 ± 23 89 ± 4 90 ± 6 93 ± 14 105 ± 8 108 ± 3
Nickel 0.63 2.1 10 82 ± 1 86 ± 2 89 ± 1 87 ± 3 93 ± 1 96 ± 1
Selenium 0.15 0.50 3 106 ± 2 107 ± 3 111 ± 1 95 ± 4 101 ± 3 104 ± 1
Zinc 10 35 15 89 ± 12 95 ± 6 95 ± 3 103 ± 10 102 ± 7 103 ± 3
aLevel 1: As, Cd, Cr, Cu, Ni, Pb, Se at 10 µg L-1 and Al, Ba, Fe, Mn, Zn at 50 µg L-1; blevel 2: As, Cd, Cr, Cu, Ni, Pb, Se at 25 µg L-1 and Al, Ba, Fe, Mn,
inorganic composition. Other trace elements were not presented due to their low concentration (below LOQ) in the tea beverages. These results are similar to those found in the literature which claim highest extraction of elements in the first five minutes of brewing.2 In view of that, the
Brazilian recommendation was assumed for the sample analysis: herbal leaves were kept in contact with boiling water for 2-3 min.27
Analysis of tea samples sold in Brazil
Ten samples (soft drinks and herbal infusions) sold in southeastern Brazilian markets were analyzed using the
direct analysis method and ICP-MS. The results obtained are presented in Table 4.
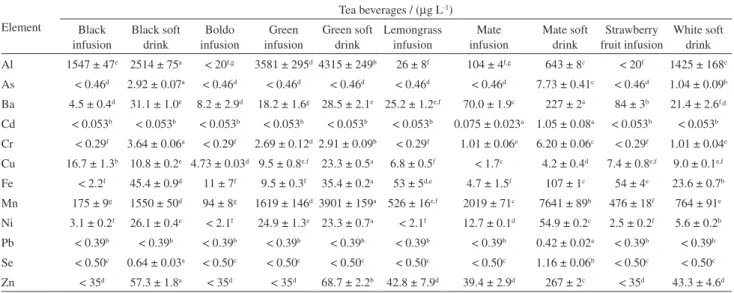
As observed in Table 4, there is variability for beverages from different herbal leaves. According to the one-way analysis of variance (ANOVA) and Tukey’s test results, there was low variability between the trace elements present in the boldo, lemongrass and strawberry teas studied. Nevertheless, a significant statistical variation was observed for some tea leaves: Al levels in the black, green, mate and white teas; Ba, Cr, Fe and Zn levels in the mate tea and As in the black, mate and white teas. The presence of trace elements in plants are affected by soil, nutrients and agrochemical inputs32,33 and also by the soil characteristics,
Figure 1. Effect of time contact between boiling water and tea leaves ( white tea infusion; green tea infusion; flower and fruits (F&F) tea infusion). Al 0 1000 2000 3000 4000 5000 6000 7000 8000
0 5 10 15 20
Concen tration / (µ g L ) –1 Concen tration / (µ g L ) –1
time / min
Ba 0 25 50 75 100 125 150 175 200
0 5 10 15 20
time / min
Concen tration / (µ g L ) –1 Concen tration / (µ g L ) –1 Cr 0.0 0.5 1.0 1.5 2.0 2.5 3.0 3.5 4.0 4.5 5.0
0 5 10 15 20
time / min
Cu 0 5 10 15 20 25 30 35 40
0 5 10 15 20
time / min
Concen tration / (µ g L ) –1 Concen tration / (µ g L ) –1 Fe 0 25 50 75 100 125 150 175 200 225
0 5 10 15 20
time / min
Mn 0 500 1000 1500 2000 2500 3000 3500 4000
0 5 10 15 20
time / min
Concen tration / (µ g L ) –1 Concen tration / (µ g L ) –1 Ni 0 5 10 15 20 25 30 35 40 45 50
0 5 10 15 20
time / min
Zn 0 20 40 60 80 100 120 140
0 5 10 15 20
especially the pH.1 Some plants, such as Camellia sinensis,
are known as Al accumulators and the highest levels are found in the aerial parts of these plants.34,35 In this study,
the teas of Camellia sinensis leaves (black, green and white tea) presented the highest values observed for Al. Moreover, the samples conditioned in aluminum cans showed higher levels of Al, Ba, Mn and Zn comparing to the teas made by infusion of the leaves. This might be due to industrial beverage preparation or fruit addition,36 usually lemon or
peach, or even by migration of elements from the cans to the beverages.37,38
In general, the levels found in this study were similar to those described by Fernández et al.14 who evaluated
inorganic elements in a few varieties of black and green tea (infusions, instant and tea soft drinks) using ICP OES and multivariate analysis. Özcan et al.15 found higher levels of
Al, Cr, Fe, Mn and Zn in black and green tea beverages from Turkey than the concentration found in the present study as well as Szymczycha-Madeja et al.,39 who analyzed several
minerals in samples of peppermint and chamomile tea and obtained higher values of Ba, Cu, Fe, Mn, Ni and Zn in the beverages. Marchisio et al.40 quantified Pb in beverages
of mate tea from Argentina using ultrasonic nebulization associated with ICP OES and also found high levels for this element. However, differences between values found in the samples from this study and data available in the literature may result from the use of different procedures of the beverages’ preparation or even the origin41 of the
herbal leaves used.
The results presented in Table 4 were analyzed considering the maximum limits established by the Brazilian regulation and Mercosul:42 0.05 mg kg-1 for As
and Pb; 0.02 mg kg-1 for Cd in non-alcoholic beverages
(excluding juice). For Cr and Ni, Brazilian regulation43
also sets 0.10 and 5.00 mg kg-1, respectively, as maximum
tolerance level for any type of food. The levels found for the analytes in the different types of teas were lower than those limits and, therefore, do not represent a health risk.
Conclusions
A fast, simple and multi element method was evaluated and its applicability to tea and herbal beverages was also demonstrated. The direct analysis coupled to ICP-MS technique was compared with two other methods (acid dilution and microwave assisted digestion) and the results obtained were very similar for all of them. The method was validated and, due to the dilution factor equal to 1, low values of limits of detection and quantification were obtained. Satisfactory values for accuracy and precision (evaluated using coefficient of variation for sample analysis in different days) were also obtained: 82 to 120% and 2 to 17%, respectively.
Different contact times between boiling water and tea leaves were evaluated and no difference was observed when 3 or 15 min were used. The proposed procedure was applied to ten samples sold in Brazil and the results showed that the concentration of some trace elements (Al, Ba, Fe and Mn) were higher in soft drinks than in leaf infusions. Aspects related to beverage preparation, can material and the addition of lemon or peach in the teas may lead to this high concentration, showing that efforts in monitoring trace elements should be incentivized.
Table 4. Evaluation of Al, As, Ba, Cd, Cr, Cu, Fe, Mn, Ni, Pb, Se and Zn in tea beverages
Element
Tea beverages / (µg L-1)
Black infusion
Black soft drink
Boldo infusion
Green infusion
Green soft drink
Lemongrass infusion
Mate infusion
Mate soft drink
Strawberry fruit infusion
White soft drink Al 1547 ± 47e 2514 ± 75a < 20f,g 3581 ± 295d 4315 ± 249b 26 ± 8f 104 ± 4f,g 643 ± 8c < 20f 1425 ± 168e
As < 0.46d 2.92 ± 0.07a < 0.46d < 0.46d < 0.46d < 0.46d < 0.46d 7.73 ± 0.41c < 0.46d 1.04 ± 0.09b
Ba 4.5 ± 0.4d 31.1 ± 1.0e 8.2 ± 2.9d 18.2 ± 1.6g 28.5 ± 2.1e 25.2 ± 1.2e,f 70.0 ± 1.9c 227 ± 2a 84 ± 3b 21.4 ± 2.6f,g
Cd < 0.053b < 0.053b < 0.053b < 0.053b < 0.053b < 0.053b 0.075 ± 0.023a 1.05 ± 0.08a < 0.053b < 0.053b
Cr < 0.29f 3.64 ± 0.06a < 0.29f 2.69 ± 0.12d 2.91 ± 0.09b < 0.29f 1.01 ± 0.06e 6.20 ± 0.06c < 0.29f 1.01 ± 0.04e
Cu 16.7 ± 1.3b 10.8 ± 0.2e 4.73 ± 0.03d 9.5 ± 0.8e,f 23.3 ± 0.5a 6.8 ± 0.5f < 1.7c 4.2 ± 0.4d 7.4 ± 0.8e,f 9.0 ± 0.1e,f
Fe < 2.2f 45.4 ± 0.9d 11 ± 7f 9.5 ± 0.3f 35.4 ± 0.2a 53 ± 5d,e 4.7 ± 1.5f 107 ± 1c 54 ± 4e 23.6 ± 0.7b
Mn 175 ± 9g 1550 ± 50d 94 ± 8g 1619 ± 146d 3901 ± 159a 526 ± 16e,f 2019 ± 71c 7641 ± 89b 476 ± 18f 764 ± 91e
Ni 3.1 ± 0.2f 26.1 ± 0.4e < 2.1f 24.9 ± 1.3e 23.3 ± 0.7a < 2.1f 12.7 ± 0.1d 54.9 ± 0.2c 2.5 ± 0.2f 5.6 ± 0.2b
Pb < 0.39b < 0.39b < 0.39b < 0.39b < 0.39b < 0.39b < 0.39b 0.42 ± 0.02a < 0.39b < 0.39b
Se < 0.50c 0.64 ± 0.03a < 0.50c < 0.50c < 0.50c < 0.50c < 0.50c 1.16 ± 0.06b < 0.50c < 0.50c
Acknowledgements
The authors acknowledge FAPESP (Process 2012/19142-7), CAPES, CNPQ and Agilent Technologies Brazil for their financial support.
References
1. Karak, T.; Bhagat, R. M.; Food Res. Int.2010, 43, 2234. 2. Szymczycha-Madeja, A.; Welna, M.; Pohl, P.; TrAC, Trends
Anal. Chem. 2012, 35, 165.
3. Flaten, T. P.; Coord. Chem. Rev. 2002, 228, 385.
4. Jin, C. W.; He, Y. F.; Zhang, K.; Zhou, G. D.; Shi, J. L.; Zheng, S. J.; Chemosphere2005, 61, 726.
5. Pinto, M.; Food Res. Int. 2013, 53, 558.
6. Malik, J.; Frankova, A.; Drabek, O.; Szakova, J.; Ash, C.; Kokoska, L.; Food Chem. 2013, 139, 728.
7. Łozak, A.; Sołtyk, K.; Ostapczuk, P.; Fijałek, Z.; Sci. Total Environ. 2002, 289, 33.
8. Karak, T.; Abollino, O.; Bhattacharyya, P.; Das, K.; Paul, R.; Chemosphere2011, 85, 948.
9. Hayacibara, M. F.; Queiroz, C. S.; Tabchoury, C. P. M.; Cury, J. A.; Rev. Saude Publica2004, 28, 100.
10. Ruan, J.; Wong, M. H.; Environ. Geochem. Health2001, 23, 53. 11. Mandiwana, K. L.; Panichev, N.; Panicheva, S.; Food Chem.
2011, 129, 1839.
12. Gallaher, R. N.; Gallaher, K.; Marshall, A. J.; Marshall, A. C.;
J. Food Compos. Anal. 2006, 19, S53. 13. Pohl, P.; Prusisz, B.; Talanta2006, 69, 1227.
14. Fernández, P. L.; Pablos, F.; Martín, M. J.; González, A. G.; Food Chem. 2002, 76, 483.
15. Özcan, M. M.; Ünver, A.; Uçar, T.; Arslan, D.; Food Chem.
2008, 106, 1120.
16. Krejčová, A.; Černohorský, T.; Food Chem. 2003, 82, 303. 17. Şahan, Y.; Basoglu, F.; Gücer, S.; Food Chem. 2007, 105, 395. 18. Salvador, M. J.; Lopes, G. N.; Nascimento Filho, V. F.; Zucchi,
O. L. A. D.; X-Ray Spectrom. 2002, 31, 141.
19. Mahani, M. K.; Maragheh, M. G.; Food Anal. Method.2011, 4, 73.
20. Pereira, F. M. V.; Pereira-Filho, E. R.; Bueno, M. I. M. S.; J. Agric. Food Chem. 2006, 54, 5723.
21. Nardi, E. P.; Evangelista, F. S.; Tormen, L.; Saint’Pierre, T. D.; Curtius, A. J.; Souza, S. S.; Barbosa Jr., F.; Food Chem. 2009,
112, 727.
22. Nookabkaew, S.; Rangkadilok, N.; Satayavivad, J.; J. Agric.
Food Chem. 2006, 54, 6939.
23. Mossion, A.; Potin-Gautier, M.; Delerue, S.; Le Hécho, I.; Behra, P.; Food Chem. 2008, 106, 1469.
24. Flaten, A.-K.; Lund, W.; Sci. Total Environ. 1997, 207, 21. 25. Street, R.; Drábek, O.; Száková, J.; Mládková, L.; Food Chem.
2007, 104, 1662.
26. Malik, J.; Szakova, J.; Drabek, O.; Balik, J.; Kokoska, L.; Food
Chem. 2008, 111, 520.
27. Agência Nacional de Vigilância Sanitária (Anvisa);
Esclarecimentos sobre a Regulamentação de Chás, Informe Técnico No. 45, 2010.
28. Welna, M.; Szymczycha-Madeja, A.; Food Chem. 2014, 159, 414.
29. Instituto Nacional de Metrologia, Normalização e Qualidade Industrial (Inmetro); Orientação Sobre Validação de Métodos
Analíticos, DOQ-CGCRE-008, rev. 04, 1-20, 2011.
30. Association of Official Agricultural Chemists (AOAC);
Guidelines for Single Laboratory Validation of Chemical
Methods for Dietary Supplements and Botanicals; AOAC International: Rockville, MD, 2002.
31. Aldars-García, L.; Zapata-Revilla, M. A.; Tenorio-Sanz, M. D.;
J. Food Nutr. Res. 2013, 52, 172.
32. Dambiec, M.; Polechonska, L.; Klink, A.; J. Food Compos.
Anal. 2013, 31, 62.
33. Seenivasan, S.; Manikandan, N.; Muraleedharan, N. N.; Selvasundaram, R.; Food Control2008, 19, 746.
34. Morita, A.; Horie, H.; Fujii, Y.; Takatsu, S.; Watanabe, N.; Yagi, A.; Yokota, H.; Phytochemistry2004, 65, 2775. 35. Morita, A.; Yanagisawa, O.; Takatsu, S.; Maeda, S.; Hiradate, S.;
Phytochemistry2008, 69, 147.
36. Frankowski, M.; Food Anal. Method. 2014, 7, 1109.
37. Dantas, S. T.; Soares, B. M. C.; Saron, E. S.; Dantas, F. B. H.; Gatti, J. A. B.; Kiyataka, P. H. M.; Packag. Technol. Sci. 2014,
27, 449.
38. Dantas, S. T.; Saron, E. S.; Dantas, F. B. H.; Yamashita, D. M.; Kiyataka, P. H. M.; Cienc. Tecnol. Aliment.2007, 27, 291. 39. Szymczycha-Madeja, A.; Welna, M.; Zyrnicki, Z.; J. Braz.
Chem. Soc.2013, 24, 777.
40. Marchisio, P. F.; Sales, A.; Cerutti, S.; Marchevski, E.; Martinez, L. D.; J. Hazard. Mater.2005, 124, 113.
41. Moreda-Piñeiro, A.; Fisher, A.; Hill, S. J.; J. Food Compos.
Anal. 2003, 16, 195.
42. Agência Nacional de Vigilância Sanitária (Anvisa); Dispõe
sobre o Regulamento Técnico MERCOSUL sobre Limites
Máximos de Contaminantes Inorgânicos em Alimentos, Resolução RDC 42/13, 2013.
43. Agência Nacional de Vigilância Sanitária (Anvisa); Modifica
o Decreto No. 50.040, de 24 de janeiro de 1961, Referente a
Normas Reguladoras do Emprêgo de Aditivos para Alimentos,
Alterado pelo Decreto No. 691, de 13 de março de 1962, Decreto No. 55871, 1965.
Submitted: February 10, 2015
Published online: April 7, 2015