Article
Printed in Brazil - ©2017 Sociedade Brasileira de Química0103 - 5053 $6.00+0.00
*e-mail: [email protected]
Simultaneous Determination of Nonylphenol and Nonylphenol Ethoxylates in
Wastewater Samples from Biodegradation Process by High Performance Liquid
Chromatography Method
Yuanhua Xie,a Shiyu Ma,a Chunli Yuan,a Yahong Pan,b Qiao Wang,c Ye Xu,c Tong Zhu,*,a
Youzhao Wang,a Jin Hana and Meiyan Youa
aSchool of Mechanical Engineering and Automation, Northeastern University, 3-11, Wenhua Road,
Heping District, 110004 Shenyang, China
bSinosteel Anshan Research Institute of Thermo Energy Co., Ltd, 301, Anqian Road,
Gaoxin District, 114004 Anshan, China
cCollege of Science, Northeastern University, 3-11, Wenhua Road, Heping District,
110004 Shenyang, China
The degradation products of nonylphenol ethoxylates (NPnEO), nonylphenol (NP) and short-chain NPnEO are representative of environmental endocrine disruptors. They possess strong lipophilicity, toxicity, cumulative property and estrogenic effect. They can pollute the environment, cause body precocious, and induce the body’s estrogen-sensitive cancer cell proliferation. A fast method using high performance liquid chromatography (HPLC) was developed to simultaneously quantify NP and 11 kinds of NPnEO in wastewater samples. The influence of mobile phase composition, mobile phase ratio, mobile phase flow rate, column temperature and sample injection volume on the separation effect was studied. Under the optimized conditions, NP and 11 kinds of NPnEO were separated successfully within 35 min. The method showed good linearity for NP and 11 kinds of NPnEO (n = 1-11). The linear correlation coefficients for the standard curves were 0.9720- 0.9999. The precision degree of the method was reliable and all the relative standard deviation (RSD) values (n = 0-11) obtained were less than 5.0%.
Keywords: chromatographic condition, high performance liquid chromatography (HPLC), nonylphenol (NP), nonylphenol ethoxylates (NPnEO), simultaneous determination
Introduction
In recent years, it was discovered that the endocrine disruptors in the environment could interact with the endocrine system in organism even with a small dosage. Endocrine disruptors perturb the synthesis, secretion, transport, metabolism, binding action, or elimination of
endogenous hormones.1 These endocrine disruptors not
only pollute the environment but also cause a serious threat to people’s health. The monitoring, analysis and inorganic treatment of these endocrine disruptors have attracted an
increasing attention.1-5
Nonylphenol (NP) and nonylphenol ethoxylates (NPnEO) of short chain (n = 1, 2) are typical endocrine
disruptors.2,6 NP and short chain nonylphenol ethoxylates
(SC-NPnEO) possess strong lipophilicity, toxicity,
cumulative property and estrogenic effect.2,6,7 They are the
main degradation products of long chain NPnEO, which
are the most commonly used nonionic surfactants.2,7-9
Currently, the harmless treatment of NPnEO has become a hot topic in the environmental field. A lot of researches about the physicochemical or biological degradation of NP
and NPnEO have been carried out.5,8,10-12
The anoxic-oxic activated sludge process (AOASP) is mainly combined with an anoxic unit, an oxic unit and
a settlement unit.11 The wastewater is introduced into the
sludge. A lab-scale AOASP was established to treat the synthetic long chain mixed NPnEO wastewater. In order to detect and quantify the composition of NP and NPnEO in wastewater samples from the AOASP, a method aimed at the simultaneous determination of NP and NPnEO (n = 1-11) was established in this study.
At present, gas chromatography-mass spectrometry (GC-MS) and high performance liquid chromatography (HPLC) are the main detection methods for determining
NP and NPnEO.3,9,13-16 However, GC-MS is much more
expensive and suitable for the analysis of small molecules
such as NP and NPnEO (n < 4).14-16 In this study, according
to the properties of target detection objects, the economical and practical HPLC method was chosen to determine NP and NPnEO (n = 1-11) in wastewater samples from biodegradation process. The influence of mobile phase composition, mobile phase ratio, mobile phase flow rate, column temperature and sample injection volume on the separation effect was investigated in detail. The linearity, linear correlation coefficient, relative standard deviation (RSD) and average recovery of this method were also studied. A simple, fast and reliable measuring method for NP and NPnEO (n = 1-11) was established and it is expected to offer helps for related researches.
Experimental
Experimental instruments and reagents
HPLC equipment used was Waters 2695 (Waters, USA), combined with 2487-UV detector and Hypersil APS-2 amino chromatographic column (250 × 4.6 mm, 5 µm, Thermo Electron, USA).
Isopropanol (C3H8O), n-hexane (C6H14) and
dichloromethane (CH2Cl2) were chromatographically pure
chemicals from Tianjin Concord, China. Standard reagents of NP and mixed NPnEO (average n ca. 2 and 5) were from Tokyo Chemical Industry Co. LTD, Japan. The standard stock was prepared using isopropanol with NP, mixed P2EO and mixed NP5EO concentrations of 1074, 2140
and 4920 µg mL-1, respectively. During the optimization
process, the used mixed standard solution was composed of: 10 times diluent of NP stock, 5 times diluent of NP2EO stock and 2.5 times diluent of NP5EO stock. Finally the NP, mixed NP2EO and mixed NP5EO concentrations were
107.4, 428.0 and 1968 µg mL-1, respectively.
Pretreatment of wastewater samples
The used wastewater samples were the synthetic long chain mixed NPnEO influent and the effluent of the lab-scale
AOASP. The wastewater samples were centrifuged for 5 min under 6000 rpm to remove the suspended solids. Then the supernatant was filtrated by a 0.45 µm organic membrane. 50 mL of diluted filtrate (influent for 12.5 times, effluent without dilution) was pipetted into 125 mL separating
funnel, then 0.5 mL of 1 mol L-1 HCl and 2.5 g NaCl were
added, and shaken well. After that, it was added 5 mL of dichloromethane, shaken for 2 min, stood for 20 min, and then the lower organic phase was collected, which was centrifuged at 5000 rpm for 10 min. Afterwards, the centrifuged upper water phase was moved back into the separating funnel, 5 mL of dichloromethane was added, and then the extraction and centrifugation processes were repeated. The centrifuged lower organic phase of two centrifugation processes was filtered to remove the floccules, then the filtrate was evaporated at 40 °C to dryness, the residue was dissolved with isopropanol, made to 2 mL, and filtered by 0.45 µm organic filtration membranes. The pretreated sample was finally achieved. The influent was concentrated for 2 times and the effluent was concentrated for 25 times.
In the Results and Discussion section (Wastewater sample determination sub-section), the recovery experiment is described. A certain concentration of standard solution was added into the influent. This solution was pretreated by the pretreatment method and then measured by the decided HPLC-UV method. The results proved the validation of the pretreatment method.
Chromatographic separation conditions
The mobile phase system, mobile phase ratio and gradient elution procedure, mobile phase flow rate, column temperature, injection volume were optimized in this study. The used HPLC-UV detection wavelength was 277 nm.
T h e t e s t e d m o b i l e p h a s e s y s t e m s w e r e
n-hexane:isopropanol, n-hexane:dichloromethane and
isopropanol (A):n-hexane (B):dichloromethane (C). The optimized process of mobile phase ratio and gradient elution procedure were operated step by step. The detailed process was shown in the Results and Discussion section (Selection of mobile phase ratio and gradient elution procedure sub-section). The tested flow rates were 0.8, 0.9,
1.0, 1.1 and 1.2 mL min-1. The tested column temperatures
were 23 (room temperature), 30, 32 and 34 °C. The tested injection volumes were 5, 10, 20 and 25 µL.
Results and Discussion
Selection of mobile phase system
used in this study was a normal-phase chemical bonding chromatographic column. In normal-phase chromatography, the elution capacity of mobile phase system increases with the solvent polarity. The appropriate selection of mobile phase system can significantly improve the selectivity of the measured components. In order to obtain suitable solvent strength, a binary or ternary solvent system is normally used as mobile phase. The used solvent can be divided into the based primer and the eluent. In normal-phase
chromatography, low polarity solvents such as n-hexane,
benzene, and chloroform are usually adopted as the based primer and polar solvents, such as ethers, esters, alcohols and ketones, are commonly selected as the eluent. Two
binary mobile phase systems (n-hexane:isopropanol,
n-hexane:dichloromethane) and one ternary mobile phase
system (isopropanol:n-hexane:dichloromethane) were
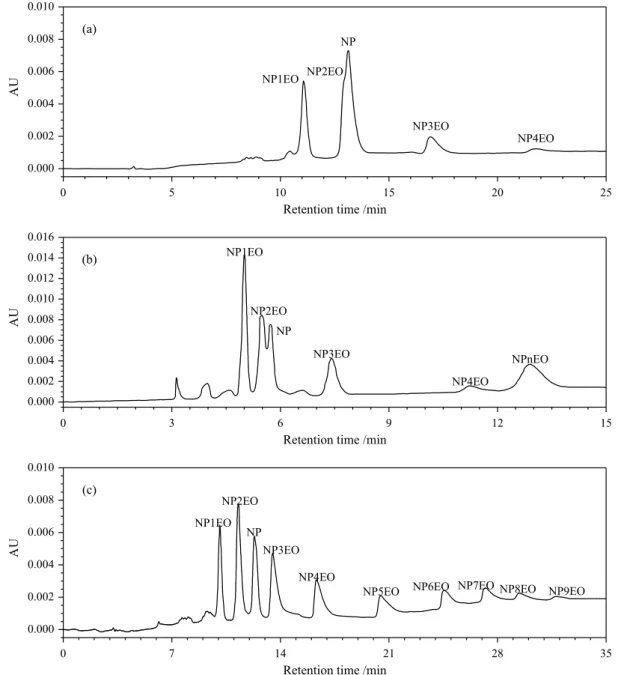
investigated in this study. The separation results of mixed standard solution were shown in Figure 1.
Figure 1a showed that the separation between NP and NP2EO was not clear and was difficult to improve with the changing of mobile phase ratio. NP and adjacent NPnEOs still have not been separated by the
n-hexane:dichloromethane system in Figure 1b. The
long chain NPnEOs mixed together and was difficult to
separate. With the isopropanol:n-hexane:dichloromethane
system, NP and adjacent NPnEOs have been fully
Figure 1. Chromatograms of mixed standard solution with three mobile phase systems: (a) n-hexane:isopropanol; (b) n-hexane:dichloromethane; (c) isopropanol:n-hexane:dichloromethane. The NP, mixed NP2EO and mixed NP5EO in mixed standard solution were 107.4, 428.0 and 1968 µg mL-1,
separated. Long chain NPnEOs also presented a clear separation and shorter retention time. With the further optimization of chromatographic conditions, it was possible to separate NP and NPnEOs clearly and rapidly.
Therefore, the isopropanol:n-hexane:dichloromethane
ternary system was chosen as the mobile phase system in this study.
Selection of mobile phase ratio and gradient elution procedure
It was found that the small variation of dichloromethane
ratio in the isopropanol (A):n-hexane (B):dichloromethane
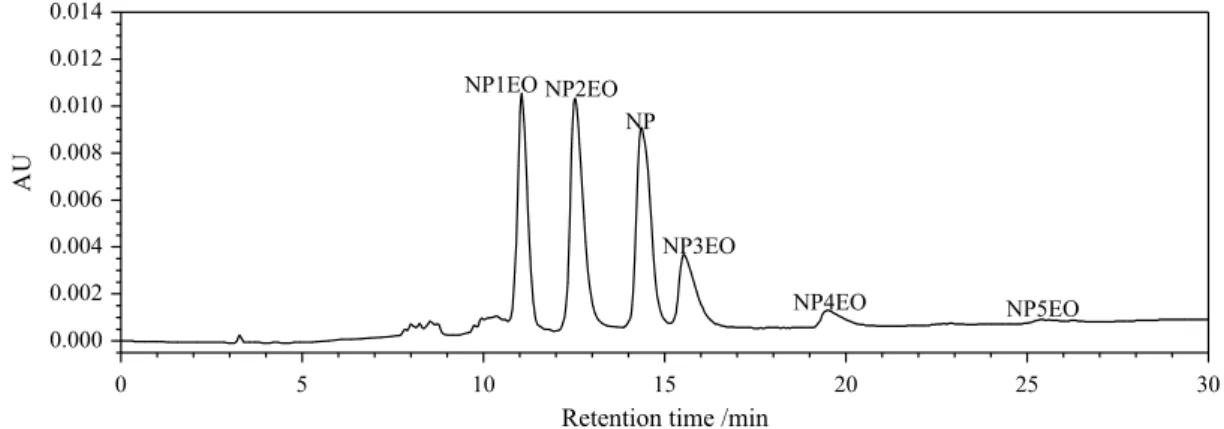
(C) system would affect the retention time and the separation degrees between NP and adjacent NPnEOs. Three gradient elution procedures with different dichloromethane ratios (A:B:C linear changed within 30 min: from 1:96:3 to 10:87:3, from 1:95:4 to 10:86:4, from 1:94:5 to 10:85:5) were performed to investigate the separation of NP1EO, NP2EO, NP and NP3EO. Under the dichloromethane ratio of 4% (Figure 2), NP1EO, NP2EO and NP achieved complete separation, while NP and NP3EO showed a little overlap, which could be improved by changing the
isopropanol ratio in the gradient elution procedure. The optimal dichloromethane ratio was chosen as 4% and the initial A:B:C used was 1:95:4.
In gradient elution process, the changing rate of strong eluent ratio affects the separation degree of different components. A better separation degree will be achieved under bigger changing rate. Four gradient elution procedures with different isopropanol ratios (initial A:B:C = 1:95:4, linear changed within 14 min under different changing
rates of isopropanol ratio: 0.20, 0.25, 0.30, 0.35% min-1,
then linear changed to 15:81:4 within 1 min and maintained for 10 min) were conducted. The results showed that all the separation degrees between NP1EO, NP2EO, NP and NP3EO achieved 1.4 under the isopropanol ratio changing
rate of 0.25% min-1. The corresponding chromatogram is
shown in Figure 3.
According to the separation degree between NP2EO and NP, the long retention time of long chain NPnEOs in Figure 3 and the maximum of n, the following procedures of the three gradient elution were carried out: initial A:B:C = 1:95:4, linear changed to 4.5:91.5:4 within 14 min, in 14-15 min linear changed to 17:79:4, maintained for 7 min, in 22-36 min linear changed to 45:51:4, 59:37:4 or
Figure 2. Chromatogram of gradient elution procedure with dichloromethane ratio of 4%. The NP, mixed NP2EO and mixed NP5EO in mixed standard solution were 107.4, 428.0 and 1968 µg mL-1, respectively.
Figure 3. Chromatogram under the isopropanol ratio changing rate of 0.25% min-1. The NP, mixed NP2EO and mixed NP5EO in mixed standard solution
73:23:4 and kept for 6 min, in 42-43 min linear changed to 1:95:4, and balanced for 7 min.
The results showed that all the separation degrees of last two procedures were larger than 1.0 and achieved the minimum separation requirement. But the changing rate (to 59:37:4) in 22-36 min presented shorter total retention time. The final gradient elution procedure was obtained successfully. The corresponding chromatogram is shown in Figure 4 and all 12 components were separated within 35 min.
Selection of mobile phase flow rate
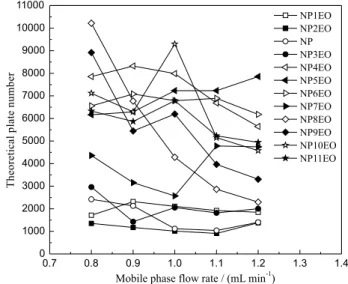
Based on the rate theory, the plate height is proportional to the mobile phase flow rate. Low mobile phase flow rate in HPLC can reduce the plate height and thus improve the column efficiency. However, the flow rate should not be too slow due to the broadening of chromatography peak and the increasing of retention time. Five mobile phase
flow rates, 0.8, 0.9, 1.0, 1.1 and 1.2 mL min-1, were used to
investigate the influence on retention time and theoretical plate number. The results showed that the retention time of these components correspondingly reduced with the increasing of flow rate, but the separation degrees presented no significant differences. The influence of flow rate on theoretical plate number is shown in Figure 5. Most
components under flow rate of 0.8-1.0 mL min-1 presented
high column efficiency. Considering the column efficiency and retention time (analytical speed) together, the optimal
mobile phase flow rate was selected as 1.0 mL min-1.
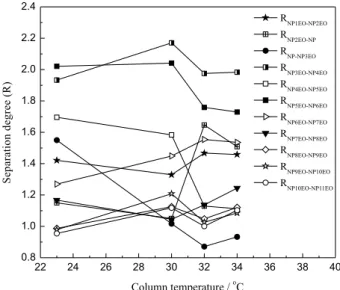
Selection of column temperature
Column temperature has a significant impact on the column performance, mobile phase viscosity and solvent solubility. With the increase in temperature, the mobile phase viscosity will be reduced, therefore, the mass
transfer will be improved and the column pressure will be lowered. But high temperature will affect the separation degree between the components and easily produce bubbles in mobile phase. Considering the boiling point of dichloromethane (39.8 °C), four column temperatures at 23 (room temperature), 30, 32 and 34 °C were investigated.
With the increasing of column temperature, the retention time of all components showed a downward trend. And the bigger the n value was, the more obvious the downward trend presented. The influence of column temperature on separation degree was calculated and drawn as in Figure 6. It was found that the separation degrees between 12 components could reach 1.0 or more only under the column temperature of 30 °C. So the optimal column temperature was selected as 30 °C.
Selection of injection volume
The increasing of injection volume can improve sensitivity. But the excessive injection can cause wide
Figure 4. Chromatogram of final gradient elution procedure. The NP, mixed NP2EO and mixed NP5EO in mixed standard solution were 107.4, 428.0 and 1968 µg mL-1, respectively.
peak, tailed peak, even exceeding of column capacity and reduction of column life. Five injection volumes as 5, 10, 15, 20 and 25 µL were investigated in this study. The results showed that the peak area increased linearly with injection volume. But the separation degree of some components decreased below 1.0 with the injection volumes of 20 and 25 µL. Therefore, injection volume of 10 µL was decided by considering the sensitivity and the separation degree.
Chromatogram under optimal conditions and linear regression equations
Under the decided optimal chromatographic conditions
(ternary mobile phase of isopropanol:n-hexane:dichloro
methane with a gradient elution procedure; mobile phase
flow rate of 1.0 mL min-1; column temperature of 30 °C;
sample injection volume of 10.0 µL; HPLC-UV detection wavelength of 277 nm), the NP and 11 kinds of NPnEO were separated successfully within 35 min as shown in
Figure 7. The separation of pure NP, mixed NP2EO and mixed NP5EO were also carried out to confirm the retention time of each component. According to the information (all components of the mixture are NPnEO with continuous n value) from Tokyo Chemical Industry Co. LTD and the principle (the bigger is the n value, the longer is the retention time of NPnEO), the relationship between retention time and the n value in Figure 7 was obtained. The concentration of each component in mixed standard solution was also decided by the area normalization method.
The used mixed standard solution was progressively diluted to 6 kinds of standard solutions (1, 2, 4, 8, 20 and 40 times) with different concentrations. After the chromatographic analysis of these diluted standard solutions, the standard curve of each component was obtained (see Figure 8). The linear regression equations, linear correlation coefficients and linear ranges are shown in Table 1. Except for NP11EO (97.2%), all other linear correlation coefficients achieved 99.9%. The limit of quantification (LOQ) values of the method were coincident with the smallest curve values in Table 1.
The precision experiments were repeated 11 times by measuring a certain concentration standard solution. The results are shown in Tables 2 and 3. Both retention time and peak areas were reproducible and all the RSD values (n = 0-11) obtained were satisfactory (< 5.0%). The stability of the standard solution was also investigated and the results showed that the standard solution could be stable for one week.
Wastewater sample determination
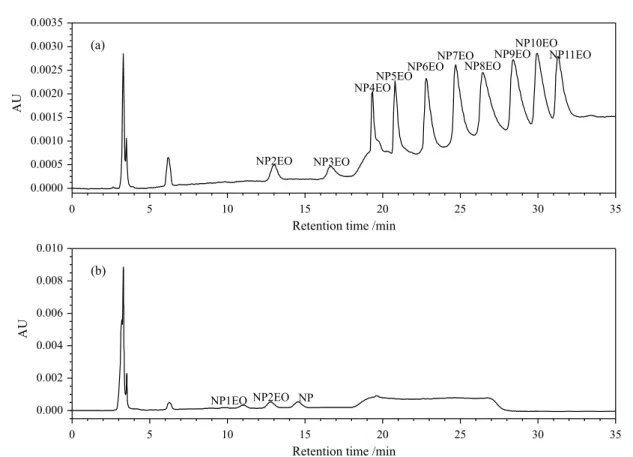
With the decided chromatographic method, the influent and effluent of the AOASP were analyzed. The results in Figure 9 indicated that the NP and NPnEOs in the wastewater samples were separated clearly and proved the effectiveness of this HPLC method. The concentrations
Figure 6. Influence of column temperature on separation degree (R).
Figure 8. Standard curve of each component: (a) NP, NP1EO, NP8EO, NP9EO, NP10EO and NP11EO; (b) NP2EO, NP3EO, NP4EO, NP5EO, NP6EO and NP7EO.
Table 1. Linear regression equations, linear correlation coefficients and linear ranges
Component Linear equation Linear correlation coefficient Linear rangea / (µg mL-1)
NP1EO y = 3150x − 4610 0.9995 3-120
NP2EO y = 2510x − 1970 0.9996 8-320
NP y = 4260x + 240 0.9998 2-110
NP3EO y = 2180x − 7760 0.9997 9-350
NP4EO y = 1750x − 3440 0.9998 12-470
NP5EO y = 1630x − 5730 0.9998 10-390
NP6EO y = 1580x − 4460 0.9998 7-290
NP7EO y = 1310x − 130 0.9999 5-220
NP8EO y = 1440x − 1820 0.9999 3-120
NP9EO y = 1190x + 2300 0.9998 4-110
NP10EO y = 1300x − 290 0.9991 5-70
NP11EO y = 1440x − 5480 0.9720 4-40
aLimit of quantification (LOQ) values of the method were coincident with the smallest curve values of linear range.
Table 2. Results of precision experiments (NP and NP1EO-NP5EO)
No. Peak area / (µV s)
NP1EO NP2EO NP NP3EO NP4EO NP5EO
1 18478 83145 10836 15466 41937 46590
2 18383 83218 10607 15224 40555 45158
3 18327 83818 10120 15087 40125 45594
4 18833 82458 11583 15180 40744 45117
5 18558 83407 10743 16068 40519 45269
6 18231 83561 11943 16102 40956 44396
7 18814 84347 11443 15383 41300 45244
8 18903 83742 11368 15787 40375 44863
9 18792 83636 10909 16909 39788 44906
10 18791 82371 11140 16331 40896 45228
11 18722 83682 11294 16281 41120 46546
Average 18621 83399 11090 15802 40756 45356
RSDa / % 1.3 0.7 4.6 3.7 1.4 1.5
Table 3. Results of precision experiments (NP6EO-NP11EO)
No. Peak area / (µV s)
NP6EO NP7EO NP8EO NP9EO NP10EO NP11EO
1 105174 73342 43285 25455 11595 3202
2 104254 73775 42640 24874 11761 3325
3 105185 73305 41848 25034 11773 3435
4 103157 73736 41627 24432 11320 3468
5 105798 73352 41921 24647 10924 3514
6 105067 73720 41931 25285 11610 3356
7 105954 73662 40786 24290 11226 3200
8 105151 73586 40703 24929 11595 3537
9 105548 74016 40870 24662 10875 3467
10 106023 74000 41368 25153 10617 3591
11 105783 74223 41547 24359 10469 3734
Average 105190 73701 41684 24829 11251 3439
RSDa / % 0.8 0.4 1.9 1.6 4.1 4.7
aRelative standard deviation.
Figure 9. Chromatogram of wastewater samples from AOASP, (a) influent; (b) effluent.
of NP and NPnEO in wastewater samples are shown in Table 4. It also proved the feasibility of AOASP in degrading NPnEOs.
A certain concentration of standard solution was added into the diluted influent to confirm the recovery rates. The detailed recovery rates information is shown in Table 5. The results showed that the average recovery rates of NP and NPnEO (n = 1-11) were 84.4-121.4%, meeting the needs
of scientific analysis. It also proved the validation of the pretreatment method for the wastewater samples.
Conclusions
Table 4. Concentrations of NP and NPnEO in wastewater samples
Component Influent / (µg mL-1) Effluent / (µg mL-1)
NP1EO − 0.192
NP2EO 2.59 0.245
NP − 0.129
NP3EO 3.62 −
NP4EO 5.14 −
NP5EO 9.86 −
NP6EO 15.40 −
NP7EO 17.02 −
NP8EO 20.85 −
NP9EO 18.46 −
NP10EO 16.50 −
NP11EO 10.78 −
Table 5. Recovery rates of influent
Component
Sample values before
adding standard / (µg mL-1)
Adding standard / (µg m-1L)
Measured values after
adding standard / (µg mL-1)
Recovery rates / %
NP1EO − 0.205 0.224 109.1
NP2EO 0.044 2.036 1.761 84.4
NP − 0.086 0.085 99.8
NP3EO 0.068 3.823 3.644 93.6
NP4EO 0.099 6.092 5.971 96.4
NP5EO 0.192 5.332 5.397 97.6
NP6EO 0.290 3.931 3.989 94.1
NP7EO 0.366 2.988 3.579 107.5
NP8EO 0.389 1.616 1.899 93.4
NP9EO 0.440 0.988 1.618 119.2
NP10EO 0.401 0.511 1.021 121.4
NP11EO 0.337 0.206 0.576 116.0
and sample injection volume were optimized step by step. Under the optimized chromatographic conditions, the NP and 11 kinds of NPnEO were separated and determined successfully within 35 min. The linear correlation coefficients for the standard curves were from 0.9720 to 0.9999 and all the RSD values for precision degree were less than 5.0%. The average recoveries of NP and NPnEO (n = 1-11) for wastewater samples were 84.4-121.4% and achieved the scientific analysis requirement. The fast HPLC analytical method was proven successful and reliable, and could be used for relative NP and NPnEO determination.
Acknowledgments
This study was jointly supported by National Natural Science Foundation of China (No. 21107011) and the Fundamental Research Funds for the Central Universities of China (No. N150304001, No. N160302001).
References
1. Miodovnik, A.; Mt. Sinai J. Med. 2011, 78, 58.
2. Moreira, M. A.; André, L. C.; Ribeiro, A. B.; Silva, M. D. R. G. D.; Cardeal, Z. L.; J. Braz. Chem. Soc.2015, 26, 531. 3. Locatelli, M.; Sciascia, F.; Cifelli, R.; Malatesta, L.; Bruni, P.;
Croce, F.; J. Chromatogr. A2016, 1434, 1.
4. Oliveira, T. M. B. F.; Ribeiro, F. W. P.; Nascimento, J. M. D.; Soares, J. E. S.; Freire, V. N.; Becker, H.; Lima-Neto, P. D.; Correia, A. N.; J. Braz. Chem. Soc.2012, 23, 110.
5. Zhou, Y. J.; Huang, X.; Zhou, H. D.; Chen, J. H.; Xue, W. C.; Water Sci. Technol.2011, 64, 2096.
6. Azevedo, D. D. A.; Lacorte, S.; Viana, P.; Barceló, D.; J. Braz. Chem. Soc.2001, 12, 532.
7. Huang, D. L.; Qin, X. M.; Xu, P.; Zeng, G. M.; Peng, Z. W.; Wang, R. Z.; Wan, J.; Gong, X. M.; Xue, W. J.; Bioresour. Technol. 2016, 221, 47.
8. Wang, L.; Zhang, J. J.; Duan, Z. H.; Sun, H. W.; Ecotoxicol. Environ. Saf. 2017, 140, 89.
9. Camacho-Muñoz, D.; Martín, J.; Santos, J. L.; Aparicio, I.; Alonso, E.; Sci. Total Environ. 2014, 468-469, 977.
10. Dzinun, H.; Othman, M. H. D.; Ismail, A. F.; Puteh, M. H.; Rahman, M. A.; Jaafar, J.; Chem. Eng. J.2015,269, 255. 11. Xie, Y. H.; Li, X. J.; Xu, C. S.; Lv, L. T.; Zhu, Y. N.; Han, J.;
You, M. Y.; Zhu T.; J. Chem. Pharm. Res. 2013, 5, 424. 12. Bozkurt, H.; Sanin, F. D.; Chemosphere2014, 104, 69. 13. Núñez, L.; Turiel, E.; Tadeo, J. L.; J. Chromatogr. A 2007, 1146,
157.
14. Yuan, C. L.; Zhou, W.; Zhu, T.; Wang, B.; LC GC Europe2014, 27, 68.
15. Navarro, P.; Bustamante, J.; Vallejo, A.; Prieto, A.; Usobiaga, A.; Arrasate, S.; Anakabe, E.; Puy-Azurmendi, E.; Zuloaga, O.; J. Chromatogr. A2010, 1217, 5890.
16. Czech, T.; Bonilla, N. B.; Gambus, F.; Romero González, R.; Marín-Sáez, J.; Martínez Vidal, J. L.; Garrido Frenicha, A.; Sci. Total Environ. 2016, 557-558, 681.
Submitted: January 3, 2017