©Revista Brasileira de Fisioterapia
ELECTRICAL IMPEDANCE BEHAVIOR OF BIOLOGICAL TISSUES DURING
TRANSCUTANEOUS ELECTRICAL STIMULATION
B
OLFEVJ,
R
IBASSI,
M
ONTEBELOMIL & G
UIRRORRJ
Physical Therapy Graduate Program, Methodist University of Piracicaba, Piracicaba, SP- Brazil
Correspondence to: Rinaldo Roberto de Jesus Guirro, Rodovia do Açúcar, km 156, Taquaral, CEP 13400-911, Piracicaba, SP – Brazil, e-mail: [email protected]
Received: 28/07/2006 - Revised: 21/11/2006 - Accepted: 26/02/2007
ABSTRACT
Objective: To analyze the electrical impedance of biological tissues during electrical stimulation in relation to different segments, surfaces and current frequencies, with increasing distance between electrodes. Method: 20 female volunteers of mean age 23
± 2.25 years and mean body mass index 20.65 ± 1.44 kg/m2 were positioned in decubitus with one electrode placed proximally
to the wrist and ankle joint lines, anteriorly and posteriorly, or on the posterosuperior iliac spine, and the other electrode was placed at distance of 10, 20, 30 and 40 cm, sequentially. Two currents (100 us and 10 mA) were applied: one at 100 Hz (LF) and the other at 2000 Hz modulated at 100% of the amplitude for 100 Hz (MF), with a minimum interval of seven days. The impedance was calculated indirectly using Ohm’s Law, from the applied intensity and the electrical voltage picked up by a system consisting
of a digital oscilloscope (TDS 210, Tektronix®) and a direct current generator (Dualpex 961, Quark®). For statistical analysis,
Anova-F and Kruskal-Wallis were applied, with post hoc (SNK), Friedman test and Spearman correlation coefficient, taking p< 0.05. Results: Despite similar electrical impedance behavior with increasing distance between electrodes for the two currents, there was a reduction in impedance under MF stimulation. In the limbs, approximately 50% of the impedance variance was explained by the increase in electrode separation, although this relationship was not observed on the posterior surface of the trunk. Independent of the current type, the trunk presented the lowest electrical impedance, followed by the lower limbs. Conclusion: The electrical impedance of the tissues was influenced by current frequency and the positioning and distance between electrodes, thus presenting a non-uniform pattern in the different segments.
Key words: electrical impedance, tissues, electrical stimulation.
INTRODUCTION
Bioelectrical properties of cells and tissues support the application of diverse modalities of electrical current, in clinical practice, which are used, specially, for acute or chronic pain control1, muscular strengthening2, or treatment of neurological sequelaes3.
To obtain the desired effect, the electrical current generated must surpass the opposition imposed to its flux and arrive at the target-tissue with enough intensity. Part of this opposition is offered by the biological tissues. This opposition is named electrical impedance and represented by the association of the resistance, present in the extra and intra-cellular fluid, and the capacitive reactance that is a characteristic of cell membranes4.
In a simple way, the total impedance of a circuit may be calculated based on Ohm’s law (Z = U/i), where Z is impedance, U is circuit’s electrical tension, and I is the intensity of the current which is circulating in the circuit. Measuring the U electrical tension between the electrodes pairs during an application of a known i current, the Z impedance may
be calculated of this tissue segment5. According to Henein6, biological material follows almost satisfactorily this law, in which the impedance and the electrical tension become variables directly proportional when the intensity remains fixed. The electrical current always follows the least resistance path and, therefore, the impedance of the material (at this case biological tissue) will determine its density, intensity and its path. Thus, the impedance under the electrodes is altered with the positioning7, and inter-electrodes distance8, electrical field localization9, variation of the length and form of the anatomical structures4, as well as the quantity of water and number of layers on the corneous strata10, being keratin the main barrier to the current’s passage11.
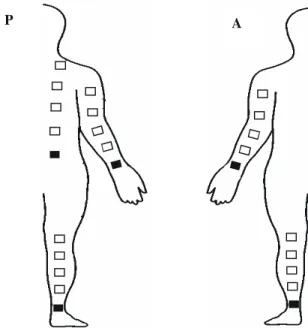
P A
tissues stimulated by low and medium frequencies currents, with different inter-electrode distances and in different segments and surfaces of the human body.
METHODOLOGY
Subjects
Twenty female volunteers were selected. The subjects were on average 23 ± 2,25 years old, weighed an average of 55,70 6,58 kg, were on average 1,64 ± 0,07 meter tall, had an average corporal mass index of 20,65 ± 1,44 kg/m2, and had no previous history of circulatory and/or nervous disorders, as well as recent cutaneous injuries. All volunteers were recruited through verbal invitation, instructed about the experimental procedures and solicited to sign the Clarified and Free Consent Term. The study was approved by the Research Ethics Committee of the Methodist University of Piracicaba, under the protocol nº 66/05.
Procedures
For inter-electrode electrical tension measurement, a system was developed (Figure 1), composed of a constant intensity current generator (Dualpex 961-Quark®), a digital oscilloscope (TDS 210 – Tektronik®), a ceramic resistance 100Ω, water-soluble gel (Sonic – Fisio Line®) and new electrodes (5 x 5 cm – Quark®) made of silicon-carbon because they present lower values of impedance5.
40 cm, in the cephalic direction. In all volunteers two currents, commonly used in clinical practice, were applied with symmetrical biphasic square pulse (100 us and 10 mA). The first current was applied with a 100 Hz frequency (low frequency – LF) and the second with 2000 Hz modulated in 100% of the 100 Hz amplitude (medium frequency – MF). These currents were applied with a minimal interval of seven days to discard the possible influence between both.
B A
2
1
*
Data collection were made at five locations, all at the right side of the body: anterior (A) and posterior (P) surfaces of the upper (UL) and lower (LL) limbs, and trunk posterior (T-P) facet. Volunteers remained in dorsal and ventral decubitus during data collection at the anterior and posterior body surfaces, respectively. For protocol standardization, one of the electrodes was placed proximally to the wrist’s (UL-A and UL-P) and to the ankle’s (LL-A and LL-P) joint interlines, as well as to the posterior-superior iliac spine (T-P), as is shown in Figure 2. From these points, the other electrode was sequentially distanced, at 10, 20, 30 and
Figure 2. Schematic figure of the electrodes fixation places in the different segments and distances. Posterior surface (P); Anterior surface (A); ( Reference electrode).
Figure 1. Measurement system of the electrical resistance, composed
by constant current generator (1), oscilloscope (2), resistance 100Ω
(*) and electrodes. Controlling of the applied current (A) and reception of interelectrodes voltage (B).
Impedance was calculated according to the Ohm’s Law, based on the electrical tension values obtained by the oscilloscope and the intensity of the applied current. First, it was determined the system’s resistance, by attaching one electrode to another with 4 ml of gel. This value was deducted from the impedance obtained on the different inter-electrode distances, determining the biological tissues impedance. Data were collected between 10 and 30 seconds after the electrical stimulation to avoid electrolytic penetration and alteration in the sudoriparous ducts permeability14.
During data collection, the skin was cleaned with 70% ethanol, and 2 ml of gel was applied on each electrode and they were fixed to the body with an elastic band. Environmental temperature was maintained around 23 ± 2 ºC, and air relative humidity at 70 ± 5 % during the whole procedure. The data collection were always performed during the afternoon period.
Statistical analysis
Initially, sample size estimation was done by the program
Graphpad Statemate 2.0 (Power test), based in means and
T
able 1.
V
alues (mean ±
standard deviation) of the electrical resistance (
Ω
) during the low (LF) and medium frequency (MF) stimulation in the dif
ferent interelectrodes distances (D) in
each segment: UL: upper limb; LL: lower limb;
T
: trunk;
A: anterior surface; P: posterior surface. n= 20. *p< 0,05 respective t
o 10cm; #p< 0,05 respective to 20cm;
zp< 0,05 respective
to 30cm; °p< 0,05 respective to LF;
p< 0,05 respective to UL-A;
†p< 0,05 respective to UL-P; ‡p< 0,05 respective to LL-P
. UL LL T A P A P P D LF MF LF MF LF MF LF MF LF MF 10 4 31. 5 ± 94. 17 354 ± 5. 62 ° 40 8.5 ± 77 .2 7 345. 5 ± 53. 53 ° 424. 5 ± 74. 05 349 ± 44 .5 ° 41 4. 5 ± 94 .1 4 33 6 ± 46 .9 5 ° 355 .5 ± 10 8.2 5
‡ 274.
5 ± 41 .5 3 ° †‡ 20 4 96 ± 87. 68* 4 29 ± 5 6. 95* ° 4 74. 5 ± 8 1 .75* 411 .5 ± 86 .23 * ° 4 11. 5 ± 8 6 .2 3* ° 37 4 ± 44 .4 4 ° 4 45 ± 96. 85 ° 36 7. 5 ± 50 .3 1 ° 364 .5 ± 96. 78
†‡ 291
.5 ± 40. 97 ° †‡ 30 5 88. 5 ± 85. 49*
# 512
± 60 .7* # ° 592 ± 8. ,7 2*
# 526
± 58. 52 * # ° 449 .5 ± 86. 08
◊ 39
6
±
43
.0
9
◊ 488
±
10
6.2
5
*
† 422
±
48.
34*
°
† 37
3
±
91
.3
†‡ 30
2 ± 36 .4 2 ° †‡ 40 6 16. 5 ± 95. 61*
# 5
51. 5 ± 6 4 .52*
# ° 6
17
±
86.
78*
# 551
± 57. 57 * # ° 552 .5 ± 103. 59 * #
• 47
7. 5 ± 44 .5 4* # • ° ◊ 54 1. 5 ± 1 02. 21 * # • † 477 .5 ± 49. 68* # ° † 354
.5
±
84.
35
†‡ 29
4 ± 35 .7 8 ° †‡
obtained in a pilot study. For an alpha level of 0.05 and power of 95%, there was established a number of 18 to 20 subjects. For electrical impedance analysis on the different segments, surfaces, distances and frequencies, one-way variance analysis (ANOVA- F, Kruskall-Wallis) was performed, followed by a post-hoc test (SNK). For comparison of the difference between the obtained values during LF and MF, ANOVA-Friedman was applied, followed by a post-hoc test (Rank). Correlation tests (rs – Spearman’s coefficient) were performed between the variables distance and impedance at the different segments, surfaces and frequencies. To verify the tendency of the electrical impedance responses in relation to the distances, simple linear regression model was applied, considering the segments, surfaces and frequencies analyzed. The analyses were processed by the softwares Statigraphics 5.1 Plus and Bio Estat 4.0. For all results, it was considered a significance level of 0.05.
RESULTS
Electrical resistance value of the circuit components (current generator + oscilloscope + ceramic resistance + electrodes + gel) was measured and resulted in 148Ω. Such value was subtracted from the total impedance (circuit + biological tissues), obtaining only the resultant biological tissue impedance. The impedance values at the different inter-electrode distances, frequencies, surfaces and segments, are shown at Table 1.
Initially it was considered the same frequency, surface and body segment to assess impedance at the different inter-electrode distances (10, 20, 30 and 40 cm). At the UL, there was an increase of electrical impedance at the 20, 30 and 40 cm distances in relation to the 10 cm, and in 30 and 40 cm when compared to 20 cm in both surfaces and frequencies. In the LL-A, the difference was obtained at 40 cm when compared to 10, 20 and 30 cm in both frequencies. In the posterior surface the differences were found in 30 cm in relation to 10 cm and in 40 cm compared to 10, 20 and 30 cm for LF and in 30 cm in relation to 10 cm and in 40 cm compared to 10 and 20 cm for MF. At the trunk there were no significant difference in the assessed distances.
Differences were not observed when compared the anterior and posterior surfaces at the same segment, frequency and inter-electrode distance.
Frequency Segment Impedance Equation Anova F Linear Coefficient R2
UL-A Z = 0.06D – 7.52 <0.0001 <0.0001 0.3949
UL-P Z = 0.07D – 10.19 <0.0001 <0.0001 0.4999
LL-A Z = 0.05D + 2.73 0.0002 <0.0001 0.1800
LL-P Z = 0.05D + 3.74 0.0002 <0.0001 0.1908
LF
T-P Z = 0.0008D + 24.71 0.9526 0.9538 0.0000
UL-A Z = 0.09D – 15.65 <0.0001 <0.0001 0.5739
UL-P Z = 0.08D –11.02 <0.0001 <0.0001 0.5506
LL-A Z = 0.12D – 23.69 <0.0001 <0.0001 0.4871
LL-P Z = 0.11D – 18.39 <0.0001 <0.0001 0.4996
MF
T-P Z = 0.06D + 8.60 0.0756 0.0792 0.3900
While comparing the impedance values obtained during LF and MF stimulation, at the same corporal segment, surface and inter-electrodes distance, the values were lower with MF for all variables, except at 30 cm of the LL-A.
Correlation between the electrical impedance values and the inter-electrode distance was positive in the UL-A (0.65; 0.78), UL-P (0.72; 0.77), LL-A (0.39; 0.70) and LL-P (0.42; 0.71) for LF and MF, respectively, however there was no correlation in the T-P (0.03; 0.21).
In Table 2, it can be observed that the influence of the distance between the electrode over the impedance value was of 39.49%, 49.99%, 18.00% and 19.08% during LF, and 57.39%, 55.06%, 48.71% and 49.96% for MF at the UL-A, UL-P, LL-A and LL-P, respectively. Furthermore, the linear regression equation is presented, considering the segments and frequencies analyzed.
The ratio between the impedance values during low and medium frequencies stimulation has lowered at 40 cm when compared to 10 cm in all regions, except T-P; at 30 cm in relation to the 10 cm in UL-A and LL-A and to the 40 cm compared to 20 cm in UL-A, as observed in Table 3.
Table 3. Mean ± standard deviation of the ratio between the resistance values (Ω) during electrical stimulation of low and medium frequency in upper limb (UL), lower limb (LL) and trunk (T), in the anterior (A) and posterior (P) surfaces, in the different interelectrodes distances (cm) (D), n= 20, *p< 0,05 respective to 10cm, #p< 0,05 respective to 20cm, p< 0,05 respective to 30cm.
D UL-A UL-P LL-A LL-P T-P
10 1.23 ± 0.26 1.20 ± 0.25 1.23 ± 0.23 1.2 ± 0.25 1.30 ± 0.36
20 1.17 ± 0.23* 1.19 ± 0.27 1.19 ± 0.23* 1.22 ± 0.24 1.26 ± 0.30*
30 1.16 ± 0.17*# 1.13 ± 0.17 1.14 ± 0.21*# 1.16 ± 0.22 1.24 ± 0.27*#
40 1.12 ± 0.17*#• 1.13 ± 0.17 1.16 ± 0.19*#• 1.13 ± 0.17* 1.22 ± 0.32*#•
Table 2. Linear regression equation of the electrical impedance (EI), value of p (Anova F and linear coefficient) and determination coefficient (R2) according to the interelectrodes distance (D) in the upper limb (UL), lower limb (LL) and trunk (T), in anterior (A) and posterior (P) surfaces,
for the electrical stimulation of low (LF) and medium (MF) frequency.
DISCUSSION
It is worth pointing out the importance of the results of investigations that mimic clinical conditions. For such, at the present study, no skin treatment with the objective to remove partially the corneous strata at the electrodes fixation locals was made If this layer were removed there would be an impedance decrease, facilitating the electrical current’s passage11. Environmental temperature and air relative humidity were controlled during procedure, once temperature increase leads to a decrease of Keratin’s hydration level, resulting in an increase of the cutaneous impedance15.
With limbs. It is important to note that, in these segments,
inter-electrodes distance was responsible for approximately 50% of the impedance variability.
In some locations, (next to the patella or at the shoulder) there was no significant difference between the impedance values with the distance increase, and this behavior may be related to the positioning of the electrode over anatomical structures with differences in fluid quantity16, with corneous strata thickness10 or with electrical field distribution9. In this context, it can be considered that the joint capsule and bursas under the electrodes have contributed for impedance reduction because of the presence of sinovial liquid.
In the trunk location, there was no correlation between electrical impedance and distance increase. The distinctive behavior of the trunk, when compared to the limbs, was reported by Zhu, Schditz and Levin8, that observed impedance decrease with the increase of distance between the electrode and current application point during analyses of bioelectrical impedance in this segment. One explanation for such event is the presence of a higher levels of hydration on the posterior trunk area when compared to the limbs, although there are no differences regarding the number of corneocyte layers10. According to the authors, the inversely proportional relationship between the number of corneous strata layers and water concentration is not valid for this surface of the trunk, since it was observed higher levels of hydration than in other less thick areas, such as cheeks, indicating the contribution of physical-chemical properties and factors such as sebaceous and sudoriparous secretion affecting the local humidity.
The lowest impedance values found at the posterior surface of the trunk in relation to the limbs, considering the same surface, distance and frequency, may be related to the electrical field formed due to geometrical differences between them. Researchers17 analyzing body composition by segmented bioelectrical impedance, have verified that there is a lesser contribution of the trunk in comparison with the limbs in the body’s total impedance. Foster and Lekaski18 have noticed that the trunk, with its large transverse section, contributes only with 10% of the body’s total impedance, while represents more than 50% of it mass. This could be explained by the fact that the impedance of a homogeneous conductive material is proportional to its length and inversely proportional to its transverse area4.
However, the presence of heterogeneous, anisotropic, and frequency-dependent features, in the skin and subcutaneous tissues, makes it difficult the employment of simplified physical models to determine its behavior19 and the current’s real distribution13 via electrical stimulation. This difficulty is demonstrated by the linear regression equations, which are specific for the application location and the current frequency. It is worth noting that for the posterior surface of the trunk, the equations are not representative and it was not possible to characterize linearity.
Similar electrical impedance values in the anterior and posterior surfaces of the limbs may be related to the fact that there is no difference in the thickness and in water concentration of the corneous strata of ventral and dorsal surfaces10.
Regarding stimulation with medium frequency current, lower electrical impedance was determined in all analyzed variables, except at 30 cm of the LL-A. Since the skin acts as a capacitive barrier, it is considered that its impedance is inversely proportional to the frequency of the alternate current13, and its governed by the expression:
2 2
C
X
R
Z
=
+
1)
2
(
−=
fC
X
Cπ
Where Z = impedance (Ω), R = resistance (Ω), Xc= capacitive reactance (Ω), f = frequency (Hz) e C = capacitance (F)12.
Despite the fact that the electrical impedance behavior, during LF and MF stimulation, agrees with the literature16, the relationship between the obtained values is not equal to what has been postulated. In addition, the lower influence of frequency with the increase of the inter-electrodes distance indicates a gradual reduction of the contribution of capacitive agents in the total impedance. This fact reinforces the model of skin and muscle impedance proposed by Reilly20, who proposed biological tissues as a complex circuit formed by resistors and capacitors disposed both in series and parallel. The understanding created about the medium frequency currents behavior on the biological tissues may be consequence of a badly conducted interpretation of theoretical models. Alon12 contests the relation between skin impedance and the electrical current frequency, attributing its alterations to the phase’s duration. Thus, the author reports that any mono or biphasic wave will suffer the same impedance of the interferential current if the duration of their phases is the same. Contrary to such affirmative, the results from the present study demonstrate the influence of frequency on the electrical flux opposition, once distinct impedance values were obtained while applying currents with the same phase duration. These contrasting results reassert the necessity of more knowledge about the interaction of the currents produced by the equipments available on market with the biological tissues.
In this context, results generalization should be limited, since the biological tissues’ electrical impedance may vary with gender, due to the differences in variables not analyzed in the present study such as body composition, age, and specially cutaneous hydration.
CONCLUSIONS
Electrical impedance of the biological tissues is altered by the localization and distance of the electrodes, as well as by the current’s frequency. In general, there was a positive correlation between the inter-electrodes distance and impedance both for low and medium frequency currents, when applied in both surfaces of the upper and lower limbs. This behavior was not observed in the posterior surface of the trunk. It was noticed a non-uniformity of the electrical impedance in the different segments and surfaces, characterizing tissue anisotropy. In addition, it was observed lower impedance for the medium frequency current because of the skin’s capacitive components, despite the fact that this influence decreases with the distance between the electrodes.
REFERENCES
1. Rushton DN. Electrical stimulation in the treatment of pain. Disabil Rehabil. 2002;24(8):407-15.
2. Crevenna R, Mayr W, Keilani M, Pleiner J, Nuhr M, Quittan M, et al. Safety of a combined strength and endurance training using neuromuscular electrical stimulation of thigh muscles in patients with heart failure and bipolar sensing cardiac pacemakers. Wien
Klin Wochenschr.2003;115(19-20):710-4.
3. Wilder RP, Wind TC, Jones EV, Crider BE, Edlich RF. Functional electrical stimulation for a dropped foot. J Long Term Eff Med
Implants.2002;12(3):149-59.
4. Kyle UG, Bosaeu I, De Lorenzo AD, Deurenberg P, Elia M, Gómez JM, et al. Bioelectrical impedance analysis - part I: review of principles and methods. Clin Nutr. 2004;23(5): 1226-43.
5. Nolan MF. Conductive differences in electrodes used with transcutaneous electrical nerve stimulation devices. Phys Ther. 1991;71(10):746-51.
6. Heneine IF. Biofísica Básica. Belo Horizonte: Atheneu; 1993.
7. Sagi-Dolev AM, Prutchi D, Nathan RH. Three-dimensional current density distribuition under surface stimulation electrodes. Med Biol Eng Comp. 1995;33:403-8.
8. Zhu F, Scheditz D, Levin NW. Estimation of trunk extracellular volume by bioimpedance. Conf Proc IEEE Eng Med Biol Soc. 1998;20(6):3104-7.
9. Chizmadzhev YA, Kuzmin PI, Weaver JC, Potts RO. Skin appendageal macropores as a possible pathway for electrical current. J Investig Dermatol Symp Proc. 1998;3(2):148-52.
10. Ya-Xian Z, Suetake T, Tagami H. Number of cell layers of the stratum corneum in normal skin – relationship to the anatomical location on the body, age, sex and physical parameters. Arch Dermatol Res. 1999;291:555-9.
11. Dorgan SJ, Reilly RB. A model for human skin impedance during surface functional neuromuscular stimulation. IEEE Trans Rehab Eng. 1999;7(3):341-8.
12. Alon G. Principles of electrical stimulation. In: Nelson RM, Currier DP. Clinical electrotherapy. California: Appleton & Lange; 1987. p. 29-80.
13. Ozcan J, Ward AR, Robertson VJ. A comparison of true and premodulated interferential currents. Arch Phys Med Rehabil. 2004;85:409-15.
14. Rosell J, Colominas J, Riu P, Pallas-Areny R, Webster JG. Skin impedance from 1Hz to 1 MHz. IEEE Trans Biomed Eng. 1988;35(8):649-51.
15. Kubisz L. The influence of storage time on the temperature dependence of the dc electrical conductivity of horn keratin. Bioelectrochemistry. 2001;53(2):161-4.
16. Faes TJC, Van Der Meij HA, Munck JC, Heethaar RM. The electric resistivity of human tissues (100Hz – 10MHz): a meta-analysis of rewiew studies. Physiol Meas. 1999;20:R1-10.
17. Cornish BH, Jacobst A, Thomas BJ, Ward LC. Optimizing electrode sites for segmental bioimpedance measurements. Physiol Meas. 1999;20:241-50.
18. Foster KR, Lukaski HC. Whole-body impedance - what does it measure? Am J Clin Nutr. 1996;64 Suppl 3:S388-96.
19. Livshitz LM, Mizrahi J, Einziger PD. Interaction of array of finite electrodes with layered biological tissue: effect of electrode size and configuration. IEEE Trans Neural Syst Rehabil Eng. 2001;9(4):355-61.