On-line Microwave-Assisted Sample Decomposition for Lead
Determination in Fish Slurry Samples by Electrothermal Atomic
Absorption Spectrometry
Marco A.Z. Arruda*+, Anne H. Fostier and Fran cisco J. Krug
Centro de Energia Nu clear na Agricultura, Universidade de S. Paulo, C.P. 96, 13418-260 Piracicaba - SP, Brazil
Re ceived: Jan u ary 19, 1996; Sep tem ber 10, 1996
Um procedimento FIA envolvendo decomposição em linha auxiliada por microondas foi proposto para a determinação de chumbo em peixes por espectrometria de absorção atômica com atomização eletrotérmica. Um vol ume de 300µL da amostra em forma de suspensão foi injetado simultaneamente com 400µL de ácido nítrico (6 mol L-1), e a mistura foi dirigida para um reator tu bu lar posicionado dentro do forno de microondas. A amostra processada foi coletada em uma cubeta do amostrador de um espectrômetro de absorção atômica com forno de grafite. A curva analítica mostrou-se lin ear en tre 2,5 e 25,0µg L-1Pb e o limite de detecção foi determinado como 0,72µg L-1. A precisão, expressa em desvio padrão relativo, foi de 10,5% (n = 20) para repetibilidade e de 14,3% (n = 10) para reprodutibilidade. A exatidão do método foi confirmada empregando-se um ma te rial de referência e comparando-se os resultados obtidos com um procedimento envolvendo decomposição nítrico-perclórica.
An on-line mi cro wave-assisted de com po si tion pro ce dure for the de ter mi na tion of lead in fish is pro posed. 300µL slurry and 400µL of a 6 mol L-1 HNO3 so lu tion were si mul ta neously
in jected, and the mix ture was po si tioned in side a mi cro wave oven. The de com posed sam ple in-side the flush ing so lu tion was col lected in the autosampler cup of a graph ite fur nace. The pro-posed pro ce dure cov ered the 2.5 to 25µg L-1 Pb range and pre sented a de tec tion limit of 0.72µg L-1 Pb. Pre ci sion ex pressed as RSD, was 10.5% (n = 20) for re peat abil ity and 14.3% (n = 10) for reproducibility. Ac cu racy was as sessed us ing stan dard ref er ence ma te rial, and also by compar-ing the re sults to a ni tric-perchloric de com po si tion pro ce dure.
Key words: on-line mi cro wave de com po si tion, fish anal y sis, lead de ter mi na tion, electrothermal atomic ab sorp tion spec trom e try
In tro duc tion
The con tent of lead in the en vi ron ment and food is of great con cern be cause it is rec og nized as a cu mu la tive poi-son in an i mals and hu mans. Lead in take by hu mans has been es ti mated at 200-300µg per day, vary ing as a func tion of the de gree of con tam i na tion. Usually food is re spon si ble for up to 70% of daily lead in take1.
The tox ic ity of lead in hu mans and an i mals is usu ally chronic be cause it is ex creted more slowly than it is ab-sorbed, re sult ing in an ac cu mu la tion in var i ous tis sues. Symp toms of lead poi son ing in clude ir ri ta bil ity, an orexia,
mal aise, and head aches. De pending on the de gree of in tox -i ca t-ion, con st-i pa t-ion and at tacks of ab dom -i nal pa-in (lead colic) may be ob served. Children are more sus cep ti ble to lead poi son ing be cause they ab sorb a higher per cent age of lead through the gas tro in tes ti nal tract, have more hand-to-mouth ac tiv ity, and have de vel op ing ner vous sys-tems that are more sen si tive to lead2-4.
In mon i tor ing and health risk eval u a tion pro grams, the num ber of en vi ron men tal and bi o log i cal sam ples is of ten high, and the sam ple prep a ra tion steps be come a lim it ing fac tor for anal y sis, mainly in terms of the time re quired and prob lems of con tam i na tion. Slurry sam pling is a good Ar ti cle
+ Present address: Departamento de Química Analítica, Universidade de
choice for cir cum vent ing these prob lems, and this tech-nique has been suc cess fully used for di rect in tro duc tion of sam ples in atomic spec trom e try5-7and in tro duced di rectly into the at om iza tion sys tem by means of flow in jec tion sys-tems8,9. In some in stances, how ever, the el e ments to be de-ter mined are not eas ily at om ized from solid par ti cles be cause of the com plex ity of the ma trix, and a pre-treatment step is re quired. An al ter na tive for cir cum vent ing this prob-lem is the use of a mi cro wave tech nique as a heat source for sam ple de com po si tion, thus re duc ing the time re quired for solubilization and losses of vol a tile el e ments.
Cou pling con tin u ous flow sys tems with mi cro wave digestors has been car ried out in com bi na tion with flame atomic ab sorp tion10-12 or in duc tively cou pled plasma atomic emis sion spec trom e try13,14. How ever, few ap pli ca
-tions with electrothermal atomic ab sorp tion spec trom e try have been re ported15,16. The state of the art and the fea tures of sev eral slurry tech niques pro posed for lead de ter mi na -tion17,29 are sum ma rized in Ta ble 1.
The pres ent pa per de scribes a sim ple and fast pro ce dure which ex ploits an on-line de com po si tion of slurry sam ples cou pled to a flow in jec tion sys tem. The ef fec tive ness of the method was eval u ated by de ter min ing lead in fish sam ples.
Ex per i men tal
Ap pa ra tus
A Perkin-Elmer model 4100 ZL atomic ab sorp tion spec trom e ter equipped with a lon gi tu di nal Zeeman back-ground corrector and a pyrolytically coated trans versely heated graph ite at om izer with an in te grated L’vov plat form
Ta ble 1. Fea tures of slurry sam pling tech niques for the de ter mi na tion of lead in food sam ples by atomic spec tro met ric tech niques.
De tec tion Ap pli ca tion RSD
(%) Sus pen sions Ref.
Sta bi lizer Par ti cle Size Con cen tra tion
HGAAS An chovies 4.2 Tri ton X-100 - 2-10% (m/v) 17
ETAAS Bis cuit 27.3 Eth a nol-H2O2 - - 18
ETAAS Bo vine liver 54.0 Antifoam B emul sion < 50µm 10% (m/v) 19
ETA-LE-AFS Bo vine liver - Tri ton X-100 - 0.2% (m/v) 20
ETAAS Bread ce re als 44.4 Eth a nol-H2O2 - - 18
ETAAS Brussel sporuts - Viscalex HV-30 - - 21
ETAAS Fish 13.6 Antifoam B emul sion < 50µm 10% (m/v) 19
ETAAS Fish 13.0 Glyc er ine-methanol-HNO3 - 15-300µg in 5µL of slurry 22
HGAAS Hay 4.3 Tri ton X-100 < 25µm - 23
HGAAS H-9 whole to tal diet 10.0 Tri ton X-100 < 25µm 2-10% (m/v) 24
ETAAS Kale 10.0 Antifoam B emul sion < 50µm 10% (m/v) 19
HGAAS Let tuce 13.8 Tri ton X-100 < 25µm - 23
HGAAS Let tuce 5.6 Tri ton X-100 - 2-10% (m/v) 17
HGAAS Let tuce 5.5 Tri ton X-100 < 25µm 2-10% (m/v) 24
ETAAS Milk pow der - - - - 25
HGAAS Mus sels 7.9 Tri ton X-100 < 25µm - 23
ETA-LE-AFS Non-fat milk pow der - Tri ton X-100 - 0.2% (m/v) 20
ETAAS Pa prika 2.7-6.7 Eth a nol-H2O2 < 30µm 0.05-0.4% (m/v) 26
ICP-AES Pep per 1.6-3.8 Tri ton X-100 5-3.5µm 0.5% (m/v) 27
ICP-MS Rice flour - < 3µm 28
HGAAS Sar dines 7.1 Tri ton X-100 - 2-10% (m/v) 17
ETAAS Spin ach 3.0 Viscalex HV30 1-50µm up to 10% (m/v) 29
ETAAS Spin ach 10.6 Glyc er ine-methanol-HNO3 - 15-300µg in 5µL of slurry 22
ETAAS Wheat flour 28.6 Eth a nol-H2O2 - - 18
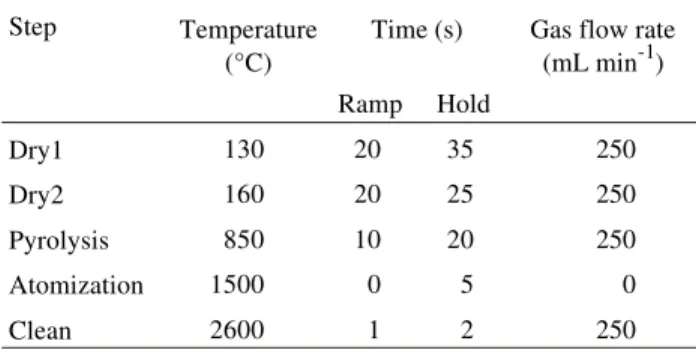
(Perkin-Elmer part n B050-4033) and an AS-71 fur nace autosampler were used. The wave length was set at 283.3 nm us ing a PerkinElmer EDL II sys tem as the ra di a tion source with a 0.7 nm spec tral band width. The in te -grated absorbance was used, and the re sults were re corded on an Epson LQ-870 printer. The fur nace pro gram is shown in Ta ble 2. A mix ture of 90% Ar and 10% H2 v/v was em-ployed as the purge gas.
The flow sys tem com prised an Ismatec mp13GJ4 peri-stal tic pump with Tygon pump ing tubes, a lab o ra tory-made three-piece in jec tor com mu ta tor30 with built-in T-shaped con nec tors, poly(tetra fluoro ethy lene) (PTFE) trans mis -sion lines of 0.8 mm i.d., and a model CEM MDS-81D mi-cro wave oven, equipped with a mag ne tron of 2450 MHz with a nom i nal max i mum power of 700 W. The di ges tion coil was in tro duced into the mi cro wave oven through the pres sure and tem per a ture sen sor holes. A Hewlett-Packard 8451A di ode-array spectrophotometer equipped with a con ven tional quartz cell was used to ver ify the sta bil ity of the slur ries.
Re agents
All re agents were of an a lyt i cal grade, and dis-tilled/deionized wa ter was used. Ni tric acid was dis tilled in a quartz sub-boiling still (Kürner). The 1000 mg L-1 Pb stock so lu tion was pre pared from lead ni trate (John son & Mattey, Co.) in 0.1% v/v HNO3. The ref er ence so lu tions con tain ing 2.5-25µg L-1 Pb were pre pared by se rial di lu -tions of the stock so lu tion with 2.4 mol L-1 HNO3. Mix of 0.003 mg of Mg(NO3)2 plus 0.05 mg of NH4H2PO4was used as a chem i cal mod i fier and Tri ton X-100 scin til la tion grade (Amersham/Searle) was em ployed to sta bi lize the slurry sam ples.
The ef fect of concomitants was eval u ated us ing a lead ref er ence so lu tion con tain ing 10 µg L-1 in 2.4 mol L-1 HNO3 with out the concomitants, or in the pres ence of 2 mg L-1 Fe, 2 mg L-1 Zn, 300 mg L-1 Cl-, 400 mg L-1 K, 300 mg L-1 Na, or 90µg L-1 Cu.
Sam ple prep a ra tion
The fish sam ples, col lected in the Amaparí river (Amapá, Brazil), were ground with a mixer in or der to make a slurry. Af ter be ing frozen for five days, the re sult -ing slurry was lyophilized by freeze-dry-ing at 6 Pa for 48 h up to a con stant weight. The re sult ing lyophilized sam-ples were sieved through a stan dard ny lon sieve in or der to ob tain a par ti cle size≤ 200µm. Then an ac cu rately weighed amount of about 250 mg was mixed with 3 mL of 2.4 mol L-1 HNO
3 and 1 mL of 0.25% v/v Tri ton X-100, and the vol ume was com pleted to 5 mL with 2.4 mol L-1 HNO3. Ag i ta tion for 20 min in an ul tra sonic bath was neces sary to ho mog e nize the slurry sam ple. Stan dard Ref er -ence Ma te rial MA-A-2 n 1062/TM - Fish ho mog e nate
(In ter na tional Agency of En ergy Atomic) was used to check the ac cu racy of the pro posed pro ce dure.
Ad di tionally, and for the pur poses of comparision, the sam ples also un der went ni tric-perchloric di ges tion. Each fish sam ple was ac cu rately weighed (0.4-0.5 g, dry weight) and trans ferred to gether with 10 mL of con cen -trated ni tric acid, to a 75 mL con i cal flask. Af ter com plete dis so lu tion (ca. 2 h), the flask was placed on a hot plate at 160 °C un til a clear so lu tion was ob tained. Next, 2 mL of perchloric acid was care fully added to the flask and the tem per a ture was in creased to 210 °C. The de com po si tion was com pleted with the ap pear ance of white fumes and ap prox i mately 0.5 mL so lu tion re mained. The de com -posed sam ple was then trans ferred to a 10 mL vol u met ric flask, and di luted to mark with 2.4 mol L-1 HNO
3.
Pro ce dure
The flow sys tem for online fish de com po si tion is il lus -trated in Fig. 1. In the po si tion spec i fied, both loops, loaded with 300µL sam ple and 400µL di ges tion so lu tions (6 mol L-1 HNO3), were in serted into the air car rier streams at 2 mL min-1 and driven to wards the con flu ence point (X); the mixed so lu tion was then di rected to wards the 500 cm PTFE di ges tion coil (0.8 mm i.d.) lo cated in side the mi cro wave oven. The coil was wrapped around an Erlenmeyer flask
Ta ble 2. The fur nace pro gram for the de ter mi na tion of Pb; in jected vol ume, 20µl of sam ple + 10µL mod i fier.
Step Tem per a ture (°C)
Time (s) Gas flow rate (mL min-1) Ramp Hold
Dry1 130 20 35 250
Dry2 160 20 25 250
Py rol y sis 850 10 20 250
At om iza tion 1500 0 5 0
Clean 2600 1 2 250
Pro gram time: 138 s; In jec tion tem per a ture: 100 °C.
filled with wa ter, which as sured a vol ume (150 mL) in side the cav ity suf fi cient to pre vent dam age in the mag ne tron. About 50 s af ter sam ple in jec tion, when the en tire sam ple plug was flow ing in side the di ges tion coil, the peri stal tic pump was stopped and the mi cro wave pro gram (Ta ble 3) was started. Af ter the mi cro wave ac tion, the pump was re-started and a 0.1% v/v HNO3 so lu tion was in tro duced via the tube of the air car rier in or der to clear the re sid ual de com posed sam ple and to trans port the sam ple to the autosampler cup which was com pletely filled (to tal vol-ume, 1 mL). A 150 cm coil im mersed in a wa ter-filled beaker was in cor po rated into the flow sys tem to al low the ex pan sion of di ges tion fumes. The same pro ce dure was fol-lowed for the blanks. Af ter the pro cess ing of each sam ple, the air car rier streams were in tro duced into the flow man i fold again in or der to re move the re sid ual wash ing so lu -tion.
Re sults and Dis cus sion
The sta bil ity of the slur ries
In or der to check the sta bil ity of the slurry sam ple, an ex per i ment was car ried out31 us ing a di ode-array spectrophotometer to re cord changes in the turbidimetry of the fish sam ple. Fig. 2 shows the vari a tion in the absorbance mea sured at 500 nm for a slurry con tain ing 250 mg fish sam ple dis persed in 4 mL of 2.4 mol L-1 HNO3 plus 1 mL of 0.25% v/v Tri ton X-100. The change in absorbance was mon i tored for 6 min utes and its vari a tion was 20%. How ever, when this change was mea sured for 5 min only
13% was ob served, in di cat ing that this con di tion is suf fi -cient for the sam ple prep a ra tion. With out a thixotropic agent, changes in absorbance of up to 50% were de tected for this type of sam ple.
As the time nec es sary to fill the sam ple loop of the flow sys tem was about 30 s, the time dur ing which the slurry re-mained sta bi lized was suf fi cient.
Fur nace heat ing con di tions
The fur nace pro gram (Ta ble 2) in cluded a hot in jec tion pro ce dure and two tem per a ture ramps in or der to guar an tee soft and to tally dry con di tions of the sam ple, to avoid prob-lems from ma trix ef fects. Also, a 90% Ar plus 10% H2 v/v mix ture was used as the purge gas be cause it in creases the dis so ci a tion of the lead mo lec u lar spe cies in the gas phase and re duces ma trix in ter fer ences32.
In or der to op ti mize the fur nace con di tions and to avoid lead loss dur ing py rol y sis, use of chem i cal mod i fi ers is an ex cel lent choice. So, some chem i cal mod i fi ers were tested: NH4H2PO4, Mg(NO3)2, and NH4H2PO4 + Mg(NO3)2. The sit u a tion with out a mod i fier was also checked.
The ex per i ment of the py rol y sis step was per formed by main tain ing the at om iza tion tem per a ture at 1500 °C and vary ing the py rol y sis tem per a ture. In this ex per i ment, the op ti mum heat ing con di tions did not sig nif i cantly dif fer in sen si tiv ity, re gard less of the dif fer ent chem i cal mod i fi ers. The loss of 10µg L-1 lead stan dard so lu tion was ob served in the py rol y sis cy cle at 900 °C for al most all chem i cal mod i fi ers, ex cept for the NH4H2PO4 + Mg(NO3)2 mix ture where analyte loss was ob served only at 1100 °C. How-ever, when us ing a de com posed fish sam ple with about 10 µg L-1Pb the same be hav iour was not ob served. When the NH4H2PO4 + Mg(NO3)2 mod i fier was used, losses of lead were ob served at 900 °C. There fore, the py rol y sis tem per a -ture cho sen was 850 °C.
The di ges tion con di tions for solid sam ples
Be cause of the lack of uni for mity of mi cro wave dis tri -bu tion33,34 in side the oven, the best po si tion for the di ges -tion coil was de ter mined by plac ing 14 glass beak ers in dif fer ent po si tions (Fig. 3), each con tain ing 50 g of wa ter. The mi cro wave power se lected was 700 W for 8 min. This ex per i ment was made in quin tu pli cate, and the re sults of the weight loss were cal cu lated by the dif fer ence be tween the weights of the wa ter-filled beaker be fore and af ter mi-cro wave ac tion, which ranged be tween 2.04 and 9.48 g. The best po si tion found for the ac tion of the mi cro wave based on mi cro wave power spa tial dis tri bu tion is shown in Fig. 3. These po si tions were at 35 and 6 cm, on the x and y axes, re spec tively.
Ni tric acid was se lected as the solubilizer, based on pre-vi ous work16. In or der to es tab lish the re quired time and acid con cen tra tion for the op ti mi za tion of the di ges tion
Ta ble 3. The mi cro wave oven pro gram for fish sam ple di ges tion.
Power(W) 350 0 350 0 350 0 350
Time (s) 120 20 120 20 120 20 120
To tal time: 540 s; Di ges tion time: 480 s.
con di tions for to tal re cov ery of lead in the anal y sis of solid sam ples, a fac to rial ex per i ment was car ried out. In this con-text, an ap pro pri ate amount of 250 mg fish sam ples (Stan-dard Ref er ence Ma te rial MA-A-2 n 1062/TM, IAEA) was pre pared as men tioned in the Sam ple Prep a ra tion Sec tion, and then in tro duced into the above-mentioned flow sys tem. Vol umes of 300µL for sam ples and 400µL for the acid were in jected into the flow sys tem us ing a merg ing-zone ap proach35. The sam ple-injected vol ume was se lected based on the sen si tiv ity of the method. For smaller vol-umes, the sen si tiv ity was not ac cept able and er ratic re sults were ob tained (RSD > 25%). For op ti mi za tion of di ges tion con di tions, a power of 350 W was fixed, and the di ges tion time was var ied be tween 0 and 16 min, while the acid con-cen tra tion was var ied be tween 0 and 6 mol L-1. When mi-cro waves were not ap plied, re cov ery was only 14.6, 23.1 and 37.7% for ni tric acid con cen tra tions of 0, 3, and 6 mol L-1, re spec tively. Fig. 4 shows the re sponse sur face re lated to the di ges tion pa ram e ters. At 350 W, the time re quired to pretreat the fish sam ples was 8 min, an ac cept able re cov ery value of 113% be ing ob tained when 6 mol L-1HNO3 was used. It should be pointed out that higher acid con cen tra -tions were not used to avoid even tual dam age of some parts of the di ges tion sys tem, as well as of the in jec tor com mu ta -tor. In the mi cro wave oven pro gram (Ta ble 3), three steps with out mi cro wave ac tion, in ter ca lated with other steps, were nec es sary to main tain the sam ple in side the oven, due to gas for ma tion dur ing mi cro wave di ges tion.
No mem ory ef fect was ob served by di gest ing a blank so lu tion af ter a fish sam ple.
An a lyt i cal char ac ter is tics
A lin ear range (r = 0.999; n = 7) be tween 2.5 and 25.0µg L-1 Pb was ob tained us ing the op ti mized flow
con-di tions in Fig. 1 and the fur nace pro gram shown in Ta ble 2. The de tec tion limit of 0.72µg L-1 Pb, and the char ac ter is tic mass of 29.8 pg 0.0044 s-1, were cal cu lated us ing a 10µg L-1 Pb stan dard so lu tion ac cord ing to IUPAC rec om men -da tion36. Pre ci sion was es ti mated by an a lyz ing fish sam-ples (Sarrassalmus sp.). Re peat abil ity of 10.5% (n = 20) and reproducibility of 14.3% (n = 10) were cal cu lated.
The ef fect of the concomitants was eval u ated by an a -lyz ing the vari a tions in the an a lyt i cal re sponses of 10µg L-1 stan dard so lu tion in the ab sence and pres ence of some el e -ments (Ta ble 4). Mea sure -ments were made in trip li cate, and the re sults showed that lead can be de ter mined in a ma-trix of sim i lar chem i cal com po si tion. A max i mum sig nal dif fer ence of±10% was at trib uted to the in her ent un cer-tain ties of the method.Fish anal y sis
The ac cu racy of the pro posed method was eval u ated by an a lyz ing fish ho mog e nate ma te rial (cer ti fied lead con cen -tra tion, 0.58µg g-1) and by com par ing it with the wet di ges -tion pro ce dure37of fish sam ples us ing ni tric and perchloric ac ids. The av er age of five con sec u tive de ter mi na tions on
Fig ure 3. In flu ence of the po si tion of the sam ple rel a tive to the mi cro wave mag ne tron on weight loss. Mi cro wave power spa tial dis tri bu -tion in side the oven for the in flu ence of axes x and y (in cm) on weight
loss. Fig ure 4. Re sponse sur face of the di ges tion con di tions for lead re cov
-er ies in MA-A-2 Ref -er ence Ma te rial no 1062/TM Fish Ho mog e nate at vari able di ges tion times and acid con cen tra tions.
Ta ble 4. Tol er ated lev els of the concomitants in the de ter mi na tion of 10µg l-1 Pb.
Con cen tra tion of the spe cies (mg L-1) Sig nal dif fer ence (%)*
2 Fe3+ -10.0
2 Zn2+ +7.0
0.09 Cu2+ +6.0
400 K+ +9.0
300 Na+ -6.0
300 Cl- +9.7
in di vid ual test por tions was 0.57± 0.03µg g-1. The re sults ob tained by the pro posed on-line mi cro wave di ges tion sys-tem are sum ma rized in Ta ble 5. By ap ply ing thet-test, both sets of re sults were sim i lar at a 95% con fi dence level, in di -cat ing the ac cu racy of the pro posed on-line slurry di ges tion method.
Con clu sions
The pro posed on-line mi cro wave de com po si tion al-lows rapid fish slurry pre-treatment, the to tal time in volved for the sam ple prep a ra tion and anal y sis not ex ceed ing 25 min. No prob lems as so ci ated with high pres sure were ob-served by col lect ing the di gested fish sam ple in a open autosampler cup. The pro posed sys tem can be ap plied to other sam ples of sim i lar or less com plex chem i cal com po -si tion.
Ac knowl edg ments
The au thors are grate ful to the Conselho Nacional de Desenvolvimento Científico e Tecnológico (CNPq, Brasília, Brazil), to A.L.D. Comitre for her col lab o ra tion in the stages of this re search, and to E.A.G. Zagatto for lan-guage im prove ment.
Ref er ences
1. Mckenzie, H.A.; Smythe, L.E.;Quan ti ta tive trace anal y sis of bi o log i cal ma te ri als: prin ci ples and trace amounts of some macroelements., Elsevier, Am ster dam, 1988.
2.Nuttall, K.L.Lab. Med.1995,26, 118. 3.Francek, M.A.En vi ron. Pollut.1994,84, 159. 4.Renner, R.Env. Scien. Technol.1994,29, 256A. 5.Langmyhr, F.J.; Wibetoe, G.Prog. Anal. At. Spectrom.
1985,8, 193.
6.Ebdon, L.; Lechotyck, A.Microchem. J.1986,34, 140. 7. Benzo, Z.A.; Velosa, M.; Ceccarelli, C.; de la Guardia, M.; Sal va dor, A. Fresenius’ J. Anal. Chem.
1991,339, 235.
8.. Arruda, M.A.Z.; Gallego, M.; Valcárcel, M. Anal. Chem.1993,65, 3331.
9.Arruda, M.A.Z.; Gallego, M.; Valcárcel, M. J. Anal. At. Spectrom.1995,10, 55.
10.Burguera, M.; Burguera, J.L.; Alarcón, O.M. Anal. Chim. Acta1986,179, 351.
11.Haswell, S.J.; Barclay, D. Analyst 1992 ,117 , 117.
12.Carbonell, V.; Morales-Rubio, A.; Salvador, A.; de la Guardia, M.; Burguera, J.L.; Burguera, M. J. Anal. At. Spectrom.1992,7, 1085.
13.Karanassios, V.; Li., F.H.; Liu, B.; Salin, E.D. J. Anal. At. Spectrom.1991,6, 457.
14.Gluodenis Jr, T. J.;Tyson, J.F. J. Anal. At. Spectrom.1993,8, 697.
15.Burguera, J.L.; Burguera, M. J. Anal. At. Spectrom.1993,8, 235.
16.Arruda, M.A.Z.; Gallego, M.; Valcárcel, M. J. Anal. At. Spectrom.1995,10, 501.
17. Madrid, Y.; Bonilla, M.; Cámara, C. Analyst
1990,115, 563.
18.Viñas, P.; Campillo, N.; López Garcia, I.; Hernández-Córdoba, M. Fresenius J. Anal. Chem.1994 ,
349, 306.
19.Lynch, S.; Littlejohn, D. J. Anal. At. Spectrom.
1989,4, 157.
20.Butcher, D.J.; Irwin, R.L.; Takahashi, J.; Su, G.; Wei, G.; Michel, R.G. Appl. Spectrosc.1990 ,44 , 1521.
21.Stephen, S.C.; Ottaway, J.M.; Littlejohn, D. Fresenius’ J. Anal. Chem.1987,328, 346. 22.Hoening, M.; Hoeyweghen, P.V. Anal. Chem.
1986,58, 2614.
23.Madrid, Y.; Meseguer, J.; Bonilla, M.; Cámara, C.Anal. Chim. Acta.1990,237, 181. 24.Madrid, Y.; Bonilla, M.; Cámara, C. J. Anal.
At. Spectrom.1989,4, 167.
25.Wagley, D.; Schmiedel, G.; Mainka, E.; Ache, H.J.At. Spectrosc.1989,10, 106.
26.Hernández-Córdoba, M.; López-García, I. Talanta1991,38, 1247.
27.Gervais, L.S.; Salin, E.D. J. Anal. At. Spectrom.
1991,6, 41.
Ta ble 5. Lead con tent in lyophilized sam ples as de ter mined by ni tric-perchloric (Wet) and mi cro wave de com po si tion (MW).
Pop u lar names in Brazil Sci en tific name Con cen tra tion* (µg.g-1)
Wet MW
Pi ra nha Serrassalmussp. 0.30± 0.03 0.29± 0.03
Pirarucu Ara pai ma gigas 0.21± 0.02 0.23± 0.01
Cascudo Pterigo phichthyssp. 0.19± 0.02 0.18± 0.02
Pescada branca Urophycissp. 0.20± 0.01 0.23± 0.01
Fish ho mog e nate ** —- 0.54± 0.01 0.57± 0.03
28.Mochizuki, T.; Sakashita, A.; Iwata, H.; Ishibashi, Y.; Gunji, N.Fresenius’ J. Anal. Chem.1991,339, 889. 29.Stephen, S.C.; Littlejohn, D.; Ottaway, J.M. Analyst
1985,110, 1147.
30.Bergamin, F.H.; Reis, B.F.; Jacintho, A.O.; Zagatto, E.A.G.Anal. Chim. Acta1980,117, 81.
31.de la Guardia, M.; Carbonell, V.; Morales-Rubio, A.; Sal va dor, A.Talanta1993,40, 1609.
32.Gilchrist, G.F.R.; Chackrabarti, C.L.; Cheng, J.; Hughes, D.M.J. Anal. At. Spectrom.1993,8, 623.
33. Fostier, A.H.; Ferreira, J.R.; Andrade, M.O.Quim. Nova1995,18, 425.
34.Kingston, H.M.; Jassic, L.B. InIn tro duc tion to Mi-crowave Sample Introduction , ACS Professional Ref. Book, Wash ing ton, 1988.
35.Bergamin, F.H.; Zagatto, A.E.G.; Krug, F.J.; Reis, B.F.Anal. Chim. Acta1978,101, 17.
36.An a lyt i cal Methods Com mit tee. Royal So ci ety of Chem is try,An a lyst1987,112, 189.
37.Tinggi, V.; Reilly, C.; Hahn, S.; Capra, M. J.Sci. To-tal Env.1992,125, 15.