AR
TICLE
1 Centro de Estudios en Salud, Población y De-sarrollo Humano, Centro Universitario de Ciencias de la Salud, Universidad de Guadalajara. Sierra Mojada 950 Col, Independencia. 44340 Guadalajara México. [email protected]
The increase of firearm mortality and its relationship
with the stagnation of life expectancy in Mexico
Abstract This study analyzes firearms mortality (FA) and their impact on life expectancy in Mex-ico –compared to other causes of deaths- during the three-year periods 2000-2002 and 2010-2012 and the weight of the different age groups in years of life expectancy lost (YLEL) due to this cause. Based on official death and population data, abridged life tables in Mexico were constructed for the three-year periods studied. Temporary life expectancy and YLEL for aged 15 to 75 by select-ed causes and age groups were calculatselect-ed in each three-year period. Among men, FA mortality went from being the cause less YLEL caused in 2000-2002 to be the main cause of YLEL between 15 and 75 years in 2010-2012. Among women, YLEL for FA mortality had a higher relative growth. In both sexes, the greatest increase in YLEL by FA mortality was between 20 and 34 years. Find-ings indicate that the increase in FA mortality, especially among young people, has substantially contributed to the stagnation of life expectancy in recent years, and even his decline in the case of men. This reflects that violence linked to the FA is not only a security problem but also a collective health problem that must be copied in an interdis-ciplinary and intersectoral form if it is to increase the life expectancy of the country.
Key words Firearms, Life expectancy, Mortality, Violence
Go
nzález-Pér
ez GJ
Introduction
In Mexico, violent deaths have increased sub-stantially in the last 20 years, particularly
homi-cide and suihomi-cide rates1-3. Similarly, the presence
of organized crime has increased, and with it, the crime associated with drug trafficking and the smuggling of high-powered firearms (FA), which has led some authors to conceptualize the levels of
violence reached as a criminal insurgency4,5. The
possession and use of FA are some of the aspects considered to underlie the high levels of violence observed in many Latin American countries
to-day, and the case of Mexico is no exception6.
FA are more lethal than other weapons, such as bladed weapons or blunt objects, which
his-torically have had a greater presence in society7.
Although Mexican law is strict regarding the pos-session and carrying of FA, it allows the right to possession under certain restrictions (related to the type and caliber of the weapon and whether it is exclusively used by the army) and after be-ing registered with the Ministry of National
De-fense8. However, the illegal influx of FA into the
country through both borders, particularly from
the US-Mexico border9, has predominantly led to
the widespread availability of FA on the streets, which is reflected by the increased likelihood of fatalities resulting from criminal acts whose pur-pose was not in principle to take a person’s life,
such as robberies and street fights7.
At the international level, FA have been re-ported to account for many more fatal injuries than any other type of weapon and for the
ma-jority of youth homicides10. In the United States,
residents in states with the highest number of FA were six times more likely to die in an accident caused by an FA than those in states with fewer
weapons11; moreover, the proportion of FA
sui-cides in the United States is much higher than in other industrialized countries with more
restric-tive laws for FA possession12.
Although Latin American authors have ana-lyzed the mortality from FA from an
epidemio-logical perspective6,13,14, these studies are
practi-cally nonexistent in Mexico because the assump-tion has been that FA mortality is a substantial public safety issue. However, given the impor-tance and magnitude of violence in the coun-try, it appears necessary to address this problem along with the possible impact of FA-related deaths on the relative stagnation of life expectan-cy in Mexico.
According to official figures, life expectancy at birth increased relatively little between 1995
and 2010 (from 73.2 to 74 years)15, which shows a
deceleration of the decreasing mortality rate ob-served in previous decades. Although population aging and the consequent increase in mortality from chronic degenerative diseases may explain this finding to some extent, the increase in violent deaths – particularly those caused by FA – might also contribute to the years of life expectancy lost in the population and should be an element that warrants inspection when investigating the rea-sons for the recent slow growth of Mexican life expectancy.
Generally, studies that analyze the impact of violent deaths on life expectancy are relatively
scarce16-18, and even rarer are those evaluating the
impact on LE from FA-related deaths19, although
agreement supporting the importance of this type of cause in the years of life expectancy lost is widespread.
In this context, this study aimed to analyze the effect of FA-related deaths in Mexico in recent years, to determine their impact on the country’s life expectancy compared with other causes of death between the 2000-2002 and 2010-2012 tri-ennia and to identify the degree to which differ-ent age groups contributed to the loss of years of life expectancy.
Methods
This was an observational cross-sectional study based on secondary sources of information. The mortality data used were derived from the Na-tional Health Information System of the Ministry
of Health20. Population data for the calculation of
the national rates of FA-related deaths between 2000 and 2012 were obtained from population estimates and projections prepared by the Na-tional Population Council for Mexico between
1990 and 203021. The rates were adjusted by the
direct method, using the population of Mexico in
2010 as the standard population21.
FA-related deaths were obtained by grouping all those codes that, in the 10th revision of the
International Classification of Diseases (ICD)22,
e C
ole
tiv
a,
22(9):2861-2872,
2017
V09.9, V12-V14 (.3-.9), V19.4-V19.6, V20-V28 (.3-.9), V29-V79 (.4-.9), V80.3-V80.5, V81.1, V82.1, V83-V86 (.0-.3), V87.0-V87.8, V89.2, V89.9), the latter cause classified according to the criteria used in Mexico by the Ministry of
Health23.
According to the criteria of the Pan American Health Organization (PAHO), Mexico is among the continent’s countries with high-quality mor-tality data (e.g., underreporting and ill-defined
causes of death below 10%)24. The PAHO
esti-mates for Mexico – underreporting of 0.8% and
ill-defined causes of death of 2.1% in 2000-0525
and 0.5% and 1.7%, respectively, circa 201224 –
are quite similar in both periods and support the use of official mortality statistics in a study such as the present one of a national scope.
However, given the existence of deaths of unspecified age or sex (0.5% and 0.05% in
2000-02, 0.6% and 0.08% in 2010-12, respectively20),
this situation was corrected by proportionally re-distributing the deaths with age or sex disregar-ded – in general and for each cause examined – according to the relative weight of each age group
and sex26.
Based on the official information on deaths and population, abridged life tables were pre-pared, by sex, for the 2000-2002 and 2010-2012 triennia; for the construction of life tables, the
EPIDAT version 3.127 program was used, which
employs the model tables developed by Coale
and Demeny28 as references for the pattern of
mortality, specifically for the West family of the model, which is recommended for countries with
mortality levels similar to those of Mexico29. The
triennial life tables were drafted to attenuate the effects of circumstantial changes in mortality, which might distort the overall trend.
Life tables were necessary to calculate -also
through the EPIDAT27 software-, the temporary
life expectancy (TLE) between 15 and 75 ye-ars and the yeye-ars of life expectancy lost (YLEL) between both ages. Generally, this was accom-plished for mortality by FA and by the other cau-ses studied, and by age groups in each triennium
considered according to the Arriaga method30,31,
which was described in detail by himself and by
Pollard32 and employed by several authors16,33 for
the analysis of changes in mortality and its rela-tion to life expectancy.
In practice, the YLEL calculation represents the difference between the maximum number of years that can be lived between two ages and the TLE, which is the average number of years lived
by the population between those ages30. YLEL is
calculated by multiplying the proportion of
de-ceased persons between the ages x and x + n in
the stationary population from the life table by the difference between the average number of
ye-ars they might have lived from x – provided
mor-tality was eliminated – and the average number
of years actually lived between x and x + n by the
population that died in that age group31.
The method was applied under the assump-tion of a mortality of zero between both ages. This assumption, recommended by several
au-thors31,34, facilitates the interpretation of the
in-dicator; thus, in the present study, the total YLEL between the ages “15” and “75” is equal to the di-fference between “75” and “15” (that is, the maxi-mum number of years that might be lived betwe-en both ages if mortality were eliminated (in this case, 60 years) and the temporary life expectancy between “15” and “75”, or the average number of years actually lived.
The age range of 15 to 75 years was chosen because it includes the stage of life with greatest economic activity; does not include mortality at the extremes of age, whose dynamics feature par-ticular characteristics; and is a period of life when negative consequences of individuals’ behaviors
may manifest, as in the case of violent deaths30.
Results
FA caused 138,564 deaths between 2000 and 2012, equivalent to 2.1% of all deaths in Mexico during that period. Annual figures ranged from
6,177 deaths in 2004 to 20,913 deaths in 201123.
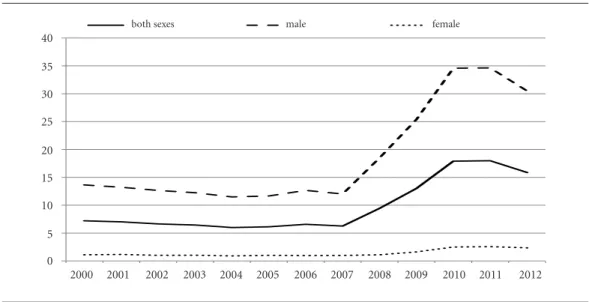
After a sustained downward trend at the be-ginning of the 21st century, the adjusted FA mor-tality rate has increased since 2007, reaching its highest value in recent decades in 2011 – 17.98 per 100,000 population, specifically, 34.64 per 100,000 for men and 2.58 per 100,000 for wom-en. These figures show that the male rate is more than 12-fold greater than the female rate (Figure 1). Although the adjusted rate in 2012 of 15.87 per 100,000 was slightly reduced than that of 2011, the former number is more than double the mortality rate from FA in 2000. Moreover, the greatest increase was seen between 2007 and 2011, when the rate increased by 187% (188% for men, 160% for women).
Go
nzález-Pér
ez GJ
homicide increased, accounting for nine out of ten such deaths over the 2010-2012 triennium. In contrast, the proportion of accidents and suicides by FA decreased significantly, notwith-standing similarities in the number of accidents in 2010-12 and that of the triennium 2000-02. Fi-nally, an increase in the proportion of deaths due events of undetermined intent was observed; the absolute numbers increased, from 984 in 2000-02 to 3,806 in 2010-12, which places this category as the second-most important cause of FA death, behind only homicides.
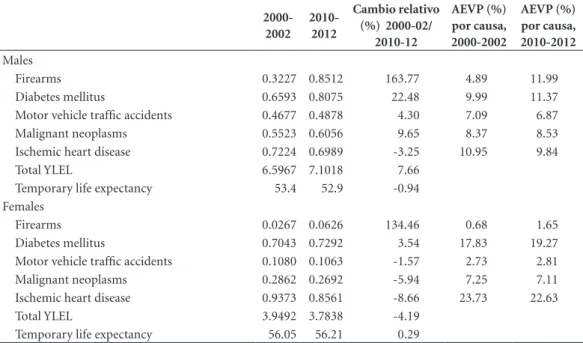
The male TLE between 15 and 75 years de-creased by nearly 1% between the two trien-nia studied, while the female TLE increased by 0.3% in that period (Table 2). Consistent with the aforementioned observations, male YLEL between 15 and 75 years increased by 7.7% be-tween 2000-02 and 2010-12, while female YLEL decreased by 4%.
The analysis of YLEL by cause (Table 2) indi-cated that for men, FA-related deaths shifted from causing the least YLEL in the triennium 2000-02 to being the main cause of YLEL between 15 and 75 years in 2010-12. YLEL from this cause in-creased 164%, i.e., from 0.32 in 2000-02 to 0.85 in 2010-12. This increase was much higher than those observed for all other causes studied, which
notably included decreased YLEL from ischemic heart disease.
Thus, FA-related deaths were responsible for nearly 12% of male YLEL in 2010-12, more than any of the other causes analyzed, followed in im-portance by diabetes mellitus and ischemic heart disease.
Regarding women, FA-related deaths caused the least YLEL in both triennia. Notably, howev-er, YLEL due to FA increased by 134% between 2000-02 and 2010-12, a period in which YLEL from all other causes except for diabetes mellitus decreased.
Notwithstanding this increase, YLEL due to FA-related deaths scarcely represented 1.7% of the total female YLEL over the 2010-12 trienni-um.
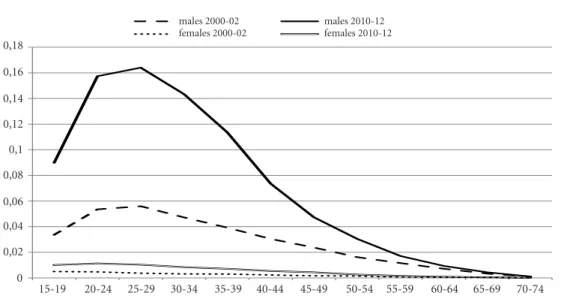
The analysis of the pattern of YLEL from FA-related deaths according to age groups in each triennium (Figure 2) showed that first, in all age groups and for both sexes, the YLEL in 2010-12 were greater than those of the trienni-um 2000-02. However, for men, the increase in YLEL between the two periods was largely due to the observed increase in YLEL in the 15-44-year age group. The YLEL in the 2000-02 triennium over those ages were 0.26 and represented 80% of YLEL from FA; in 2010-2012, they totaled 0.74
0 5 10 15 20 25 30 35 40
2000 2001 2002 2003 2004 2005 2006 2007 2008 2009 2010 2011 2012 tasa ambos sexos tasa masculina tasa femenina
Figure 1. Age-adjusted firearm-related death rate (per 100.000 population) by sex. Mexico, 2000-2012.
Standard population: population of Mexico in 2010, estimated by Consejo Nacional de Población (CONAPO, its acronyim in Spanish).
Source: Prepared by the authors based on data from the National Health Information System of the Ministry of Health, Mexico. 2000 2001 2002 2003 2004 2005 2006 2007 2008 2009 2010 2011 2012 0
5 10 15 20 25 30 35 40
e C
ole
tiv
a,
22(9):2861-2872,
2017
and accounted for 87% of total YLEL from FA between 15 and 75 years. In particular, YLEL be-tween the ages of 20 and 34 in 2010-12 were ap-proximately triple those of the triennium 2000-2002.
Regarding women, the highest increase in YLEL was also observed in the 20-34-year age group, although the rates were lower than those of men. For both sexes, the age group with the highest number of YLEL is 25 to 29 years.
Table 3 compares mortality by FA, diabetes mellitus, motor vehicle traffic accidents, malig-nant neoplasms and ischemic heart disease in terms of YLEL according to age and sex in the triennium 2010-2012.
As observed in this context, among men, FA are responsible for more YLEL between the ages of 15 and 44 than any of the other causes ana-lyzed, whereas diabetes has a greater impact be-yond the age of 45 years. In particular, FA-relat-ed deaths cause more YLEL between the ages of 20 and 34 than all other causes of death studied combined. Notably, in the 15-19-year age group, FA-related deaths cause a greater number of YLEL than motor vehicle traffic accidents.
Among women, YLEL from FA-related deaths between the ages of 15 and 29 years are less than YLEL due to malignant tumors and motor vehi-cle traffic accidents. Beyond the age of 30 years, the relative weight of FA-related deaths decreases
Table 1. Firearm-related deaths according to intent: Mexico, 2000-2002 and 2010-2012.
2000-2002 2010-2012
Absolute numbers % Absolute numbers %
Homicides 16034 78.4 53253 88.6
Events of undetermined intent 984 4.8 3806 6.3
Suicides 2096 10.2 1666 2.8
Accidents 1349 6.6 1386 2.3
Totals 20463 100.0 60111 100.0
Source: Prepared by the authors based on data from the National Health Information System of the Ministry of Health, Mexico.
Table 2. Years of life expectancy lost (YLEL) due to selected causes of death in persons aged between 15 and 75
years, by sex: Mexico, 2000-2002 and 2010-2012.
2000-2002
2010-2012
Cambio relativo (%) 2000-02/
2010-12
AEVP (%) por causa, 2000-2002
AEVP (%) por causa, 2010-2012
Males
Firearms 0.3227 0.8512 163.77 4.89 11.99
Diabetes mellitus 0.6593 0.8075 22.48 9.99 11.37
Motor vehicle traffic accidents 0.4677 0.4878 4.30 7.09 6.87
Malignant neoplasms 0.5523 0.6056 9.65 8.37 8.53
Ischemic heart disease 0.7224 0.6989 -3.25 10.95 9.84
Total YLEL 6.5967 7.1018 7.66
Temporary life expectancy 53.4 52.9 -0.94
Females
Firearms 0.0267 0.0626 134.46 0.68 1.65
Diabetes mellitus 0.7043 0.7292 3.54 17.83 19.27
Motor vehicle traffic accidents 0.1080 0.1063 -1.57 2.73 2.81
Malignant neoplasms 0.2862 0.2692 -5.94 7.25 7.11
Ischemic heart disease 0.9373 0.8561 -8.66 23.73 22.63
Total YLEL 3.9492 3.7838 -4.19
Temporary life expectancy 56.05 56.21 0.29
Go
nzález-Pér
ez GJ
Figure 2. Years of life expectancy lost (YLEL) due to firearms-related deaths by age groups and sex. Mexico ,
2000-2002 and 2010-2012.
Source: Prepared by the authors based on data from the National Health Information System of the Ministry of Health, Mexico.
Table 3. Years of life expectancy lost (YLEL) due to selected causes of death in persons aged between 15 and 75
years, by age group and sex: Mexico, 2010-2012 .
Firearms Diabetes
Mellitus
Motor Vehicles
Traffic Accidents Ischaemic Heart Diseases
Malignant Neoplasms
Males
15-19 0,0898 0,0014 0,0634 0,0037 0,0266
20-24 0,1574 0,0040 0,0888 0,0085 0,0274
25-29 0,1640 0,0071 0,0756 0,0140 0,0267
30-34 0,1433 0,0148 0,0613 0,0202 0,0281
35-39 0,1135 0,0258 0,0523 0,0300 0,0353
40-44 0,0735 0,0469 0,0399 0,0408 0,0452
45-49 0,0473 0,0852 0,0324 0,0604 0,0610
50-54 0,0304 0,1255 0,0275 0,0845 0,0844
55-59 0,0171 0,1593 0,0209 0,1013 0,1044
60-64 0,0093 0,1645 0,0145 0,1076 0,1153
65-69 0,0044 0,1244 0,0084 0,0925 0,0997
70-74 0,0011 0,0487 0,0027 0,0420 0,0449
Females
15-19 0,0101 0,0021 0,0167 0,0017 0,0173
20-24 0,0113 0,0041 0,0173 0,0025 0,0163
25-29 0,0103 0,0065 0,0139 0,0038 0,0224
30-34 0,0084 0,0087 0,0104 0,0048 0,0346
35-39 0,0071 0,0163 0,0099 0,0086 0,0549
40-44 0,0054 0,0305 0,0082 0,0124 0,0747
45-49 0,0044 0,0596 0,0076 0,0209 0,1067
50-54 0,0026 0,1011 0,0069 0,0325 0,1293
55-59 0,0016 0,1427 0,0056 0,0422 0,1356
60-64 0,0009 0,1649 0,0051 0,0552 0,1275
65-69 0,0005 0,1362 0,0034 0,0550 0,0968
70-74 0,0001 0,0565 0,0012 0,0296 0,0402
Source: Prepared by the authors based on data from the National Health Information System of the Ministry of Health, Mexico. 0
0,02 0,04 0,06 0,08 0,1 0,12 0,14 0,16 0,18
15-19 20-24 25-29 30-34 35-39 40-44 45-49 50-54 55-59 60-64 65-69 70-74
hombres 2000-02 hombres 2010-12 mujeres 2000-02 mujeres 2010-12
15-19 20-24 25-29 30-34 35-39 40-44 45-49 50-54 55-59 60-64 65-69 0,02
0,04 0,06 0,08 0,1 0,12 0,14 0,16 0,18
0
70-74 males 2000-02
females 2000-02
e C
ole
tiv
a,
22(9):2861-2872,
2017
substantially, with malignant neoplasms and dia-betes mellitus causing the most YLEL.
Discussion
Although the mortality rate due to FA in Mexi-co in 2000 might not have been Mexi-considered low (6.9 per 100,000), it was nevertheless not among
the highest in the world35. However, since the
decline in that rate between 2000 and 2007, the risk to the Mexican population of death by FA has sharply increased recently. According to in-ternational statistics, Mexico in 2012 was among the countries with the highest mortality rates by FA worldwide, surpassed only by Latin American countries such as Honduras, El Salvador,
Gua-temala, Venezuela, Colombia and Brazil36,37, and
with a rate higher than that of the United States, the industrialized country with the highest
mor-tality rate due to FA38.
A comparison between the rates in Mexico and the United States better illustrates the chang-es that have occurred in recent years: whereas in 2000, the mortality rate from FA in Mexico was only two-thirds that of the United States (6.9 per
100,000 vs. 10.2 per 100,000)35, in 2012, it was
50% higher than the US rate (15.9 per 100,000
vs. 10.5 per 100,000)38.
Although an increase in FA-related deaths was observed for both sexes, it was more pro-nounced among men than women; thus, al-though the male excess mortality due to FA over the entire period studied is evident, it has been amplified since 2008. Indeed, the male rate has been at least 12-fold higher than the female rate since that time, including in 2008, when the male rate (18.5 per 100,000): female rate (1.11 per 100,000) ratio was 16.6: 1. These figures surpass
those observed in Argentina (10.6: 1)15 and the
United States (6.2: 1)38 in 2012.
In this context, it is worth emphasizing that if FA were considered a cause of death in 2012, it would rank as the sixth leading cause of death in Mexico due to the number of FA-related deaths in both sexes (18,707 in that year), causing more deaths than motor vehicle traffic accidents or chronic obstructive pulmonary diseases – to mention only a few of the causes that have tradi-tionally caused many deaths in the country – or any independently analyzed type of malignant neoplasm (trachea, bronchi and lung, breast, cervix or prostate) or other more lifestyle-relat-ed causes, such as alcoholic liver diseases or HIV/
AIDS20.
Because the vast majority of FA-related deaths over the last decade in Mexico were ho-micides, some arguments proposed in previous
studies1,2,18 to explain the evolution of the
homi-cide rate in Mexico, with a pattern similar to the rate of FA-related deaths in recent years, may be valid to understand the reduction in the mortal-ity rate from FA between 2000 and 2007 and its remarkable rise thereafter.
Thereby, although the decline appears related to certain structural improvements, such as the increase in gross domestic product per capita, a slight decrease in poverty levels and relative-ly low levels of unemployment, among others, the increase in FA-related deaths observed after 2007 would not only respond to the worsening of these conditions – which undoubtedly has oc-curred, as is the case of the increase in the
per-centage of people in poverty since 200839 – but
also to the effect of conjunctural factors. Such factors include the intensification of the fight against drug-trafficking cartels for the control of territories, which implies the use of even more powerful firearms (cartels have gone from the use of 38-mm revolvers to the use of assault rifles
such as the AK-47)40, the war against organized
crime undertaken by the Mexican government since 2007 (with the deployment of the army in much of the country), high levels of impuni-ty and corruption in the country’s securiimpuni-ty and
justice systems41,42 and the increasing number of
firearms in the hands of civilians, which mostly enter illegally along the border with the United
States1,35.
According to international sources, individu-als in Mexico circa 2007 had more than 15.5
mil-lion FA43, of which only 2.8 million were
regis-tered44. Most observers agree that the availability
of firearms increases the lethality of violence and moves in tandem with the increase in firearm
ho-micides35.
It is against this violent environment that the impact of firearms on the health of the Mexican population and particularly on the behavior of life expectancy in the country must be analyzed. Concurrent with the increase in FA-related deaths, in the period considered in this study, the male temporary life expectancy between 15 and 75 years was reduced by 1%, while the female temporary life expectancy increased by only 0.29%. These results are consistent with the slow-down observed in the increase in life expectancy
at birth in Mexico15.
Go
nzález-Pér
ez GJ
grown more in the decade analyzed, or at least would not have regressed as occurred among men, had the FA mortality rate not increased drastically in recent years and thus the number of YLEL from this cause. In particular, during the triennium 2010-12, the negative impact of FA-re-lated deaths on male life expectancy between the ages of 15 and 75 years was greater than that of the main causes of death in the country, with the greatest impact on younger ages evident in both sexes.
Unfortunately, almost no studies at the in-ternational level exist to compare the impact of firearms on life expectancy. One exception is the
study by Lemaire19, who estimated, using a
meth-odology different from the one employed in this study, the YLEL (from age 0) by FA for the United States in the year 2000 at 0.46 for men and 0.08 for women; both rates are above the YLEL found in this study for Mexico in the triennium 2000-2002 (although for the temporary life expectancy between 15 and 75 years).
The greater impact of FA-related deaths on male life expectancy must be understood from a gender perspective. While violence is not an ex-clusive practice of men, it is culturally related to male identity. Social norms not only assign males the role of protector and defender but also accept his role in yielding to violent, risky and extreme behaviors; thus, contextually, the possession of
an FA is a symbol of male power and status35.
Whereas men predominantly participate in ac-tivities of organized crime, particularly those of drug cartels that have great power derived from the possession and use of high caliber FA, alter-natively, in an environment where violence has been normalized, indeed glorified, in which inse-curity predominates and FA are easily accessible, conflict resolutions between men commonly
un-fold violently using FA18.
Together with these factors, conditions exist that favor the increase in violence among the youth population: social inequality, the lack of jobs (or the precarization of labor), the academ-ic impoverishment in secondary education that lowers the possibility of achieving appropriate scores for university admission and the lack of sufficient openings for study at public universi-ties, coupled with the fact that the largest number of adolescents and young people in the history of the country now exists, which generates a high number of young people between 15 and 29 years old who are not employed or enrolled in educa-tion or training (almost seven million according to the Organization for Economic Co-operation
and Development, OECD45). This constellation
of factors favors an increased likelihood that young people will be exposed to criminal acts or be involved in committing crimes, belong to a gang or be recruited by organized crime, which
increases the access of young people to FA46,47.
Concurrently, among many young people, the idea that having an FA in the home as nec-essary to defend oneself against crime is
wide-spread given the lack of trust in the authorities48.
The presence of a high number of FA on the black market and the ease of obtaining them, factors
that young people themselves recognize48, leads
to accidents, suicides with this type of weapon and many criminal acts involving FA, causing more FA-related deaths.
Many of the deaths caused by FA are consid-ered preventable, making this pandemic a prob-lem to be addressed by public health
profession-als35. However, analyzing the impact of deaths
caused by FA from an epidemiological approach does not imply that this issue is viewed from a medical perspective. What warrants recognition is that this problem is not only one of lacking se-curity but also a complex public health challenge and that moreover, any solution must involve the participation of different sectors and the discus-sion of knowledge from different disciplines to prevent deaths from this cause to the greatest
ex-tent possible13.
Clearly, FA are not essential to perpetrating violent acts. However, their importance resides in the fact that FA increase the reach and lethality of violence; therefore, disassociating them from violent conflicts must become an objective in itself in the context of public policies aimed at reducing violence. When this goal is successfully fulfilled, lives will be saved even if the rates of
ag-gression and robbery remain high35.
While reducing FA-related deaths is required to achieve an increase in life expectancy in Mex-ico, particularly that of men, it would be timely and necessary, not only for the country’s public health but also for national security, to design and standardize national and local preventive policies along with the generation of debate to analyze legislation on the possession, carrying and use of FA and the implementation of actions to control
the illegal entry of firearms into the country13,49.
e C
ole
tiv
a,
22(9):2861-2872,
2017
keeps FA in their homes regarding FA storage, corresponding safety measures and responsible FA use, as well as to stimulate amnesty policies for the owners of illegal FA through the imple-mentation of plans to repurchase or exchange FA
for toys49-51.
Evidently, policies concerning the control of FA must be viewed in the context of a compre-hensive policy that addresses the various
dimen-sions of violence14 because without an adequate
strategy to attack basic social problems, such as poverty, social inequality, unemployment and hence the lack of opportunities for a decent life, coupled with the need to reduce existing levels of impunity in the country and to re-evaluate exist-ing policies to reduce illegal drug traffickexist-ing and limit their consumption, the demand for FA and the number of deaths caused by them will scarce-ly be reduced.
Additionally, strategies devised to change the social and cultural norms that perpetuate vio-lence are necessary, particularly regarding the acceptance of FAs as conflict-resolution
instru-ments51, which is certainly not an easy task. This
undertaking implies the need to work with com-munities to ensure that people believe that they can successfully resolve conflicts peacefully and that violence is not necessary, nor FA, to resolve
disagreements52. In this context, the modification
of social norms should effectively contribute to reversing values that traditionally are associated with the hegemonic concept of masculinity and
that imply the exercise of violence 18. However,
for these strategies to be successful, drastic re-ductions in the levels of impunity and corrup-tion that permeate the country’s judicial system are necessary.
This study presents some limitations. First, although the coverage and quality of mortality records in Mexico is generally satisfactory and has improved markedly with respect to the final
decades of the previous century53, challenges
re-main. These include the underreporting of child deaths and maternal mortality rates in the states
with the greatest social marginalization54 that
might lead to an underestimation of mortality
rates and therefore an overestimation of life ex-pectancy. These factors warrant caution regard-ing the interpretation of any results extracted from the life tables, such as TLE or YLEL. How-ever, the fact that the differences were relatively small, i.e., less than 1%, between the official life expectancies and those calculated in the study (for example, official male life expectancy at birth
in 2012 was 71.415 and was estimated at 71.8 in
this study for the triennium 2010-12) allows us to assume that no overestimation occurred that was so marked as to substantially affect the inter-pretation of the results presented here.
Similarly, the lack of complete records con-cerning FA-related deaths or deficiencies in the information quality may be suspected, partic-ularly because the vast majority of FA-related deaths were due to homicide, which might have led to an underestimation of mortality by FA and YLEL from this cause. However, no evidence ex-ists that these problems occur in any particular triennium or that they are so prominent as to have a significant impact on the comparisons and analyses performed.
Finally, should other assumptions have warranted consideration for the calculation of
YLEL34, assuming any of them indeed were, the
results would not have altered the meaning of the findings based on the zero-mortality assumption. For example, had the real mortality assumption between 15 and 75 years been employed, althou-gh YLEL would have decreased for all causes compared to those calculated in this study, FA mortality would have remained as the main cau-se of YLEL for men in the triennium 2010-12.
Go
nzález-Pér
ez GJ
Collaborations
e C
ole
tiv
a,
22(9):2861-2872,
2017
References
1. González-Pérez GJ, Vega-López MG, Cabrera-Pivaral CE, Vega-Lopez A, Muñoz de la Torre A. Mortalidad por homicidios en México: tendencias, variaciones so-cio-geográficas y factores asociados.Cien Saude Colet
2012; 17(12):3195-3208.
2. Escalante-Gonzalbo F. Homicidios 2008-2009: La muerte tiene permiso. Nexos 2011; 397. [acceso 2015 Oct 31]. Disponible en: http://www.nexos.com.mx/?p-= 14089
3. Borges G, Orozco R, Benjet C, Medina-Mora ME. Sui-cidio y conductas suicidas en México: retrospectiva y situación actual. Salud Publica Mex 2010; 52(4):292-304
4. Williams P. El crimen organizado y la violencia en México: una perspectiva comparativa. ISTOR 2010; XI:15-40.
5. Sullivan JP, Elkus A, “State of Siege: Mexico’s Criminal Insurgency”. Small Wars Journal 2008. [acceso 2014 Sep 18] Disponible en: http://smallwarsjournal.com/blog/ journal/docs-temp/84-sullivan.pdf?q=mag/
6. Spinelli H, Alazraqui M, Zunino G, Olaeta H, Poggese H, Concaro C, Porterie S. Mortes e crimes cometidos com armas de fogo na cidade autônoma de Buenos Ai-res, 2002. Cien Saude Colet 2006; 11(Supl. 0):327-338. 7. Cook PJ, Ludwig J. Gun Violence: The Real Costs. New
York: Oxford University Press; 2000.
8. México. Diario Oficial de la Federación. Ley Federal de Armas de Fuego y Explosivos. Nueva Ley publicada el 11 de enero de 1972 Texto Vigente. Última reforma publicada DOF 12-11-2015 [acceso 2016 Mar 30]. Di-sponible en: http://www.diputados.gob.mx/LeyesBib-lio/ref/lfafe.htm
9. Goodman C, Michel M. U.S. Firearms Trafficking to Mexico: New Data and Insights Illuminate Key Trends and Challenges 2010. [acceso 2014 Sep 12]. Disponible en: http://mexicoinstitute.wordpress.com/2010/09/09/ new-reportu-s-firearms-trafficking-tomexico-new-da-ta-and-insights-illuminate-keytrends-and-challenges/ 10. Cook PJ, Ludwig J. The costs of gun violence against
children. Future Child 2002; 12(2):87-99.
11. Hemenway D. Risks and Benefits of a Gun in the Home.
American Journal of Lifestyle Medicine 2011; 5:502. 12. Tait G, Carpenter B. Firearm suicide in Queensland.
Journal of Sociology 2009; 46(1):83-98.
13. Spinelli H, Zunino G, Alazraqui M, Guevel C y Dar-raidou V. Mortalidad por armas de fuego en Argentina,
1990-2008. Buenos Aires: Organización Panamericana
de la Salud; 2011.
14. Zunino MG, Souza ER. La mortalidad por armas de fuego en Argentina entre 1990 y 2008. Cad Saude Pu-blica 2012; 28(4):665-677.
15. Pérez-Gómez LE. Esperanza de vida en México: De cómo los indicadores pueden señalar catástrofes. Perseo (Programa Universitario de Derechos Hu-manos, Universidad Nacional Autónoma de México), 2013. [acceso 2014 Nov 05]. Disponible en: http:// www.pudh.unam.mx/perseo/?p=5948
16. Boleda M, Arriaga E. América Latina: Mortalidad por accidentes y por violencia contra las personas. Notas
Población 2000; 28(70):87-119.
17. Dávila-Cervantes CA, Pardo-Montaño AM. Magnitud y tendencia de la mortalidad por homicidios en Co-lombia y México, 2000-2011. Rev Panam Salud Pública
2014; 36(1):10-16.
18. González-Pérez GJ, Vega-López MG, Cabrera-Pivaral CE.Impacto de la violenciahomicida en la esperanza de vida masculina de México. Rev Panam Salud Pública
2012; 32(5):335-342.
19. Lemaire J. The cost of firearms death in the United States: Reduced life expectancies and increase insur-ance costs. J Risk Insur 2005; 72(3):359-374.
20. Dirección General de Información en Salud (DGIS). Base de datos de defunciones 1979-2010. México: Sistema Nacional de Información en Salud (SINAIS). 2014. [acceso 2015 Oct 10]. Disponible en: http://www. sinais.salud.gob.mx
21. Consejo Nacional de Población. México en cifras / Proyecciones de la población 2010-2050 /Datos de proyecciones /Estimaciones (1990-2010) México, DF: CONAPO; 2014. [acceso 2015 Oct 13]. Disponible en: http://www.conapo.gob.mx/es/CONAPO/Proyeccio nes 22. Organización Mundial de la Salud (OMS). Clasificación
Estadística Internacional de Enfermedades y Problemas
relacionados con la Salud, Décima Revisión.
Washing-ton: OMS; 1995. (Publicación Científica 554). 23. Lozano-Ascencio R, Torres LM, Lara J, Santillán A,
González-Vilchis JJ. Accidentes de tráfico de vehículo de motor. Cambios derivados de la implantación de la 10ª Revisión de la CIE. Síntesis Ejecutiva 13, Secretaría de Salud, 2003. [acceso 2014 Nov 14] Disponible en: http://www.cemece.salud.gob.mx/descargas/pdf/SE-13_AccidentesTrafico.pdf
24. Organización Panamericana de la Salud (OPAS), Or-ganización Mundial de la Salud (OMS). Enfermedades Transmisibles y Análisis de Salud/Información y Análisis de Salud: Situación de Salud en las Américas: Indicadores
Básicos 2014. Washington: OPAS; 2014.
25. Organización Panamericana de la Salud (OPS). Área de Análisis de Salud y Sistemas de Información Sanitaria (AIS). Situación de Salud en las Américas: Indicadores
Básicos 2005. Washington: OPS; 2005.
26. Moreno C, Cendales R. Mortalidad y años potenciales de vida perdidos por homicidios en Colombia, 1985-2006. Rev Panam Salud Pública. 2011; 30(4):342-353. 27. Xunta de Galicia, Organización Panamericana de la
Salud. EPIDAT 3.1. Análisis epidemiológico de datos tabulados. A Coruña, Washington; Xunta de Galicia, OPS; 2006.
28. Coale A, Demeny P. Regional Model Life Tables and
Sta-ble Populations. Princeton: Princeton University Press;
1966.
29. Organización Panamericana de la Salud (OPS). Sobre la estimación de tasas de mortalidad para países de la región de las Américas. Boletín Epidemiológico 2003; 24(4):1-5.
30. Arriaga E. Los años de vida perdidos: su utilización para medir el nivel y el cambio de la mortalidad. Notas
Población 1996; 24(63):7-38.
Go
nzález-Pér
ez GJ
32. Pollard JH. On the decomposition of changes in ex-pectation of life and differentials in life expectancy.
Demography 1988; 25(2):265-276.
33. Dávila-Cervantes CA, Pardo-Montaño AM. Análisis de la tendencia de la mortalidad por homicidios en México entre 2000 y 2010. Rev Gerenc Polit Salud 2013; 12(24):163-183.
34. Bocco M. La relación entre los años de vida perdidos y la esperanza de vida: aplicaciones para el análisis de la mortalidad. Notas Población 1996; 24:39-60.
35. Cukier W, Sidel VW.The Global Gun Epidemic: From
Saturday Night Specials to AK-47s. Westport: Praeger
Security International; 2006.
36. Instituto CISALVA-BID SES. Sistema Regional de Indi-cadores estandarizados de convivencia y seguridad
ciu-dadana, Tasas de mortalidad por armas de fuego, 2014.
[acceso 2015 Nov 10]. Disponible en: http://www.segu-ridadyregion.com/images/descargas/Indicadores/Esp/ admon_ses_2014%20-%20arma%20de%20fuego.pdf 37. World Health Organization (WHO), UNODC, UNDP.
Global status report on violence prevention 2014.
Gene-ve: WHO; 2014.
38. Murphy SL, Kochanek KD, Xu J, Heron M. Deaths: Final Data for 2012. National Vital Statistics Reports, 2015: 63(9). [acceso 2015 Dic 12]. Disponible en: http://www.cdc.gov/nchs/data/nvsr/nvsr63/nvsr63_09. pdf
39. Consejo Nacional de Evaluación de la Política de De-sarrollo Social (CONEVAL). Evolución de las
dimen-siones de la pobreza 1990-2014. [acceso 2015 Dic 14].
Disponible en: http://www.coneval.gob.mx/Medicion/ EDP/Paginas/Evolucion-de-las-dimensiones-de-la-po-breza-1990-2014-.aspx
40. Graduate Institute of International and Development Studies. Small Arms Survey 2012. Moving Targets. New York: Cambridge University Press; 2012.
41. Amnistía Internacional. México bajo la sombra de la
im-punidad. [acceso 2015 Dic 14]. Disponible en: http://
www.derechos.org/nizkor/mexico/doc/ai.html 42. González L. El crecimiento del narco no es posible sin la
complicidad de las autoridades. [acceso 2015 Dic 14].
Disponible en: http://www.mdzol.com/nota/186992- el-crecimiento-del-narco-no-es-posible-sin-la-com-plicidad-de-las-autoridades/
43. Karp A. ‘Completing the Count: Civilian firearms.’ Small Arms Survey 2007: Guns and the City. Cambridge: Cambridge University Press; 2007.
44. Organización de Estados Americanos (OEA). Informe sobre seguridad ciudadana en las Américas 2012: Esta-dísticas oficiales de seguridad ciudadana producidas por
los Estados Miembros de la OEA. Washington: OEA;
2012.
45. OCDE. Panorama de la Educación 2014: Indicadores de la OCDE. Nota país: México. [acceso 2015 Dic 15] Disponible en: www.oecd.org/edu/Mexico-EAG2014-Country-Note-spanish.pdf
46. Thornberry T, Krohn MD, Lizotte AJ, Smith CA, Tobin
K. Gangs and delinquency in developmental perspective.
Cambridge: Cambridge University Press; 2003. 47. Bennett T, Holloway K. Gang membership, drugs and
crime in the UK. British Journal of Criminology 2004; 44:305-323.
48. González-Pérez GJ, Vega-López MG, Vega-López L, Muñoz de la Torre A, Valle-Barbosa A, Flores-Villavi-cencio ME. Violencia y armas de fuego: a problemas en aumento, soluciones inciertas. In: Flores-Villavi-cencio ME, González-Pérez GJ, Vega-López MG, coor-dinadores. Problemas de salud en los adolescentes. Una
perspectiva socioepidemiológica. Guadalajara: Ed.
Uni-versitaria; 2014. p. 26-36.
49. Villaveces A, Cummings P; Espitia VE, Koepsell TD, McKnight B, Kellerman AL. Effect of a ban on carry-ing firearms on homicide rates in 2 Colombian cities.
JAMA 2000; 283(9):1205-1209.
50. Hardy MS. Keeping children safe around guns: pitfalls and promises. Aggression and Violent Behaviour 2006, 11(4):352-366.
51. Organización Panamericana de la Salud (OPS). Pre-vención de la violencia: la evidencia. El Paso: OPS; 2013. 52. Cure Violence. Understand violence/ Changing behav-ior. [acceso 2016 Fev 18]. Disponible en: http://cure-violence.org/understand-violence/changing-behavior 53. Mathers C, Ma Fat D, Inoue M, Rao Ch, Lopez A.
Counting the death and what they died from: an assess-ment of the global status of cause of death data. Bull
World Health Organ 2005; 83(3):171-177.
54. Lozano-Ascencio R. ¿Es posible seguir mejorando los registros de las defunciones en México? Gac Med Mex
2008; 144(6):525-533.
Article submitted 09/05/2016 Approved 08/09/2016