The European Union: a Case of
‘Unconventional’ Fiscal Federalism?
∗
Paulo Vila Maior
Universidade Fernando Pessoa (Porto, Portugal)
Address for contact: Praça Nove de Abril, 349 PT – 4249-004 Porto, Portugal
Email: pvm@ufp.pt
ABSTRACT
There has been a lively debate among scholars about the feasibility and desirability of fiscal federalism in the European Union (EU). The paper addresses the question of whether ‘conventional fiscal federalism’ is feasible in the EU, considering the distinctiveness of European integration and the political-economic template of Economic and Monetary Union (EMU). It is an attempt to bridge the gap between economics and political science by adding the political conditions that might create difficulties to economics’ rationale.
The paper highlights how fiscal federalism is a multi-faceted concept embracing both a centralisation and a decentralisation outcome. Borrowing the Musgravian classification of allocation-equity-stabilisation, the EU is examined as far as redistribution is concerned. The aim is to conclude whether centralisation or decentralisation is the prevailing outcome. For that purpose, the EU is compared with five mature federations on two issues: the depth of regional asymmetries; and the extent to which regional inequalities are redressed through redistribution.
Considering that in the EU: i) the current distribution of fiscal competences is favourable to member states; ii) decentralisation is the outcome for the redistribution function; iii) despite monetary policy is the main tool for macroeconomic stabilisation, and this is a policy arena where centralisation prevails; iv) the diminished scope for inter-state solidarity averts more centralisation in redistribution; and v) national governments’ absent political willingness to increase the EU budget; all this suggests that centralised, ‘conventional fiscal federalism’ is ruled out as a feasible solution for the EU.
Notwithstanding this doesn’t imply that fiscal federalism is absent from the EU. A distinct, decentralised modality of fiscal federalism already exists, coping with the ‘sui generis’ nature of European integration.
INTRODUCTION
There is a connection between regional inequality and redistribution: redistribution exists because intra-country income asymmetries must be decreased, otherwise the federation’s stability can be jeopardised. A causal relationship is established between
∗ Paper for the UACES 36th. Annual Conference and 11th. Research Conference, ‘Exchanging Ideas on
inequality and redistribution: inequality is the motivation for redistribution. Section one examines the depth of regional imbalances within five federations (United States, Canada, Australia, Germany, and Switzerland). A separate sub-section takes the same task for the European Union (EU). Section two shows quantitative data that illustrate how much money is endowed to redistribution. Section three turns to the way regional inequalities are compensated in each federation, assessing the extent of redistribution, i.e., how money is transferred to the states. Finally, section four discusses whether there are political and economic conditions feeding growing centralisation of redistribution in the EU. Political conditions range from inter-state solidarity to the distinctiveness of European integration. In addition, economic requirements are brought into the discussion. They try to shed some light on the relevance of asymmetric shocks and the expected effects of macroeconomic stabilisation when automatic stabilisers are left to the national level.
1. INEQUALITY IN FIVE FEDERATIONS
The purpose of this section is to investigate the depth of regional imbalances within each federal country. Using available data, I will show the depth of interregional asymmetries in each federation. Those disparities can shed light on the different modalities of redistribution in federal countries, notably after scrutinising how homogeneous or heterogeneous each federation is when the wealth and income of its territorial units are compared.
At the outset it is expected that federal countries where redistribution is more pronounced find themselves trapped in accentuated inter-regional differences, while countries where redistribution is not so deep show a balanced scenario as far as regional wealth and income are considered. The reader must be aware that for each federation I use the statistical data available, collecting data for the three poorer and the three wealthier states. These data are the input for the next step: to calculate an average indicator for lower income and higher income states, and then observe the gap (the degree of the asymmetry) between the extremes.
There are just slight variations over the periods analysed, from 52.5 percentage points in 1980 to 57.8 percentage points in 1990, and to the best result achieved in 2000 – 48.7 percentage points. The figures reveal a slight increase in the imbalance from 1980 to 1990 followed by an improvement from 1990 to 2000.
Table 1: Unites States Disposable Personal Income Per Capita, per cent of USA Average (1980-2000)
1980 1990 2000
State Average % State Average % State Average %
Mississippi 71.7 Mississippi 69.8 Mississippi 74.5
Arkansas 76.2 Arkansas 75.8 Wst. Virginia 76.8
3 poorer
Sth. Carolina 77.8 Wst. Virginia 75.8 Arkansas 77.6
Average 75.2 73.8 76.3
Alaska 144.0 Connecticut 135.8 Connecticut 129.8
Connecticut 120.4 Columbia 133.7 Massachusetts 123.5
3 wealthier
California 118.6 New Jersey 125.4 New Jersey 121.8
Average 127.7 131.6 125.0
Source: US Census Bureau (2001: 427).
The US reveals a sluggish standard in what concerns state inequality: there have been ups and downs in offsetting income asymmetries. Comparing the standard for 1980 with the relative position in the year 2000, there was just a modest decrease in the imbalance between the contrasting groups of states. The conclusion is that redistribution tends to uphold a stable pattern of income differentiation between the states over time. The goal of redistribution is not to completely offset the disparities between the laggard and the frontrunner states.
Shifting the attention to Canada, the available data illustrate the income differentials in 1996.
Table 2: Canadian Gross Domestic Product by Province, 1996
1996
Province Average % of Canada
Newfoundland 77.0
Nova Scotia 79.6
3 poorer
Nunavut 79.9
Average 78.8
Ontario 110.6
British Columbia 105.0
3 wealthier
Alberta 101.9
Average 105.8
Source: Prepared by the Canadian Council on Social Development, using data from Statistics Canada, Income Distributions by Size in Canada 1996 (cat. no. 13-207-XPB), online at
http://www.ccsd.ca/factsheets/fsavin96.htm, assessed in 25.03.03.
Canadian federation were at the outset smaller than in the US, or that redistribution is much more successful in Canada than in the US.
There is another important aspect that must be considered: in terms of territorial characteristics the US federation is more dispersed than Canada. While the US comprises 51 states Canada is divided in only 12 provinces. If one acknowledges that the territorial dimension of the two countries is not that different, this contrast might provide a powerful explanation for the lower gap between Canadian provinces. The reason is the big aggregation in the Canadian territory, which might explain that income differences within the same province don’t show up. The implication might be lower income differences among Canadian provinces. For these reasons a measure of relativity must be introduced when the results of the US and the Canadian income imbalances are interpreted.
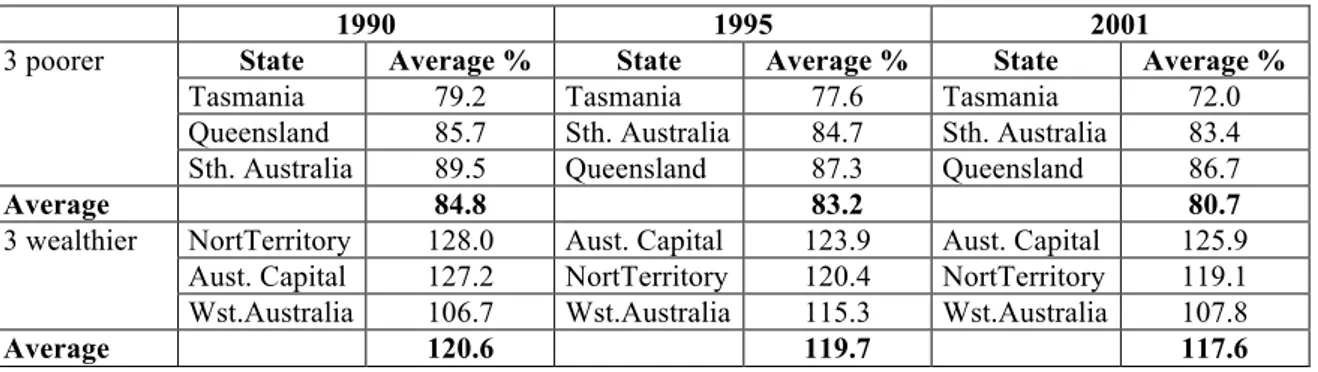
The Australian federation is an interesting case for the stable pattern observed, as the time series included in table 3 reveal.
Table 3: States’ Ratio to Australian per capita GDP, 1990-2001
1990 1995 2001
State Average % State Average % State Average %
Tasmania 79.2 Tasmania 77.6 Tasmania 72.0
Queensland 85.7 Sth. Australia 84.7 Sth. Australia 83.4
3 poorer
Sth. Australia 89.5 Queensland 87.3 Queensland 86.7
Average 84.8 83.2 80.7
NortTerritory 128.0 Aust. Capital 123.9 Aust. Capital 125.9
Aust. Capital 127.2 NortTerritory 120.4 NortTerritory 119.1
3 wealthier
Wst.Australia 106.7 Wst.Australia 115.3 Wst.Australia 107.8
Average 120.6 119.7 117.6
Source: International Monetary Fund (2002).
The difference between the average of the lower income states and the average of the higher income states shows a constant decrease for both categories, and more interestingly yet, the gap between both categories is fairly stable over time: 35.8 percentage points for 1990, 36.5 for 1995, and 36.9 for 2001. Although deterioration in the imbalance between richer and poorer states is noticed, this was a negligible effect. In the time span considered the Australian federation was able to keep the same pattern of regional asymmetries, basically standing at the same point where it was eleven years before.
narrower gap in Canada. Nevertheless, the same remarks that explained the plausibility of the Canadian results must be taken into consideration in the Australian federation. This country also comprises a huge territory divided in eight geographical units. This might hide other income imbalances artificially offset by the dynamics of Australian territorial politics.
Germany provides an interesting case for the wide income differentiation among its
Länder, as table 4 reveals.
Table 4: Länder GDP per capita (current prices) relative to Germany average)
1995 2002
Länder Average % Länder Average %
Thuringia 89.3 Mecklenburg Pomerania 66.1
Saxony-Anhalt 89.3 Saxony-Anhalt 66.1
3 poorer
Saxony 91.9 Thuringia 66.2
Average 90.2 66.1
Hamburg 185.7 Hamburg 170.4
Bremen 163.4 Bremen 136.0
3 wealthier
Hessen 161.7 Hessen 123.2
Average 170.2 143.2
Source: Siebert (2004), table A.2, and http://www.statistik-bw.de/Arbeitskreis_VGR/tab12.asp, assessed in 07.12.04.
These figures show exacerbated income regional disparities. Despite noticing a slight narrowing between the wealthier and the poorer Länder between 1995 and 2002 (from 80.0 percentage points to 77.1 percentage points), a considerable asymmetry remains within the German federation. From all the federations so far examined this is the one where income imbalances between constituent states are more extensive. Furthermore the improvement is only marginal: in seven years the difference between the three richest and the three poorer Länders’ average only diminished from 80 to 77 percentage points.
Extensive income differentials owe much to the reunification process. There were huge differences between eastern and western Länder, therefore it is not a surprise that the statistical data show these income asymmetries. Hence, one might ask whether this represents Germany’s redistribution function lower efficiency. Nevertheless, this is not the appropriate method to assess the success achieved by redistribution. The crucial aspect is the nature of the redistribution function in Germany, and the specific model chosen for correcting income imbalances.
income loss with the previous fiscal year as the starting point for observation. It is likely that horizontal transfers operate from the poorer towards the wealthier state, as long as the criteria for eligibility are satisfied (finanzausgleich).
The data suggest that redistribution in Germany is unable to correct the higher income differentials among its Länder. Perhaps this is not surprising if the main feature of redistribution in this country – horizontal transfers – is kept in mind. Despite the higher degree of inter-state solidarity (in relative terms – for example when this feeling is compared with the EU as a whole) probably Germany is the evidence that the correction of regional imbalances must be endowed to the central government, where solidarity links are more intense. This might be a plausible explanation for the diminished attention Germany pays to redistribution, when Canada and the US are set as yardsticks. Finally the results for the Swiss federation are illustrated in table 5. Similarly to Germany, the Swiss federation shows the higher rank of income inequality between its cantons: the difference between the average of the three richest cantons and the three lower income cantons peaks at 85.8 percentage points.
The characterisation of Swiss territorial politics influences the inequality pattern. Considering the small geographical dimension of Switzerland, there is a striking difference between this aspect and the disproportionate number of cantons (26), an element of dispersion in Swiss territorial politics. Switzerland contrasts with Canada and Australia: in the Swiss case a tiny territory is reserved to each canton, while in Canada and Australia a large territory corresponds to each province and state (respectively).
Table 5: Swiss National Income by Cantons, 2001
2001
Canton Average % of Switzerland
Obwalden 67.3
Valais 70.1
3 poorer
Fribourg 75.7
Average 71.0
Basel City 181.2
Zug 163.7
3 wealthier
Nidwalden 125.6
Average 156.8
Source: available online at http://www.statistik.admin.ch/stat_ch/ber04/eufr04.htm, assessed in 28.03.03.
where a canton corresponds to a localised area of lower income, is also noticeable (especially due to the fact this country has mountain regions, where topography is not friendly to human activity). The fact that the highest income canton is Basel city is instructive of the nature of these income asymmetries. Taking that canton as a specific territorial jurisdiction, with a huge concentration of industrial activity, helps understand why there is a huge income differential between this canton and the others.
Another interesting conclusion is that decentralisation might be the explanation for the wide margin between low and high cantons’ income average. Even though there is a perceived status of inter-cantonal cohesion this is not enough to prevent huge income asymmetries from taking place. Cantons are the masters of redistribution, and it seems that their priorities are not geared towards the correction of cantonal imbalances. A possible interpretation is that Switzerland (just it might happen in Germany) doesn’t put so much faith in redistribution, but instead in the macroeconomic stabilisation function. Importantly, this can shed some light to the EU case on a twofold sense: federalism can be geared towards decentralisation, and stabilisation might be the priority instead of
redistribution.
2. INEQUALITY IN THE EUROPEAN UNION
For methodological reasons, the measurement of inequality covers income asymmetries between EU member states. If the EU is compared with other federations, it makes sense that the EU plays the role of the central level (as the federal tier does in federations) and member states take the same place as states, provinces, territories,
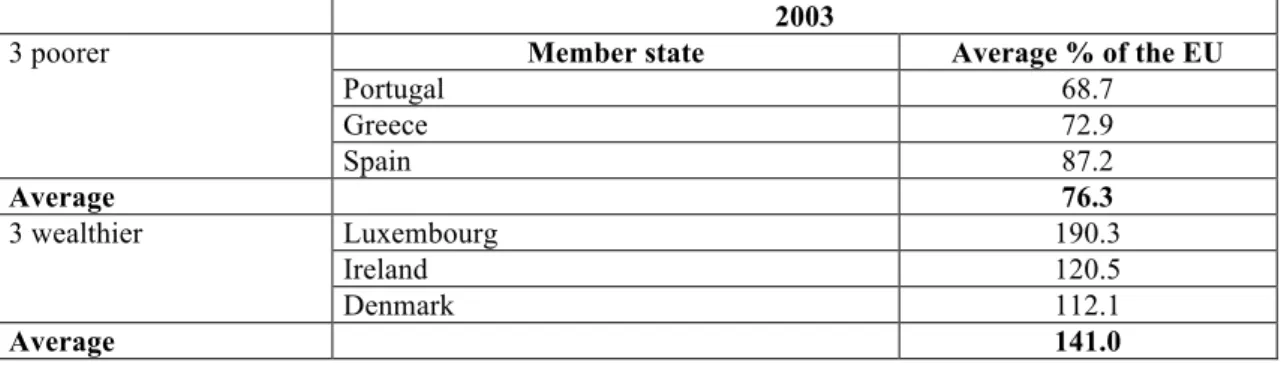
Länder and cantons in the federal countries examined. Table 6 shows these imbalances (the table ignores the effects of the 2004 enlargement):
Table 6: The member states of the EU15 with the lowest/highest GDP per capita, 2003 (in PPS)
2003
Member state Average % of the EU
Portugal 68.7
Greece 72.9
3 poorer
Spain 87.2
Average 76.3
Luxembourg 190.3
Ireland 120.5
3 wealthier
Denmark 112.1
Average 141.0
Huge differences between the three poorer and the three wealthier EU countries still remain. Surprising results however emerge when the EU is compared with other federal countries. The difference between the average index of higher and lower income member states reaches 64.7 percentage points. Thus the EU performs better than Germany and Switzerland, where the income inequality index is higher (77.1 and 85.8 percentage points, respectively). This finding is a powerful reason for rejecting the operation of ‘conventional fiscal federalism’ in the EU, especially when one of the crucial arguments used to support redistribution at a centralised level stems from the claim that widespread inequality within the EU can affect the coherent run up of EMU.
3. THE PATTERN OF REDISTRIBUTION
3.1. Quantitative data: the connection between inequality and redistribution
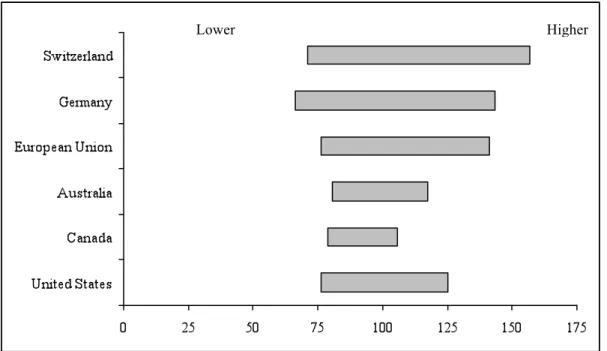
Some attention must be paid to the comparison between the five federations and the EU. This exercise only looks at the later data available, ignoring the inter-temporal dimension. Fig. 1 reveals a straightforward tendency.
Fig. 1: Comparison of income differentials in the five federal countries and the European Union
Considering that redistribution is largely dominated by centralisation in Canada and the US (through the operation of the federal tax system and vertical transfers), and that Australia, Germany and Switzerland are the paradigms of decentralised redistribution (dependent upon horizontal transfers, or a complex system where the emphasis is on
cantons, as in the Swiss case), a conspicuous finding comes to the surface. There is some correlation between lower income differentials and countries where redistribution
is made at the central level, while on the opposite side an association between
decentralised redistribution and higher income asymmetries is noticed.
The data reveal this tendency quite clearly, although there is an exception: Australia’s income inequality is lower than the US (respectively 36.9 and 48.7 percentage points). This comparison shows that decentralised redistribution is able to perform better than centralisation. But it is undisputed that Germany and Switzerland, those countries where redistribution heavily relies on decentralised mechanisms, stand far beyond the inequality pattern of the remaining federal countries (respectively 77.1 and 85.8 percentage points, against 27.0 percentage points in Canada).
However clear these findings might be, their interpretation is more problematic. One cannot immediately conclude that a system of centralised redistribution is more successful than a decentralised model. Other aspects might obscure such conclusion:
i) The historical evolution of states’ income inequalities in all federations; ii) The depth of the initial imbalances calling for an intervention through
redistribution. The results of redistribution can’t be interpreted the same way in federations where inequalities were pronounced as in federal countries where asymmetries were not that large;
iii) The measure of cohesion among states makes a certain pattern of income asymmetry acceptable with the political and economical operation of the federation;
iv) And the preference to tackle regional imbalances through a function other than redistribution, that is, macroeconomic stabilisation.
Table 7: The extent of redistribution in the five federations and the EU
Countries % of central budget expenditures
% of GDP
Australia (1) 31.1 7.0
Canada (2) 33.2 3.9
United States (3) 17.9 3.6
Switzerland (4) 13.1 2.0
Germany (5) 12.5 1.7
European Union (6) 42.9 0.4
Notes:
(1) Commonwealth payments to state and local governments 2003-04 (estimated).
Source: http://www.budget.gov.au/2004-05/bp3/html/bp3_main-01.htm, assessed in 30.11.04.
(2) The program expenses outlook (2002-03).
Source: http://www.fin.gc.ca/budget04/bp/bpc3e.htm#financial, assessed in 31.11.04.
(3) Summary comparison of total outlays for grants to state and local governments (2003).
Source: http://www.whitehouse.gov/omb/budget/fy2005/pdf/hist.pdf, table 12.1, assessed in 30.11.04.
(4) Transfer payments in 2001. Sources:
http://www.bfs.admin.ch/bfs/portal/fr/index/infothek/lexikon/bienvenue___login/blank/zugang_l exikon.topic.1.html, assessed in 06.12.04,and Dafflon (2004, table 3).
(5) The program expenses outlook (2002).
Sources: http://www.destatis.de/basis/e/fist/fist03.htm, assessed in 06.12.04, and Wurzel (2003).
(6) Transfers from the EU budget to member states (2004). Observation: EU budget expenditures include “structural operations” and “pre-accession strategy”.
Source: http://europa.eu.int/comm/budget/pdf/budget/syntchif2004/en.pdf, assessed in 06.12.04.
Interestingly, Australia is the federation where the larger proportion of national income is devoted to inter-regional redistribution (7.0% GDP). One can assume that the larger the part of national income endowed to vertical transfers, the higher are regional inequalities. Going back to the data on Fig. 1, however, the perception is not consistent with this theoretical assumption. Australia ranks second when regional inequalities are observed in the five federations. The good results in terms of regional inequality might be explained by the considerable role redistribution plays in Australia: because redistribution is high, inequality is softened.
Switzerland and Germany stand at the bottom of the scale (respectively 2.0 and 1.7 GDP). Two reasons explain the difference: the most important is, perhaps, decentralised redistribution where horizontal transfers play a major role. Centralised redistribution is not as important as in other federations that rely on vertical transfers. Australia is the exception. Secondly, a connection between decentralised redistribution and higher regional inequality is discernible: Germany and Switzerland performances’ are worst when their regional inequalities parameters are compared with the other federations. As far as the EU is considered, the finding that redistribution provided by the EU budget is very low is not surprising (only 0.4 EU GDP, despite transfers to member states represent 42.9 of EU budget expenditures – even higher than the United States federal budget, where this indicator is higher among the other federations). The characteristics of redistribution in the EU are explored in the next sub-section. So far it is noticeable that the EU ranks alongside those federations where inequality between states is higher (the inequality index of the EU is similar to Germany and Switzerland). This reinforces the idea of a close relationship between higher regional inequality and lower central redistribution.
3.2. Redistribution in the EU: again the emphasis on decentralisation
To envisage the general pattern of federal countries’ redistribution in a supranational polity might be problematic, because member states are still the most intense focus for citizens’ loyalties. Inter-personal redistribution at the supranational level is far away from meeting the political conditions in the EU: not least because the degree of inter-state solidarity is low, but also (and mainly) because it requires an instrument not available at the supranational level (income taxes). National governments’ resistance to transfer competences to the supranational level as far as income taxes are concerned is reiterated (Eijffinger and de Haan 2000).
redistribution in the second group of federal countries. Nevertheless, the decentralised aspects of redistribution prevail over the centralised ones.
Viewed from this perspective, it is wrong to conclude that EMU sustainability depends of ‘conventional fiscal federalism’. The reasoning behind those who support ‘conventional fiscal federalism’ is that redistribution is largely centralised. However it is clear that such idea doesn’t fit with the distinctiveness of European integration. Since decentralised redistribution also exists in mature federations, one might ask whether the EU already meets this characteristic.
The distribution of competences in the EU provides indisputable evidence that decentralised redistribution prevails. The supranational budget is negligible, especially in terms of explicit redistribution (structural funds seeking economic and social cohesion) (Armstrong, Taylor and Williams 1997, and Laffan 1997), but less when implicit redistribution comes to the surface (mainly through the thorny effects of the Common Agricultural Policy) (Penketh 1999, and Levitt and Lord 2000). Therefore, the EU approximates to the fiscal federalism parameters of those countries where decentralisation prevails.
It is nevertheless important to realise that the EU stands at the extreme of decentralisation. Redistribution is mainly performed at the national level. By this token,
the EU is even more decentralised than the most decentralised system of redistribution
(among the five federal countries under assessment). Maybe for this reason the EU doesn’t match ‘conventional fiscal federalism’, because it is too decentralised in terms of redistribution. For the same reason, this is a powerful reason for an increased role of the EU budget for redistribution purposes: since the imbalances between EU member states are deeper than in other federations, there might be a strong (economic) argument for centralised redistribution in the EU.
Germany and Switzerland entangles states in directly reciprocal transfers through horizontal redistribution, no such mechanism is available in the EU.
Thus, the presumption of decentralised redistribution in the EU cannot be understood as a similarity with those three federal countries. In the EU a largely decentralised redistribution function means that redistribution is mostly implemented at the national level. The beneficiaries are regions of the member state that designs and implements redistribution. What is missing in the EU decentralist dimension of redistribution is horizontal transfers. In the context of European integration, decentralised redistribution only means that this function operates within each member state, not among them.
4. REDISTRIBUTION AT THE REGIONAL LEVEL
After examining the relative importance of redistribution for each federation and the EU, the paper pays attention on how transfers are distributed within each federation (and the EU), i.e., who takes the biggest share of vertical transfers1.
It is interesting to find out whether there is a correlation between inequalities and transfers, i.e., whether laggard states are the biggest recipients from vertical transfers. The method uses the latest statistical data related with federal budget transfers for each sub-national government and gives per capita measures as well as the relative weight in terms of the federation’s total.
Table 8 presents the data for the United States. They must be read together with table 1, where US regional inequalities are described. The data on regional redistribution are not consistent with the inequality pattern observed in table 1. Firstly, the laggard states (Mississippi, West Virginia and Arkansas) are not among the states that receive more vertical transfers: the District of Columbia (transfers per capita represent 13.7% of the total), Alaska (2.7%) and Virginia (2.4%) stand at the top of the scale. Secondly, the wealthier states (Connecticut, Massachusetts and New Jersey) are not among the states that receive fewer transfers from the federal budget: these are Nevada (1.1%), and Minnesota, New Hampshire and Wisconsin (each with 1.2%). The data show an absent correlation between both groups of states and the identification of net receivers and
1
states that collect less vertical transfers. This might suggest that transfers are not the only tool available to mitigate states’ income asymmetries.
Table 8: Redistribution at the state level: United States (2002, dollars)
State Per capita (USD) % of transfers (per capita)
Alabama 7,643.2 1.8
Alaska 11,745.6 2.7
Arizona 6,370.6 1.5
Arkansas 6,779.1 1.6
California 5,887.7 1.4
Colorado 5,820.3 1.4
Connecticut 7,336.2 1.7
Delaware 5,902.9 1.4
District of Columbia 58,737.6 13.7
Florida 6,271.3 1.5
Georgia 5,996.9 1.4
Hawaii 8,413.5 1.9
Idaho 6,246.8 1.4
Illinois 5,577.1 1.3
Indiana 5,552.7 1.3
Iowa 6,414.9 1.5
Kansas 6,441.9 1.5
Kentucky 7,056.0 1.6
Louisiana 6,689.7 1.6
Maine 7,111.1 1.6
Maryland 9,075.8 2.1
Massachusetts 7,386.7 1.7
Michigan 5,562.8 1.3
Minnesota 5,389.8 1.2
Mississippi 7,419.6 1.7
Missouri 7,465.1 1.7
Montana 7,668.2 1.8
Nebraska 6,698.3 1.5
Nevada 4,939.9 1.1
New Hampshire 5,440.5 1.2
New Jersey 5,898.8 1.4
New Mexico 9,421.5 2.2
New York 6,733.3 1.6
North Carolina 5,790.7 1.3
North Dakota 10,150.5 2.3
Ohio 5,776.5 1.3
Oklahoma 6,971.1 1.6
Oregon 5,633.7 1.3
Pennsylvania 6,939.6 1.6
Rhode Island 7,014.1 1.6
South Carolina 6,355.5 1.5
South Dakota 8,297.2 1.9
Tennessee 6,774.8 1.6
Texas 5,667.2 1.3
Utah 5,311.1 1.2
Vermont 6,666.8 1.5
Virginia 10,219.5 2.4
Washington 6,626.7 1.5
West Virginia 7,414.9 1.7
Wisconsin 5,300.9 1.2
Wyoming 7,351.3 1.7
American Samoa 2,691.4 0.6
Federal States of Micronesia 1,326.1 0.3
Guam 7,194.9 1.7
Marshall Islands 3,589.6 0.8
Northern Marianas 1,474.4 0.3
Palau 2,145.6 0.5
Puerto Rico 3,644.1 0.8
Virgin Islands 5,271.1 1.2
United States 6,527.2 100.0
Other aspects might be influential as well, as it is demonstrated by the huge gap between the District of Columbia and the remaining states. This conclusion is validated by the fact that two of the higher income states (Connecticut and Massachusetts) get the same per capita transfers as two of the lower income states (Mississippi and West Virginia) – 1.7% of the total. This suggests that regional imbalances are not corrected only through vertical transfers. It is, therefore, consistent with the characteristics of the US system of redistribution, which relies in other instruments (notably the federal tax system).
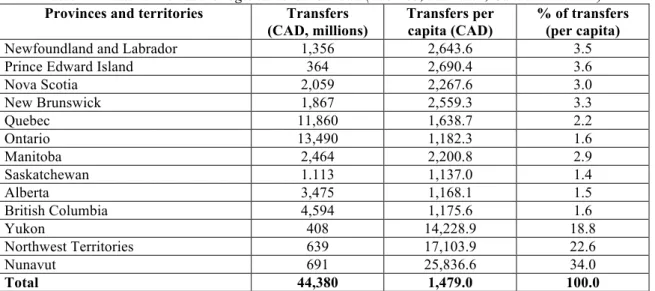
Table 9 shows the data for Canada. This table must be read together with table 2 (data for Canadian provinces’ inequality). Among low income provinces (Newfoundland, Nova Scotia and Nunavut) only the latter comes up in the three provinces that get more transfers from the federal budget. Nunavut collects 34.0% of the total, followed by the Northwest Territories (22.6%) and Yukon (18.8%). Newfoundland and Nova Scotia, the poorer provinces according table 2, only receive per capita transfers of 3.5% and 3.0% of the total, respectively.
Table 9: Redistribution at the regional level: Canada (2002-03, estimated, Canadian dollars)
Provinces and territories Transfers (CAD, millions)
Transfers per capita (CAD)
% of transfers (per capita)
Newfoundland and Labrador 1,356 2,643.6 3.5
Prince Edward Island 364 2,690.4 3.6
Nova Scotia 2,059 2,267.6 3.0
New Brunswick 1,867 2,559.3 3.3
Quebec 11,860 1,638.7 2.2
Ontario 13,490 1,182.3 1.6
Manitoba 2,464 2,200.8 2.9
Saskatchewan 1.113 1,137.0 1.4
Alberta 3,475 1,168.1 1.5
British Columbia 4,594 1,175.6 1.6
Yukon 408 14,228.9 18.8
Northwest Territories 639 17,103.9 22.6
Nunavut 691 25,836.6 34.0
Total 44,380 1,479.0 100.0
Sources: http://www12.statcan.ca/english/census01/products/standard/popdwell/Table-PR.cfm and
http://www.fin.gc.ca/FEDPROV/mtpe.html, assessed in 08.12.04, and own calculations.
Interestingly, however, there is some correlation when the connection is established between wealthier provinces and those provinces that receive fewer transfers. The three richest provinces are (table 2) Ontario, British Columbia and Alberta. The ranking of vertical transfers shows that two of them (Alberta and British Columbia) get less money from the federal budget (1.5% of total transfers for both). Ontario is the exception, as it is not included in this group: Saskatchewan takes Ontario’s place (1.4% of the total). Ontario is not far away, as federal budget transfers’ amount to 1.6%. The comparison between both extremes of inequality and redistribution patterns reveals a mixed perception: on the one hand, there is no correlation between inequality and transfers when low income provinces are examined; on the other hand, higher income provinces get fewer vertical transfers.
Table 10 illustrates the regional redistribution pattern in Australia. These data must be compared with data for regional inequality (table 3).
Table 10: Redistribution at the regional level: Australia (2003-04, estimated, Australian dollars)
States and territories Transfers (AUD millions)
Transfers per capita (AUD)
% of transfers (per capita)
New South Wales 17,671.7 2,773.4 8.5
Victoria 12,553.8 2,702.7 8.3
Queensland 10,990.5 3,006.9 9.3
Western Australia 5,733.8 3,097.2 9.6
South Australia 4,998.6 3,406.7 10.5
Tasmania 1,985.1 4,347.6 13.4
Australian Capital Territory 1,072.3 3,438.0 10.6
Northern Territory 2,032.5 9,651.0 29.8
Total 57,038.4 3,006.4 100.0
Sources:
http://www.abs.gov.au/ausstats/abs@census.nsf/Census_BCP_ASGC_ViewTemplate?ReadForm&Expan d=1, and http://www.budget.gov.au/2004-05/bp3/html/bp3_main-01.htm assessed in 30.11.04, and own calculations.
(Australian Capital Territory, Northern Territory and Western Australia) is among the states that get less money from vertical transfers.
These findings are instructive of the absent correlation between vertical transfers and Australia’s inequality pattern: the main instrument of redistribution lies outside vertical transfers. Also the large territorial dimension of sub-national units might be an explanation for the fuzzy pattern of vertical transfers. Intra-state asymmetries might be hidden by each state’s GDP data. Consequently, the redistribution pattern cannot be directly connected with states’ income differentials, because the unit of analysis is too broad to cover the asymmetries that matter.
Data on regional redistribution for Germany are shown in table 11. They must be analysed together with table 4, where inequality among the Länder is illustrated.
Table 11: Redistribution at the regional level: Germany (2002, euro)
Länder Federal grants per
capita
Per cent of total
Receiving equalisation payments (pc)
Per cent of total
Making equalisation payments (pc)
Per cent of total
Baden-Würt. - - - - 155.5 18.6
Bavaria - - - - 164.8 19.7
Brandenburg 710.7 10.8 210.1 7.2 - -
Hessen - - - - 313.7 37.4
Mecklenburg 789.3 12.0 253.5 8.6 - -
Lower Saxony 101.2 1.5 60.9 2.2 - -
North Rhine - - - - 90.0 10.7
Rhineland-Pal. 142.6 2.2 103.2 3.7 - -
Saarland 545.7 8.3 131.0 4.5 - -
Saxony 736.2 11.2 242.3 8.3 - -
Saxony-Anhalt 791.1 12.0 240.6 8.2 - -
Schleswig-Hols. 101.3 1.5 39.7 1.5 - -
Thuringia 770.7 11.7 240.6 8.2 - -
Berlin 755.0 11.4 790.1 26.8 - -
Bremen 1,146.3 17.4 613.9 20.8 - -
Hamburg - - - - 113.6 13.6
Total 191.1 100.0 90.2 100.0 90.2 100.0
Sources: http://www.destatis.de/basis/e/fist/fist023.htm, and http://www.statistik-portal.de/Statistik-Portal/en/en_jb01_jahrtab1.asp, assessed in 08.12.04, and own calculations.
The examination of Germany’s redistribution is more complex. Statistical data gather information for vertical and horizontal transfers. In Germany horizontal transfers are the key instrument, and vertical transfers perform a level-playing field role because they compensate the remaining asymmetries after the operation of horizontal transfers. For this reason both forms of transfers must be examined.
Data on horizontal transfers bring a surprising result: the second higher income Länder
income Länder. The first state among lower income Länder comes in the third place (Macklenburg-Pomerania, with 8.6% of the total). The specific context of reunification might be a powerful reason to understand why Berlin benefits from such a large share of horizontal transfers. The same cannot be said of Bremen’s favourable position in this ranking. The reader must be aware, however, that the rationale behind horizontal transfers is different from vertical transfers. Horizontal transfers address annual shortfalls in a Länder’s tax revenue. The fact that wealthier states become eligible for horizontal transfers doesn’t fit with long-term interregional redistribution. In this respect Germany’s redistribution is very different from redistribution in federations like the U.S or Canada.
Although vertical transfers are not so important in Germany, it is interesting to survey the data for them. Bremen takes the lead again (17.4% of the total), preceding Macklenburg-Pomerania and Saxony-Anhalt (12.0% for both). Even after the operation of generous horizontal transfers for Bremen this Länder was still below the average threshold. As a result, Bremen was granted more vertical transfers than any other state. With this explanation in mind, redistribution is not geared towards medium-to long-term inequality cuts. It only seeks to redress short-run imbalances.
Even though this aspect emerges from the German system of redistribution, there is some correlation between inequality and vertical transfers. Among the states that get more money from vertical transfers, two are inside the lower income Länder group. This correlation is weaker when the relationship is established between high income
Länder and net contributors. Only one of the richest states is included among the
Länder that pay more horizontal transfers (Hessen supports 37.4% of the total). But Hamburg – the wealthier state, as table 4 shows – is not among this group. Five Länder
take the role of net contributors for the mechanism of horizontal transfers, and Hamburg comes up in the fourth place (with 13.6% of the total).
Table 12 presents the data for Swiss regional redistribution. The reader must be aware that these data only include vertical transfers. Data were not available for horizontal transfers. This is an important aspect to be highlighted, since decentralised redistribution is very important in the Swiss context. Table 12 must be examined together with table 5.
Fribourg) only Obwalden ranks in a top position in what concerns cantons that collect more money from vertical transfers (6.4% of the total). Uri (10.0%) and Jura (8.1%) come before Obwalden, despite neither of these cantons is within the group of lower income cantons.
Table 12: Redistribution at the regional level: Switzerland (2001, Swiss francs)
Cantons Transfers (SFR, millions)
Transfers per capita (SFR)
% of transfers (per capita)
Zug 226.4 2,261.7 3.4
Basle City 376.6 2,002.1 3.0
Zurich 1,951.7 1,564.0 2.4
Genève 648.7 1,568.0 2.3
Nidwalden 112.6 3,026.9 4.5
Basle Land 302.6 1,166.5 1.7
Schaffhouse 98.5 1,342.0 2.0
Argovie 706.5 1,290.4 1.9
Schwyz 262.5 2,039.6 3.1
Vaud 1,219.0 1,902.6 2.8
Thurgovie 304.5 1,330.3 2.0
Soleure 365.1 1,494.5 2.2
St. Gall 805.6 1,779.2 2.7
Glaris 78.3 2,049.7 3.1
Tessin 628.3 2,047.9 3.1
Grisons 788.9 4,216.5 6.3
Lucerne 713.8 2,036.5 3.1
Uri 232.6 6,683.9 10.0
Berne 2,179.9 2,277.4 3.4
Appenzell Rh. Int 43.3 2,965.7 4.4
Appenzell Rh. Ext. 109.7 2,050.4 3.1
Neuchâtel 565.2 3,366.3 5.0
Fribourg 722.5 2,989.2 4.5
Obwalden 139.2 4,296.3 6.4
Jura 367.6 5,390.0 8.1
Valais 1,013.3 3,719,9 5.5
Total 14,962.9 2,053.1 100.0
Sources:
http://www.bfs.admin.ch/bfs/portal/fr/index/infothek/lexikon/bienvenue___login/blank/zugang_lexikon.t opic.1.html, assessed in 10.12.04, Dafflon (2004, table 2), and own calculations. Note: transfers include federal grants-in-aid and revenue sharing.
Table 13 shows the distribution of the EU budget equivalent to vertical transfers. As it was already explored before, the EU is hardly comparable to mature federations when redistribution is assessed. The first reason is the tiny dimension of the EU budget. Secondly, redistribution has been left to national competences. And, very importantly, the lack of inter-state solidarity (see section 5.1, below) prevents the EU from performing a substantial role in redistribution. The EU budget redistributive role is modest. It is, therefore, interesting to extend the exercise that has been done for all mature federations. Again the data on intra-EU inequality (table 6) must be compared with data on how the EU allocates structural funds to member states (table 13).
Table 13: Redistribution through the EU budget (only structural operations) (2000-06, euros)
Member states Transfers (euro, millions)
Transfers per capita (euro)
% of transfers (per capita)
Belgium 2,038 196.0 2.0
Denmark 822 152.2 1.5
Germany 29,797 361.2 3.7
Greece 24,880 2,261.8 23.0
Spain 56,297 1,383.2 14.1
France 15,669 262.9 2.7
Ireland 3,803 950.7 9.7
Italy 29,636 517.2 5.3
Luxembourg 92 199.4 2.0
Netherlands 3,223 198.9 2.0
Austria 1,848 228.1 2.3
Portugal 22,822 2,194.4 22.3
Finland 2,120 407.7 4.1
Sweden 2,223 249.8 2.5
United Kingdom 16,576 279.5 2.8
Total 212,010 558.7 100.0
Sources:
http://europa.eu.int/abc/keyfigures/sizeandpopulation/wholives/index_accessible_en.htm, assessed in 11.12.04, and European Commission (2004, Table A4.1).
The EU is the paradigm of how redistribution through vertical transfers is intended to mitigate regional asymmetries. In fact, the low income member states (Portugal, Greece and Spain) get the largest share of EU budget transfers: respectively 22.3%, 23.0% and 14.1% of the total. There is an absolute correlation between lower income member states and countries where structural funds are heavily concentrated. In this respect, the EU budget performs well because it avoids the thorny effects observed in all other mature federations – the imbalance between net recipient regions and poorer states. Yet, the redistributive effects of the EU budget are very modest. They are not as efficient as in other federations.
budget. Luxembourg is by far the higher income member state, but this is not the country that gets less money from structural funds: Denmark ranks first, despite it is the third higher income member state. Ireland stands between those countries, according to the inequality data in table 6. This member state is, however, outside the countries that receive fewer EU budget transfers. Its place is taken by Belgium and the Netherlands (both represent 2.0% of total transfers). Apart this difference, and excluding the exchange of positions between Denmark and Luxembourg, the data show how the correlation between lower transfers and higher income member states is still at work. Again the EU is an excellent example of how inequality patterns and regional redistribution are reciprocally related. Nonetheless, the EU budget lacks resources to perform an efficient redistributive role.
According to figure 1, the EU performs better than Germany and Switzerland in terms of regional inequality. But the imbalances from the distribution of transfers are deeper in the EU than in Switzerland (not to mention Germany). This reflects the weak redistributive capacity of the EU budget when compared with other federations’ vertical transfers. It is furthermore consistent with redistribution dominated by member states.
5. ARE THERE CONDITIONS FOR MORE CENTRALISATION IN THE EU?
After examining the similarities and dissimilarities between the EU and the five federal countries in terms of redistribution, a question comes to the surface: is it feasible that redistribution becomes more centralised in the EU? Put it differently: is it feasible that the EU becomes similar to ‘conventional fiscal federalism’ where centralisation is the
keyword for redistribution? These questions imply a normative analysis. Nevertheless, there are also positive insights from contemporary European integration that matter. In other words, the answers to the questions might differ as long as a normative or a positive analysis is taken. I find four reasons for doubting that centralised redistribution is the likely outcome2. Two are located in the political domain, and the other two emphasise political-economic aspects.
2
5.1. The absence of political conditions
The suggestion that redistribution must be more centralised in the EU (because this one crucial characteristic of federal states) is biased. There are two problems with this reasoning: on the one hand, the assumption that centralisation is the dominant tendency in all federations, ignoring that some federal countries have decentralised redistribution; on the other hand, the outcome of European integration doesn’t resonate with a statehood dimension. This is why European integration is full of distinctiveness. Therefore, supranational redistribution is not feasible. It might become desirable to certain schools of thought, notably those who establish an analogy between federal states and the prospective EU as a ‘super-state in the making’. Those who believe that the supranational budget should be reinforced to perform a stronger role in redistribution also show a preference towards more centralisation in the EU.
The consequences of such predilection are the assignment of an autonomous taxing power to the EU, and the enhancement of supranational budget’s outlays and revenues. Something must be done at the supranational level to offset the depth of the asymmetries that currently characterise the EU. This solution is reasonable to the extent that other relevant aspects beneath European integration were neglected – again the core elements that make the EU a template of distinctiveness, the antithesis of statehood.
Furthermore, different member states’ traditions regarding the means and ends attached to redistribution heighten the difficulties of centralised redistribution in the EU. As does the sharp division between donor and recipient member states, since they could be increased in the event of supranational redistribution aiming at offsetting regional inequalities. The likely result is the fragmentation of EU member states into two different, hostile clubs (Person, Roland and Tabellini 1996).
An alternative method shows how inter-state solidarity is largely absent in the EU. The focus shifts from governments’ behaviour towards citizens’ perceptions of European integration. Polls are instructive of how insensitive citizens generally are when they are faced with the problems that other member states and regions deal with.
Table 14: Feeling attached to a place (1991 and 1995)
Member State Region 1991/1995
Country 1991/1995
The EC 1991/1995
Austria ---/3.7 ---/3.5 /2.3
Belgium 3.2/3.5 3.0/3.2 2.4/2.5
Denmark 3.6/3.4 3.8/3.7 2.3/2.1
Finland ---/3.2 ---/3.6 /2.0
France 3.3/3.4 3.4/3.4 2.6/2.6
Germany 3.6/3.6 3.4/3.3 2.4/2.3
Greece 3.8/3.9 3.8/3.9 2.5/2.4
Ireland 3.6/3.6 3.7/3.7 2.2/2.5
Italy 3.4/3.4 3.4/3.5 2.7/2.7
Netherlands 3.0/3.1 3.2/3.1 2.1/2.1
Portugal 3.7/3.7 3.7/3.7 2.5/2.5
Spain 3.7/3.6 3.5/3.5 2.7/2.4
Sweden ---/3.4 ---/3.6 /1.9
United Kingdom 3.4/3.3 3.5/3.4 2.2/2.1
EC/EU unweighed average 3.5/3.5 3.5/3.4 2.5/2.4
Source: Adapted from Hooghe and Marks (2001: 55), Table 3.1.
Question: People may feel different degrees of attachment to their region, to their country, or to the EC. Please tell how attached do you feel to…? The data were adjusted from a larger survey where different answers were envisaged for measuring how attached people felt to these three hypothesis: ‘very attached’ (code 4), ‘fairly attached (code 3)’, ‘not very attached’ (code 2), and ‘not at all
attached’ (code 1)’.
People are more concerned with their own problems, turning their attention to the regional or the national level of decision-making. Their neighbours’ problems are not a reason of concern. It is not surprising that European integration developments were not accompanied by the development of a common civic identity (Chryssochoou 2003: 380).
centralised. Moreover Eurobarometer surveys show how citizens drive their loyalties to a national (if not sub-national) level, and not to the supranational dimension. Table 15 corroborates the aforementioned reasoning.
Table 15: European versus national identity 1992 to 2002, EC12/EU15
EB 37 (Spring 1992)
EB 44 (Spring 1995)
EB 49 (Spring 1998)
EB 57 (Spring 2002) Only
nationality
38 40 44 38
Nationality and European
48 46 41 48
European and
nationality
7 6 6 7
Only European
4 5 5 4
Sources: Data from Eurobarometer 37, 44, and 49 in McKay (1999: 167). Data for 2002 in European
Commission (2002), Table 4.5.
5.2. The absence of economic conditions
The first economic argument emphasises that asymmetric shocks are less likely with EMU (Artis and Buti 2000: 573). Other scholars have a different perception, claiming that asymmetric shocks are a real prospect for the Euro-zone economy due to the structural differentiation between national economies (Begg 1998, and Fátas 1998). On the opposite side, EMU has the potential to internalise member states’ differentiated business cycles. It creates space for synchronisation between national economies. This effect is expected as a consequence of three interconnected aspects of EMU’s political-economic model:
i) The transition period that preceded monetary union triggered a significant measure of economic convergence among member states (Eijffinger and de Haan 2000: 130);
ii) The expected credibility of the single monetary policy. To this extent, monetary policy is powerful enough to provide a shock absorber against crisis. Consequently, the stabilisation effects of monetary policy eliminate fiscal policy activism (Dyson 2000: 160);
For these reasons, it is expected that EMU promotes homogeneity in member states’ business cycles (Buti and Sapir 1998: 154-63). If asymmetric shocks are ruled out, there are fewer arguments in favour of redistribution implemented at the supranational level. A final justification for rejecting centralised redistribution in the EU borrows from the expected effects of macroeconomic stabilisation. The EU is made of a compound of centralisation (monetary policy) and decentralisation (national fiscal policies), making it a case of distinctiveness when other federations are compared. More importantly yet, the clear distribution of competences is instructive of how EMU is different from centralised redistribution, and thereby deprives European integration from any connotation with ‘conventional fiscal federalism’ (Kletzer 1999, and Maillet 2002). Two correlated reasons explain this causality: the dominance of supranational monetary policy in the overall architecture of economic policy; and the largely decentralised fiscal policy (albeit facing quantitative constraints due to the Stability and Growth Pact). Firstly, EMU’s political economy is based on the monetarist belief that monetary policy is powerful enough to offset the disturbances of the Euro-zone economy. Despite the claims that the ‘one-size-fits-all’ single monetary policy might be problematic when a minority of member states requires a different policy stance, the winning model puts its faith on the prospects of macroeconomic stabilisation given by the ECB monetary policy.
Using the logic embedded in EMU’s orthodoxy, the emphasis is on monetary policy, relegating fiscal policy to a secondary role. All this suggests that in the EU the priority is stabilisation, not redistribution – at least when these two functions are measured from the lens of supranational competences. If there is a centralisation window opened by EMU, that window is not redistribution but instead macroeconomic stabilisation through the operation of monetary policy.
plausibly a room for centralisation, making the EU similar to ‘conventional fiscal federalism’.
This ambition is denied with the acknowledgement that automatic stabilisers operate much better at the national level, considering the specificities that still flourish among member states’ economies. The need of ‘conventional fiscal federalism’ is negatively correlated with the operation of automatic stabilisers at the national level, since
(…) there is no need for a European system of fiscal federalism so long as member states’ automatic stabilizers are allowed to operate. But if these are disabled, there may arise pressure for fiscal federalism, as national governments plump for a union-wide system to provide the stabilization they are prevented from providing themselves (Eichengreen 1998: 30).
Pegging on Eichengreen’s reasoning, the feasibility of ‘conventional fiscal federalism’ in the EU depends from national governments’ inept behaviour when fiscal discipline is
at stake. Only in that case automatic stabilisers are unlikely to be successful at the national level. As long as the Stability and Growth Pact survives and becomes successful, notably by enabling national automatic stabilisers when they are mostly need – when economic downturn hits the ground – centralised redistribution is infeasible. Yet, I am aware that recent events showing the fluid enforceability of the Stability and Growth Pact emerge as an obstacle to this approach.
CONCLUSIONS
The specificities of European integration suggest that, for the time being, it is not feasible that the EU undergoes centralisation, especially in those issues where ‘conventional fiscal federalism’ operates (allocation, equity, and stabilisation). The corollary is a window of opportunity to an alternative dimension of fiscal federalism in European integration – one where decentralisation is the dominant feature. Students of fiscal federalism emphasise how fiscal decentralisation is the best solution for mature federations, for the positive effects stemming from vertical and horizontal governmental competition (Oates 1999, 2001). Assuming this is the desirable pathway for mature federations, here is another powerful argument for the infeasibility of centralised fiscal federalism in the EU.
distinctiveness of European integration isn’t neglected, similarity emerges between some decentralised aspects (taken in isolation) of ‘conventional fiscal federalism’ and the current political-economic orthodoxy of EMU.
The plea is, hence, whether the EU is already a system of fiscal federalism on its own.
One form of fiscal federalism dominated by decentralisation, considering the restrictions of the EU budget. But yet fiscal federalism, if we accept fiscal federalism is a system of constitutional distribution of powers between different tiers of government in what concerns the organisation of the traditional fiscal functions (Spahn 1993, and Oates 1999). European integration is also about different budget layers, different competences for fiscal functions, and an accentuated decentralisation outcome (Sapir at al. 2003: 11).
Fiscal federalism is one of the characteristics embodied in European integration. This is a timid, even a neglected characteristic, as a consequence of the juxtaposition of different understandings: those who reveal a misconception about fiscal federalism – they associate fiscal federalism to centralisation – propose ‘conventional fiscal federalism’ as a necessary implication of EMU; and those who raise obstacles to this prospect for their scepticism towards far-reaching developments in European integration, especially against enhanced centralisation. Although a timid dimension encapsulates the EU fiscal federalism, it exists indeed. A fiscal federalism of its own, matching the structural attributes that make European integration full of distinctiveness.
REFERENCES
ALESINA, Alberto, Ignazio Angeloni and Ludger Schuknecht (2001), What Does the
European Union Do?, NBER Working Paper 6847.
ARMSTRONG, Harvey W., Jim Taylor and Allan Williams (1997), “Regional Policy”, in ARTIS, Michael J. and Norman Lee (Eds.), The Economics of the European Union – Policy and Analysis, 2ed. Oxford: Oxford University Press.
ARTIS, Michael and Marco Buti (2000), “‘Close-to-Balance or in Surplus’: A Policy-Maker’s Guide to the Implementation of the Stability and Growth Pact”, Journal of Common Market Studies, 38: 4 (November), pp. 563-91.
BUTI, Marco and André Sapir (1998), Economic Policy in EMU – a Study by the European Commission Services, Oxford: Oxford University Press.
CHRYSSOCHOOU, Dimitris N. (2003), “EU democracy and democratic deficit”, in CINI, Michelle (Ed.), European Union Politics, Oxford: Oxford University Press. COLLIGNON, Stefan (2003), The European Republic – Reflections on the Political Economy of a Future Constitution, London: Federal Trust.
DAFFLON, Bernard (2004), Federal-Cantonal Equalisation in Switzerland: An Overview of the Present System and Reform in Progress, BENEFRI Centre d’Études en Économie du Secteur Publique, Working Paper nº. 356, University of Fribourg.
DYSON, Kenneth (2000), The Politics of the Euro-Zone – Stability or Breakdown?, Oxford: Oxford University Press.
EICHENGREEN, Barry (1998), “European Monetary Unification: a Tour d’Horizon”,
Oxford Review of Economic Policy, 14: 3, pp. 24-40.
EIJFFINGER, Sylvester C.W. and Jakob de Haan (2000), European Monetary and Fiscal Policy, Oxford: Oxford University Press.
EUROPEAN COMMISSION (2002), Eurobarometer 57 (Spring 2002), Luxembourg: Office for Official Publications of the European Communities.
--- (2004), A New Partnership for Cohesion – convergence, competitiveness, cooperation (Third Report on Economic and Social Cohesion), Luxembourg: Office for Official Publications of the European Communities.
FÁTAS, Antonio (1998), “Redistributive versus insurance: Does EMU need a fiscal federation?”, Economic Policy, 26 (April), pp. 165-203.
GRAMLICH, Edward M. and Paul R. Wood (2000), Fiscal Federalism and European Integration: Implications for Fiscal and Monetary Policies, Board of Governors of the Federal Reserve System, International Finance Discussion Paper Nº. 694.
HOOGHE, Liesbeth and Gary Marks (2001), Multi-Level Governance and European Integration, Lanham: Rowman and Littlefield.
ITALIANER, Alexander and Jean Pisani-Ferry (1991), Regional Stabilisation Properties of Fiscal Arrangements: what lessons for the Community, mimeo, Commission of the European Communities, Office for Official Publications of the European Communities: Luxembourg.
JONES, Erik (2000), “European Monetary Union and the New Political Economy of Adjustment”, in GREEN COWLES, Maria and Michael Smith (Eds.), The State of the European Union: Risks, Reform, Resistance, and Revival, Oxford: Oxford University Press.
--- (2002), “Macroeconomic Preferences and Europe’s Democratic Deficit”, in VERDUN, Amy (Ed.), The Euro: European Integration Theory and Economic and Monetary Union, Lanham: Rowman & Littlefield.
KLETZER, Kenneth (1999), “Macroeconomic Stabilization with a Common Currency: Does European Monetary Unification Create a Need for Fiscal Insurance or Federalism?”, in EICHENGREEN, Barry and Jeffry Frieden (Eds.), Forging and Integrated Europe, Ann Arbor: The University of Michigan Press.
LAFFAN, Brigid (1997), The Finances of the European Union, Basingstoke: Macmillan.
LEVITT, Malcolm and Christopher Lord (2000), The Political Economy of Monetary Union, Basingstoke: Macmillan.
MAILLET, Pierre (2002), “L’Euro, Achèvement et Point de Départ”, in PITTA E CUNHA, Paulo and Manuel Porto (Eds.), The Euro and the World, Coimbra: Almedina. MAJOCCHI, Alberto (1999), “Stabilisation policy in the European Monetary Union and fiscal federalism”, in FOSSATI, Amedeo and Giorgio Panella (Eds.), Fiscal Federalism in the European Union, London: Routledge, 1999.
McKAY, David (1999), Federalism and European Union – A Political Economy Perspective, Oxford: Oxford University Press.
OATES, Wallace E. (1999), “An Essay on Fiscal Federalism”, Journal of Economic Literature, XXXVII (September), pp. 1120-49.
--- (2001), “Fiscal competition and European Union: contrasting perspectives”,
PENKETH, Keith (1999), “The budget of the European Union”, in McDONALD, Frank and Stephen Dearden (Eds.), European Economic Integration, Harlow: Longman. PERSON, Torsten, Gérard Roland and Guido Tabellini (1996), The Theory of Fiscal Federalism: What Does It Mean for Europe?, Paper presented at the Conference “Quo Vadis Europe”, Kiel.
SAPIR, André et al. (2003), An Agenda for a Growing Europe – Making the EU Economic System Deliver, Report of an Independent High-Level Study Group established on the initiative of the President of the European Commission, Brussels. SIEBERT, Horst (2004), Germany’s Fiscal Policy Stance, Kiel Working Paper Nº. 1196 (January).
SPAHN, Paul B. (1993), The Community Budget for a Economic and Monetary Union, Basingstoke: Macmillan.
UNITED STATES CENSUS BUREAU (2001), Statistical Abstract of the United States, Washington DC: US Government Printing Office.
--- (2003), Consolidated Federal Funds – Report for Fiscal Year 2002 (State and County Areas), Washington DC: US Government Printing Office.
WINCOTT, Daniel (2002), “National States, European Union and Changing Dynamics in the Quest for Legitimacy”, in ARNULL, Anthony and Daniel Wincott (Eds.),
Accountability and Legitimacy in the European Union, Oxford: Oxford University Press.
WURZEL, Eckhard (2003), Consolidating Germany’s Finances: Issues in Public Sector
Spending Reform, OECD Economics Working Paper (2003) 20.
Internet references
http://epp.eurostat.cec.eu.int/cache/ITY_OFFPUB/KS-CD-04-001-3/EN/KS-CD-04-001-3-EN.PDF~
http://europa.eu.int/abc/keyfigures/sizeandpopulation/wholives/index_accessible_en.htm
http://europa.eu.int/comm/budget/pdf/budget/syntchif2004/en.pdf
http://www12.statcan.ca/english/census01/products/standard/popdwell/Table-PR.cfm
http://www.abs.gov.au/ausstats/abs@census.nsf/Census_BCP_ASGC_ViewTemplate?ReadForm&Expan
d=1
http://www.bfs.admin.ch/bfs/portal/fr/index/infothek/lexikon/bienvenue___login/blank/zugang_lexikon.t
http://www.budget.gov.au/2004-05/bp3/html/bp3_main-01.htm
http://www.ccsd.ca/factsheets/fsavin96.htm
http://www.destatis.de/basis/e/fist/fist023.htm
http://www.destatis.de/basis/e/fist/fist03.htm
http://www.fin.gc.ca/budget04/bp/bpc3e.htm#financial
http://www.fin.gc.ca/FEDPROV/mtpe.html
http://www.statistik.admin.ch/stat_ch/ber04/eufr04.htm
http://www.statistik-bw.de/Arbeitskreis_VGR/tab12.asp
http://www.statistik-portal.de/Statistik-Portal/en/en_jb01_jahrtab1.asp