doi: 10.1590/0101-7438.2017.037.02.0209
AN OPTIMIZATION MODEL TO MINIMIZE THE EXPECTED END-TO-END TRANSMISSION TIME IN WIRELESS MESH NETWORKS
Marlon da Silva
1*, Edson L.F. Senne
2and Nandamudi L. Vijaykumar
3Received August 01, 2016 / Accepted June 17, 2017
ABSTRACT.Time metrics are extremely important to evaluate the transmission performance on Wireless Mesh Networks (WMNs), whose main characteristic is to use multihop technology to extend the network coverage area. One of such metrics is WCETT (Weighted Cumulative Expected Transmission Time), in which transmission times per hop are weighted for both proactive and reactive conditions. Furthermore, such metrics are able to detect delays that can degrade some network services. This paper presents an optimization model to minimize WCETT in a WMN, subject to constraints grouped by bandwidth, flow control and power control. As the model includes nonlinear constraints, we propose a heuristic to solve it, which divides the problem in two subproblems. The first subproblem maximizes the network link capacity and a Simulated Annealing algorithm is used to solve it. Considering the link capacities obtained, the second subproblem minimizes the WCETTs, which is formulated as a linear programming model. Some numerical results are presented, based on instances of WMNs randomly generated. Some of these results are compared with the results obtained by a commercial simulator in order to verify the coherence of the proposed heuristic for realistic scenarios.
Keywords: Wireless Mesh Networks, Mathematical Programming, WCETT, Cross-layer Optimization.
1 INTRODUCTION
Wireless networks are bringing fundamental changes in the access of network services, mainly due to the expressive use of portable devices, such as laptops, tablets, mobile phones etc. At the same time, multimedia (audio and video) services are commonly required by several network applications. These multimedia services, when accessed mainly by means of wireless commu-nication, demand a good configuration of the network, such as a large coverage area and a very short transmission time.
*Corresponding author.
1CEMADEN – Centro Nacional de Monitoramento e Alertas de Desastres Naturais, Estr. Dr. Altino Bondesan, 500, Eugˆenio de Melo, 12247-016 S˜ao Jos´e dos Campos, SP, Brasil. E-mail: [email protected]
2UNESP – Universidade Estadual Paulista, Av. Ariberto Pereira da Cunha, 333, Portal das Colinas, 12516-410 Guaratinguet´a, SP, Brasil. E-mail: [email protected]
Wireless Mesh Network (WMN) is an effective and cheap technology [1, 11]. WMNs are being installed in residences, buildings, companies and vehicles due to their strength, self configuration and easy maintenance. WMNs are especially important where the installation of cables and fixed infrastructure is difficult.
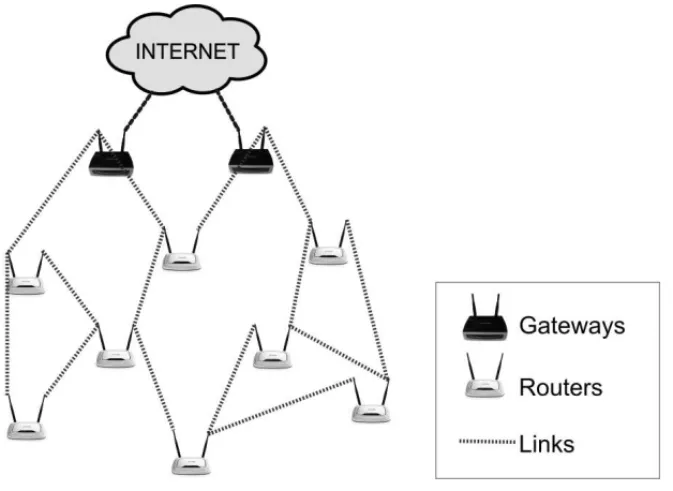
The main characteristic of WMNs is the multihop technology, capable to relay data packets from some source to a particular destination in a hop-by-hop manner over the network devices. In a WMN, these network devices, known as Access Points (APs), are classified into two groups: gateways and routers. Gateways are the network devices connected directly to an external source (e.g., a wired network or a end-user equipment) and routers are APs which communicate with other APs in order to ensure the network’s connectivity. So, in a WMN, the data routing involves not only the source and destination APs, but rather some relay APs as well, allowing data to be forwarded even if the path between source and destination is not permanently connected during communication.
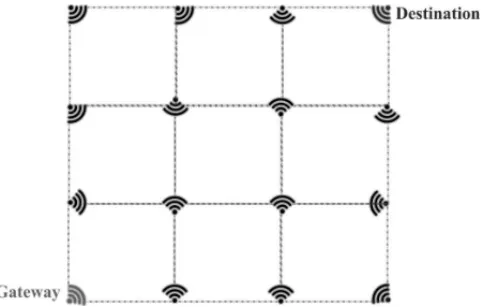
Figure 1 shows an example of WMN and its respective links referring to the wireless connections between APs.
Figure 1–An example of WMN, where black devices are gateways and white devices are routers.
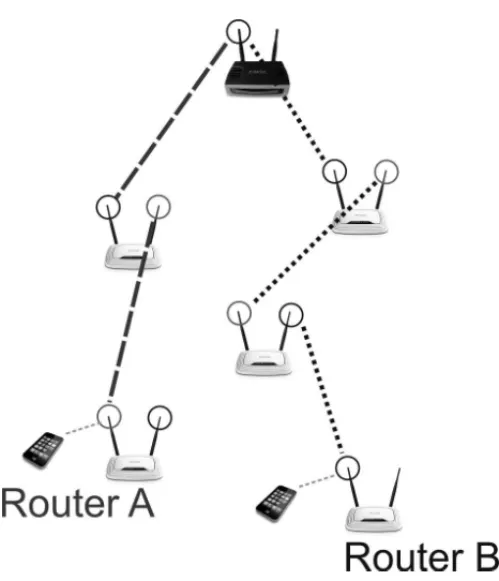
The concept of sessions is an important issue in WMNs. A session is a set of links that compose a transmission path, from a gateway to a destination router. Figure 2 shows two sessions: the dashed links compose the path from gateway to the destination router A, and the dotted links compose the path from the gateway to the destination router B.
Figure 2–Example of two sessions in a WMN.
models, such as SINR (Signal-to-Interference-plus-Noise Ratio) that enable estimating the re-lation between signal, noise and interference. This estimate provided by SINR model becomes important to determine the transmission capacity of each link in function of the consumed power not only by the link itself but also by its neighbor links [9, 20].
Due to its flexibility, a WMN requires a more careful planning in order to avoid inefficiencies that compromise the network performance and, consequently, discourage clients to use the network services. In general, the planning of a WMN involves building optimization models that take into consideration several aspects, such as flow control, power control, transmission rates, APs connectivity, signal interferences, etc. These aspects are related to different layers of the network architecture [22].
WCETT (Weighted Cumulative Expected Transmission Time) is a metric that has been proposed as an improvement on ETT, which is especially important to evaluate WMNs performance [6]. WCETT is a routing metric that takes into account both link throughput and channel diversity. WCETT attempts to route packets using a path with the least number of nodes transmitting on the same channel in order to reduce intra-flow interference [10]. The calculation of WCETT involves various network components, such as link capacity, power level of each link and flow control. It is still an open problem of how to calculate WCETT in an efficient way with respect to costs [12].
This paper proposes an optimization model to minimize the sum of all WCETTs of a WMN, subject to constraints grouped by bandwidth, flow control and power control. This model enables obtain important values for planning a WMN, such as power level and capacity of each link and data flow, but includes nonlinear constraints. A heuristic is proposed to solve it, which divides the problem into two subproblems:
1. The first subproblem maximizes the network link capacity subject to power control and bandwidth constraints, and a Simulated Annealing algorithm is used to solve it;
2. Considering the link capacities obtained, the second subproblem minimizes WCETTs for-mulated as a linear programming model.
This paper is an improvement of the initial studies proposed in [16], in which link capacities were not considered. The main contribution of this paper is to include in the optimization model: (a) an estimate of the relation between signal and interference plus noise, and (b) routing metrics based on transmission time.
The paper is organized as follows. The main related papers available in the literature on the themes addressed in this work are reviewed in Section 2. Section 3 presents the mathematical model proposed to minimize WCETT. The proposed algorithm to solve the problem is presented in Section 4. Numerical results are presented in Section 5 and Section 6 presents some conclu-sions and possible future directions.
2 RELATED PAPERS
An example of a cross-layer model can be seen in [19], in which the authors simultaneously considered channel allocation, routing, scheduling and power control problems, in order to max-imize the network throughput. In this paper, the solutions were obtained by a heuristic applied firstly to the channel assignment problem and then to the others.
The presence of noise and interference is an important factor in estimating the power levels that each access point must emit and thus, the use of physical models to deal with noise and interfer-ence becomes essential for the network planning. Some efforts using the physical model SINR have been studied in [17] to verify the link capacities in a WMN under different environmental conditions, in order to improve the quality of service offered by the network.
In [22], a WMN is modeled as a graph, in which each link has two different weights: data flow and power level. The authors propose a model for throughput maximization and show that the problem can be decomposed into two subproblems: a data routing subproblem (at the network layer) and a power control subproblem (at the physical layer). The physical model SINR is con-sidered. Several effective solutions are discussed for each subproblem.
A cross-layer optimization for WMN is also considered in [21] taking into account APs with multiple antennas in order to maximize throughput and minimize the system activation time. Smart antenna techniques are used to provide interference suppression, capability for simulta-neous communication with several nodes and transmission with higher data rates. Three MILP models are presented and the optimal solution is approached by a decomposition method.
In [15] is considered the impact of advanced physical layer techniques on the maximum achiev-able throughput of WMNs. A cross-layer optimization model goal is formulated for the routing and scheduling problem jointly to verify the impact of signal degradation on throughput. The model is solved by a Column Generation method and the solution found is used to establish the min-max levels to guarantee an acceptable throughput. However, link capacities are not consid-ered and the proposed model considers that all APs have the same power level.
Cross-layer model is also considered in [2] for MIMO-based WMNs.Multiple-In-Multiple-Out) (MIMO) technology can bring substantial throughput improvement in WMNs by combining in-terference suppression and spatial multiplexing. The model involves end-to-end rate allocation, routing, and stream control scheduling in order to find the maximum throughput, max-min fair-ness and proportional fair rate allocation solutions. By using a greedy heuristic algorithm, the model has shown effective for WiMAX networks.
3 THE PROPOSED MODEL
To estimate the transmission time in WMNs, routing metrics, such as ETX and ETT, are de-termined. These metrics must be measured during network running time [7]. ETX [10] repre-sents the number of times that an AP waits to send or resend a data packet to a receiver device without compromising the packet. ETT is the average time a data packet travels on a link [4], which depends on the packet size (λ) and link capacity (κ). Hence, ETT can be calculated as: E T T =E T X×λκ.
The total sum of ETTs is an estimate of the end-to-end delay experienced by a packet traveling along a path. However, ETT only does not consider any bottleneck on channel traffic. On the other hand, WCETT measures the cumulative time of the wireless hops to convey information from a source to a destination, considering possible bottlenecks on channels during the transmis-sion [6]. So, WCETT can be considered as a good quality of service (QoS) parameter for WMNs, since the calculation of WCETT involves the evaluation of the entire path of all data packets [5].
In order to calculate WCETT along a path, it is not enough simply adding up ETTs along that path because this will not consider the impact of channel diversity, that is, will not distinguish between hops that are on different channels. One must remember that if two hops on a path are on the same channel then they always interfere with one another. Consider ann-hop path. Assume that the network has a total of C channels. Let H be the set of hops that compose this path. DefineXj as:
Xj = n
i∈Husingj
E T Ti 1≤ j ≤C (1)
Thus,Xj is the sum of transmission times of hops on channel j. The total path throughput will
be dominated by the bottleneck channel, which has the largestXj.
So, in order to establish a tradeoff between delay and throughput, WCETT on a path can be calculated by:
W C E T T =(1−β)
i∈H
E T Ti+β max
1≤j≤CXj (2)
whereβ (0≤β ≤1)is a tuning parameter, which corresponds to the percentage of the path that has to be dynamically built. Note that in (2), the first term can be considered as a measure of the latency of this path and the second term can be viewed as a measure of path throughput, since it represents the impact of bottleneck hops.
The main difference between the proposed model in this paper with the other models found in the literature is that the proposed model uses WCETT as a routing metric. This specific metric enables the evaluation of end-to-end paths considering possible bottlenecks on the channels, besides dealing with some effects of noise and interference in wireless transmission.
Table 1 shows the list of sets and subsets that will be used in the proposed model.
Table 1–List of sets used in this model.
Notation Description N Set of nodes (APs)
Ns Set of nodes which are sender APs Nr Set of nodes which are receiver APs
S Set of sessions, whereS={1, . . . ,S} L Set of links
Lk Subset of links for sessionk∈S
Lsn Subset of links, wheren∈Nis a sender AP
Lskn Subset of links, wheren∈Nis the sender AP of sessionk∈S Lrkn Subset of links, wheren∈Nis the receiver AP of sessionk∈S
Let(N,L)be a graph which denotes a WMN, givenN, the set of APs, andL⊂N×N, the set of links. A sessionk∈Sis denoted by a triple(nsk,nrk, λk), wherenskis the sender AP (usually,
a gateway), nrk is a receiver AP andλk is the packet size of the session k. Figure 3 shows a
graph representation of a WMN, where the vertices represent APs (gateways, relay routers or destination routers) and the edges represent the links.
Figure 3–A graph representation of a WMN.
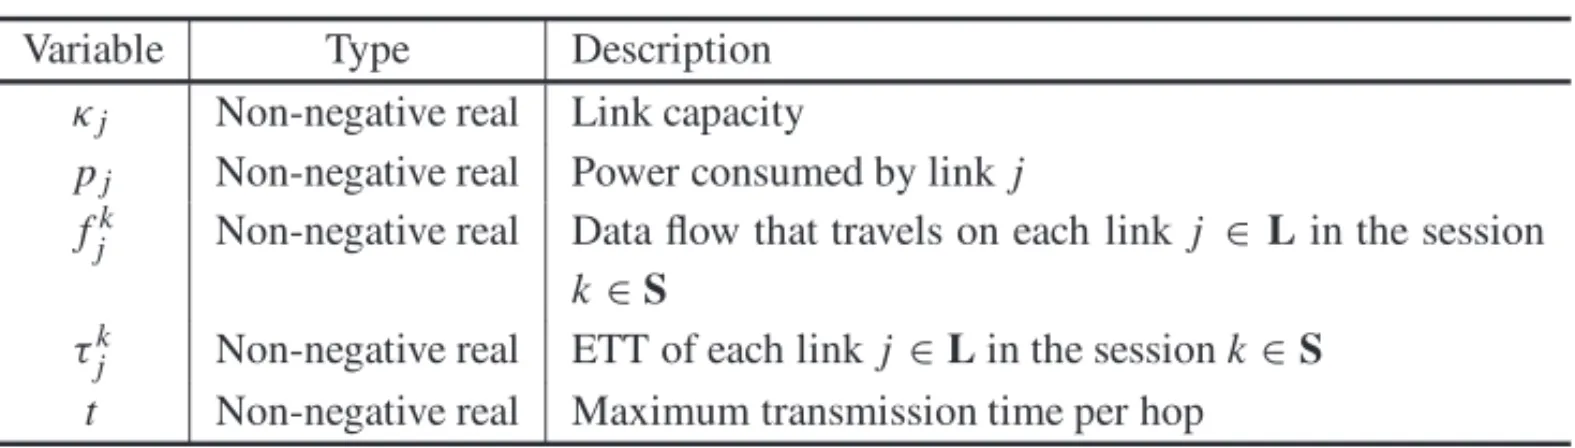
Table 2 shows the variables and Table 3 lists the parameters used in the proposed model.
Table 2–Variables used in the model.
Variable Type Description
κj Non-negative real Link capacity
pj Non-negative real Power consumed by link j
fjk Non-negative real Data flow that travels on each link j ∈ Lin the session k∈S
τkj Non-negative real ETT of each link j∈Lin the sessionk∈S t Non-negative real Maximum transmission time per hop
Table 3–Parameters used in the model.
Parameter Description
β Tunable parameter to evaluate WCETT [6]
Gmn Array element of interference coefficient between APsmandn
σ Noise coefficient
Pn Maximum power of a APn∈N
χkj ETX, given by a probabilistic parameter
W Bandwidth of each frequency band
proactive routing features, emphasizing paths previously determined. Otherwise, the network will prioritize reactive features, emphasizing the path construction on demand [5, 6]. The values for interference coefficientsGmnare calculated in function of the distance between APsmandn
(dmn) and path loss exponent (η) [19], i.e.:
Gmn =dmn−η (3)
The proposed model is presented as follows:
min
S
k=1 ⎡
⎣(1−β)
j∈Lk τkj +βt
⎤
⎦ (4)
Subject to:
t≥
j∈L
S
k=1
τkj (5)
p∈Lskn
fpk−
q∈Lrkn
fqk=0 ∀k∈S;n∈N−
nsk,nrk
(6)
p∈Lskn
fpk−
q∈Lrkn
p∈Ls k N
fpk−
q∈Lr k N
fqk= −λk ∀k∈S;n∈Nr (8)
j∈Ls n
pj ≤ Pn ∀n∈N (9)
S
k=1
fjk ≤κj ∀j ∈L (10)
κj =Wlog2 1+
Gmnpj
σ+
(u,v)=θ∈L;θ=j Gunpθ
∀[j =(m,n)] ∈L (11)
τkj =
χkjλk
κj
j ∈L;k∈S (12)
τkj ≥0, fjk ≥0 ∀j ∈L;k∈S (13)
pj ≥0, κj ≥0 ∀j ∈L (14)
The objective function (4) refers to minimizing the sum of all WCETTs in the WMN.
Constraint (5) represents the reactive features of the routing protocol. This constraint ensures the largest value for the sum of ETTs, in order to avoid bottleneck in the paths [6].
Constraints (6–8) guarantee the flow balance in the WMN: constraint (6) ensures that the received data in an relay router is equal to respective transmitted data. Constraints (7) and (8) indicate, respectively, the data flow for sender and receiver APs.
Constraint (9) ensures a power limit that an APn ∈ Ncan emit to their neighbor devices, i.e., the sum of power level of all links wherenis the sender cannot be greater than the maximum AP powerPn.
Bandwidth constraints improve data flow in WMNs, considering the transmission capacity of each link [21]. Constraint (10) ensures that the total data flow on a link cannot be greater than the link capacity. Constraint (11) determines the link capacity using Shannon equation in function of a transmission model that considers the signal from the sender AP, the interference of other APs and the environment noise. In this case, the model adopted isSignal-to-Interference-plus-Noise Ratio(SINR).
Constraint (12) ensures the value for each ETT in function of the respective ETXχj, the data
size packetλkand the link capacityκj.
Constraints (13) and (14) limit the values assigned to the decision variables.
4 HEURISTIC TO OBTAIN WCETT
To obtain a solution for the proposed model in an acceptable computational time, we propose a hybrid heuristic which decomposes the problem into two subproblems:
1. Maximization of link capacities. This subproblem consists of finding the power levels and link capacities, in order to maximize the total capacity of the links;
2. Minimization of WCETTs. This subproblem corresponds to the Linear Programming model which arises when constraints (9) and (11) are removed from the proposed model, given the values for link capacities obtained in the previous subproblem.
4.1 Maximization of link capacities
The first step of proposed heuristic consists in finding power levels for each link, in order to maximize the total link capacity. A similar strategy is also applied in [22]. One may observe that the link capacity must be obtained in function of the power of the link itself and the power of neighbor links that can cause interference. This estimation is used to avoid any large discrepancy in power link values and, consequently, in link capacities. Hence, the maximization of link ca-pacities is formulated considering power control and link capacity constraints as a function of SINR. Thus, this subproblem is formulated as follows:
max
L
j=1
κj (15)
Subject to:
Constraints (9), (11), (14).
In this subproblem, the main idea is to maximize the link capacity of WMN according to SINR measured in the physical layer of the network. To solve this subproblem, we employ the Simu-lated Annealing metaheuristic shown in Algorithm 1.
Some parameters are used in Simulated Annealing algorithm. In particular, letp0be the initial set of power levels used to estimate all link capacities of the WMN. Furthermore, letT0be the initial parameter that controls the perturbation of the current solution (known as temperature) and ǫthe minimum temperature. For each temperatureT, a solution is chosen and this solution may be better than the current best solution, denoted bypbest. If the best solution is not improved, the
chosen solution may still be accepted, according to values ofT as well as the difference between values of the objective function assigned to neighbor solutions, denoted byf. The value ofT is updated and this procedure is repeated untilT becomes less thanǫdue to cooling rateαwhose range is 0< α <1.
Note that, to choose a neighbor solution, the Simulated Annealing algorithm invokes the function Find N eighbor(p), described in Algorithm 2.
Once the best values for each link capacityκj (j ∈L) are obtained, they will be used as
Algorithm 1: Simulated Annealing algorithm to maximize the sum of all link transmission capacities.
Input:(p0,T0, α, ǫ) p←p0;
pbest ←p;
T ←T0;
while(T > ǫ)do
p′←Find N eighbor(p); f ← f(p′)− f(p); iff >0then
p←p′;
if f(p) > f(pbest)then pbest ←p;
else
rnd ←a random value∈ [0,1]; ifrnd<eTf then
p←p′; end
T ←α×T; end
Calculate values ofκfrompbest, employing Equation (11); Output:κ
Algorithm 2: FunctionFind Neighbor().
Letp= {p1,p2, . . . ,pL}be a solution for the subproblem;
p′←p;
Choose randomly a linkℓ∈ {1,2, . . . ,L}; Choose randomly∈(0,1);
Choose randomly an operation⊕(increasing or decreasing); p′ℓ← pℓ′⊕;
Makep′ℓfeasible, if needed; Output:p′
4.2 Minimization of WCETTs
Once link capacities and link power levels have been obtained, the second step of the proposed heuristic is to determine the values of flow control and ETT. Thus, the subproblem to minimize WCETTs is formulated as follows:
min
S
k=1 ⎡
⎣(1−β)
j∈Lk
τkj +βt ⎤
Subject to:
Constraints (5-8), (10), (12) and (13).
This subproblem can be solved by a commercial solver. Its solution represents the data flow and the ETTs of each link that minimize the total transmission time of the WMN.
5 NUMERICAL RESULTS
The proposed heuristic was tested on instances representing WMNs in a grid topology over an outdoor environment where neighbor APs are distant 50 meters from each other. The algorithm was written in C++ using libraries of the IBM CPLEX 12.5 solver [8] and run on a microcom-puter with quad-core 2.5 GHz CPU and 4 GB RAM.
5.1 Tests using a default instance
In this section, we consider a 3×3 grid topology and the following default parameters:
1. (Number of APs) N=9, where 1 is the gateway, 7 are relay routers and 1 is the destination AP;
2. (Number of sessions) S=6;
3. (ETX)χkj =1.05;
4. (Tuning coefficient)β =0.7;
5. (Demand rate)λk =4 Mb/s per session;
6. (Maximum power used by router) Pn=100 mW;
7. (Noise coefficient)σ = −80 dBm=10−8W;
8. (Bandwidth frequency) W=20 MHz per channel;
9. (Path loss exponent)η=3.
For the Simulated Annealing algorithm, after a parameter tuning process where were consid-ered: initial temperature in[100,100000], cooling rate in[0.5,0.95]and minimum acceptable temperature in[0.1,0.001], the following values were chosen:
1. (Initial temperature) T0=10000;
2. (Cooling rate)α=0.9;
Table 4–Results obtained for default instance – Subproblem 1.
Description Value
Average solution (Mb/s) 832.00 Best solution (Mb/s) 866.29 Average deviation (%) 1.54 Computational Time (s) 21.65
For the tests, the Simulated Annealing algorithm was executed 100 times. Table 4 shows the obtained values. In this table, the average deviation corresponds to the ratio between the average of standard deviations and the average solution.
Table 5 shows the results obtained by CPLEX solver, considering the link capacities obtained previously.
Table 5–Results obtained for default instance – Subproblem 2.
Description Value
Total WCETT (s) 0.146
Average WCETT per session (s) 0.024
Average ETT (ms) 1.787
Figure 4 illustrates the averages of each link capacity and ETT per hop in the grid. Note that the Simulated Annealing algorithm obtained average link capacities greater for links that are closer to the gateway in relation to the other links. This result matches with the physical model of the network, because interference is greater when there is a significant number of devices around the link signal. Hence, the lowest values for ETTs correspond to the links that contain the highest link capacities.
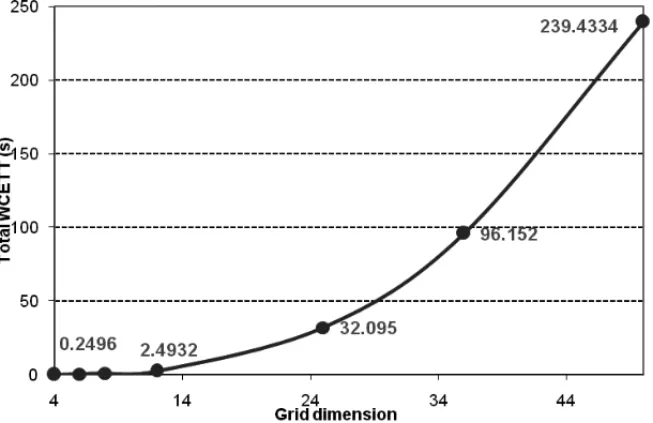
5.2 Tests using other instances
Tests with other instances were conducted to verify the behavior of the proposed heuristic when the grid size increases. These instances differ from the default instance in the grid size and, consequently, in the number of APs. The position of the gateway and the destination AP will be the same in all instances: the gateway is located at the bottom-left corner and the destination AP is at the top-right corner of the grid. Figure 5 illustrates 4×4 network sample and its respective gateway and destination AP positions.
Figure 5–Gateway and AP destination positions in the WMN grid 4×4.
The number of sessions is not important in this case and was defined, arbitrarily, asS =4 for all these instances. Table 6 shows the results obtained for these network samples in terms of total WCETT, average ETT and processing time.
Table 6–Results obtained varying grid size.
Grid size Links per session Total WCETT (s) Average ETT (ms) CPU time (s)
4×4 6 0.249 2.24 <1
6×6 10 0.518 2.82 <1
8×8 14 0.999 3.20 <1
12×12 22 2.493 3.72 <1
25×25 48 32.095 6.43 2
36×36 70 96.152 9.28 10
50×50 98 239.433 11.97 36
Figure 6 illustrates the evolution of total WCETT, while Figure 7 shows the evolution of average ETT.
Figure 6–Total WCETT in function of grid size.
Figure 7–Average ETT in function of grid size.
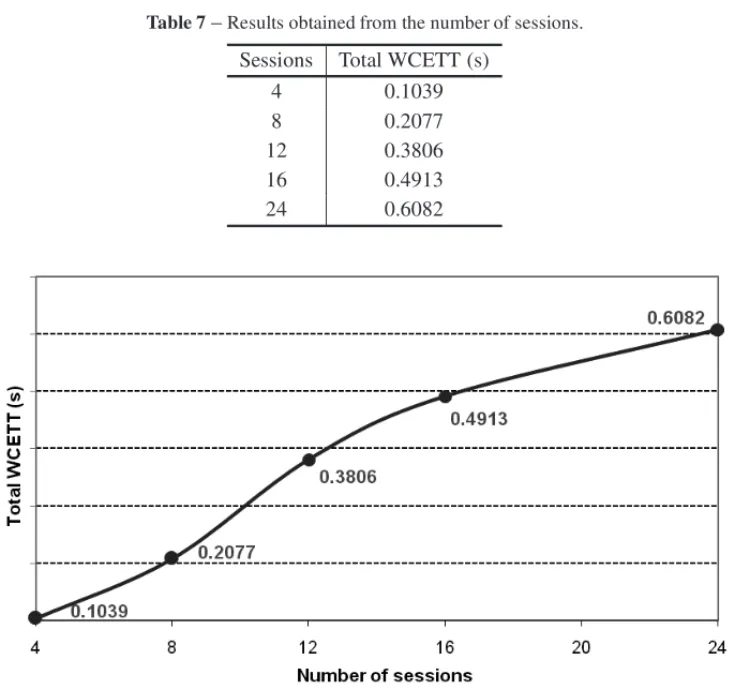
5.3 Tests modifying the number of sessions
Some tests were conducted on the default instance, modifying only the number of sessions. The objective of these tests is to evaluate the network behavior when data traffic increases. Sessions were created randomly and the sender AP is always the gateway. Table 7 shows the results ob-tained for Total WCETT and Figure 8 presents its behavior in function of the number of sessions.
Table 7–Results obtained from the number of sessions.
Sessions Total WCETT (s)
4 0.1039
8 0.2077
12 0.3806
16 0.4913
24 0.6082
Figure 8–Total WCETT in function of the number of sessions.
From these results, it is possible to notice that the number of sessions does not impact signifi-cantly on average ETT and the increase in the values of total WCETT is smooth.
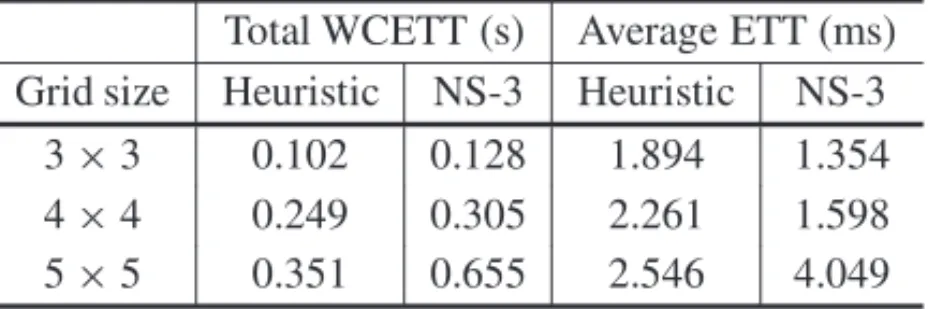
5.4 Comparison withNetwork Simulator3
It is important to highlight that the heuristic proposed in this paper determines ETT on each link and, then, computes the WCETT. NS-3 simulator is not able to calculate ETTs on an individ-ual basis and, moreover, NS-3 does not have the protocol MR-LQSR, a key protocol used to determine WCETT. Therefore, the results returned by NS-3 are obtained from non-optimized protocols.
The simulation was executed 50 times. The total data transmission time is 900 s and the interval between two consecutive packets is 10 ms. Table 8 shows the values for average ETT and total WCETT obtained by the proposed heuristic as well as by the simulator.
Table 8–Results obtained from heuristic and compared with simulation.
Total WCETT (s) Average ETT (ms) Grid size Heuristic NS-3 Heuristic NS-3
3×3 0.102 0.128 1.894 1.354
4×4 0.249 0.305 2.261 1.598
5×5 0.351 0.655 2.546 4.049
Table 8 shows that the proposed heuristic obtained lower values for total WCETT when compared to the values obtained by NS-3. These results show that the heuristic is capable to recommend a better network configuration in terms of transmission times. However, the heuristic does not con-sider details of configuration which are concon-sidered by the simulator, such as type of technology used in each layer, protocols, etc. Furthermore, the simulation dynamically calculates the packet loss, while the heuristic considers ETX as a parameter to obtain other metrics.
It is important to observe that the simulator NS-3 was not able to obtain results for grid sizes greater than 5×5.
6 CONCLUSIONS
This paper presented an optimization model applied to WMNs in order to minimize the time rout-ing metric WCETT, considerrout-ing some important problems found in networks, such as bandwidth usage, flow control and power control. In WMNs these problems are essential to be sorted out in order to ensure the connectivity between APs which is necessary for the multihop technology.
The proposed model contributes to obtain a good configuration for WMNs, which can be crucial if applications that do not accept large delays (such as multimedia applications) are extensively used in the network. The work also proposes a heuristic to solve the model. Computational tests show that the proposed heuristic is efficient and obtains satisfactory results, when checked by a network simulator.
There are some possibilities to be explored as future work, such as the inclusion of other problems in the optimization model, for example, channel assignment. Furthermore, other metaheuristics such as Variable Neighborhood Search and Iterated Local Search could be used to solve the link capacity problem. An interesting research issue could be to come up with a heuristic to solve the entire problem without the need to decompose it into subproblems.
ACKNOWLEDGEMENTS
The authors acknowledge Brazilian agencies National Council for Research and Scientific De-velopment (CNPq) and the Coordination for the Improvement of Higher Education Personnel (CAPES) within Academic Cooperation Project (PROCAD – Grant 776/2010). The authors are also grateful to the anonymous reviewers for their valuable comments and useful suggestions that have significantly improved this paper. The first author acknowledges Ph.D. Diego Herb´ın Stalder D´ıaz for his kind support in this work.
REFERENCES
[1] AKYILDIZIF, WANGX & WANGW. 2005. Wireless mesh networks: a survey.Computer Networks ISDN Systems,47(4): 445–487, mar.
[2] BANSAL M & TRIVEDI A. 2014. Cross-layer optimization for fair end-to-end rate allocation in WMNs with MIMO links.Transactions on Emerging Telecommunications Technologies,25(5): 496– 506.
[3] BLANKAG. 2004.TCP/IP Foundations. Sybex.
[4] BORGESVCM, CURADOM & MONTEIROE. 2010. A cross-layer routing scheme for scalable triple play service in wireless mesh networks. InComputer Communications and Networks (ICCCN), 2010 Proceedings of 19th International Conference on, pages 1–6, aug.
[5] CAMPISTAM, ESPOSITOP, MORAESI, COSTAL, DUARTEO, PASSOSD, ALBUQUERQUEC, SAADE D & RUBINSTEINM. 2008. Routing metrics and protocols for wireless mesh networks.
Network, IEEE,22(1): 6–12, jan.-feb.
[6] DRAVESR, PADHYEJ & ZILLB. 2004. Routing in multi-radio, multi-hop wireless mesh networks. InProceedings of the 10th annual international conference on Mobile computing and networking, MobiCom ’04, pages 114–128, New York, NY, USA, ACM.
[7] ESPOSITOP, CAMPISTAM, MORAESI, COSTA L, DUARTEO & RUBINSTEINM. 2008. Imple-menting the expected transmission time metric for OLSR wireless mesh networks. InWireless Days, 2008. WD ’08. 1st IFIP, pages 1–5, nov.
[8] IBM ILOG CPLEX. 2010.V12.5: User’s Manual for CPLEX. International Business Machine Corporation,
[9] KHREISHAHA, WANGC-C & SHROFFN. 2009. Cross-layer optimization for wireless multihop net-works with pairwise intersession network coding.Selected Areas in Communications, IEEE Journal on,27(5): 606–621.
[11] LEEM, ZHENGJ, KOY-B & SHRESTHAD. 2006. Emerging standards for wireless mesh technol-ogy.Wireless Communications, IEEE,13(2): 56–63, april.
[12] MISRAS, MISRASC & WOUNGANGI. 2009.Guide to wireless mesh networks. Springer.
[13] PARISSIDISG, KARALIOPOULOSM, BAUMANNR, SPYROPOULOS T & PLATTNER B. 2009. Routing metrics for wireless mesh networks. In MISRA S, MISRA S & WOUNGANG I (edi-tors).Guide to Wireless Mesh Networks, Computer Communications and Networks, pages 199–230. Springer London.
[14] ROEVAO & TRENKOVAT. 2012. Modelling of a fed-batch culture applying simulated annealing.
BIOMATH,1(2), dec. 2012.
[15] SHABDANOVS, MITRAN P & ROSENBERGC. 2012. Cross-layer optimization using advanced physical layer techniques in wireless mesh networks.Wireless Communications, IEEE Transactions on,11(4): 1622–1631, april.
[16] SILVAM, SENNEELF & VIJAYKUMARNL. 2014. Cross-layer optimization applied to obtain time metric specified to wireless mesh networks. In Proceedings of 11th International Conference on Operations Research, pages 1–4, Havana.
[17] SILVAM, SENNEELF & VIJAYKUMARNL. 2014. Optimization methods applied to nonlinear signal interference models. InProceedings of 4th International Conference on Engineering Optimization, volume 1, pages 681–686, Lisbon.
[18] SZUH & HARTLEYR. 1987. Nonconvex optimization by fast simulated annealing.Proceedings of the IEEE,75(11): 1538–1540.
[19] TANG J, XUE G & ZHANGW. 2009. Cross-layer optimization for end-to-end rate allocation in multi-radio wireless mesh networks.Wireless Networks,15(1): 53–64, Jan.
[20] WEBER S & ANDREWSJG. 2012. Transmission capacity of wireless networks.The Computing Research Repository, abs/1201.0662.
[21] YAZDANPANAHM, ASSIC & SHAYANY. 2011. Cross-layer optimization for wireless mesh net-works with smart antennas.Computer Communications,34(16): 1894–1911.