ISSN 0104-6632 Printed in Brazil
www.abeq.org.br/bjche
Vol. 29, No. 04, pp. 691 - 698, October - December, 2012
Brazilian Journal
of Chemical
Engineering
STATISTICAL OPTIMIZATION OF MEDIUM
COMPOSITIONS FOR CHITOSANASE
PRODUCTION BY A NEWLY ISOLATED
Streptomyces albus
S. W. Cheng
1*, Y. F. Wang
2and B. Hong
11
Institute of Applied Microbiology, School of Life Sciences, Phone: + 86-535-6685003, Fax: +86-535-6696598, Ludong University, 186 Hongqi Central Road, Yantai 264025, China.
E-mail: [email protected] 2
Department of Electronic Engineering, Yantai Vocational College, 2018 Laishan Central Road, Yantai 264670, China.
(Submitted: December 14, 2011 ; Revised: May 4, 2012 ; Accepted: May 9, 2012)
Abstract - The nutritional medium compositions required for chitosanase production by Streptomyces albus
YT2 were optimized, and the strain was isolated from the coastal soil of Bohai Sea. Plackett–Burman design was applied to evaluate the effect of different medium compositions obtained by one-factor-at-a-time experiments. Glucose, peptone and MgSO4 were found to influence the activity of chitosanase significantly.
The steepest ascent method was employed to approach the experimental design space, followed by the use of Box–Behnken design and response surface methodology for further optimization of the chitosanase production. The medium composition for optimal production of chitosanase was as follows: 0.5 g/L chitosan, 55 g/L glucose, 1 g/L peptone,2 g/L (NH4)2SO4, 8 g/L urea,1g/L NH4Cl, 3 g/L KH2PO4, 1 g/L FeSO4·7H2O,
2 g/L ZnSO4·7H2O, 2 g/L CaCl2·6H2O, 2 g/L MnSO4·H2O and 2 g/L NaCl. The chitosanase production was
found to increase from 11.56 U/mL to 39.87 U/mL, a 3.47-fold increase compared with that using the original medium.
Keywords:Chitosanase; Fermentation optimization; Medium compositions; Response surface methodology;
Streptomyces albus.
INTRODUCTION
Chitooligosaccharides, which are depolymerization products of chitosan and with 2 to 10 glucosamines united by a β-1,4-glycoside linkage (Ming et al., 2006), have a variety of functional properties, such as antitumor (Jeon et al., 2001) and antimicrobial activity (Mengíbar et al., 2011), and have several potential applications in the food, agriculture and pharmaceutical industry (Molloy et al., 2004; Palma-Guerrero et al., 2010; Wang et al., 2011). Chitooligosaccharides are considered to be superior to chitosan due to their low molecular weights and viscosities. In particular,
chitooligosaccharides are generally soluble in neutral aqueous solution (Kima and Rajapakse, 2005). Thus, the production of chitooligosaccharides from chitosan has received increased attention.
microorganisms lead to different polymerization degrees (Chiang et al., 2003). For example, chitotriose was obtained as the major product by hydrolyzing chitosan with chitosanase from
Gongronella sp. JG (Wang et al., 2008), while
heptamers and oligomers with higher polymerization degrees were obtained by chitosanase CBCIII from
Bacillus cereus (Lin et al., 2009). So application of
novel and potential chitosanases has recently gained importance as an advanced alternative approach for producing chitooligosaccharides (Wee et al., 2009).
The present study optimized the chitosanase production in shake-flask culture by Streptomyces
albus YT2, which is a new isolated strain from our
laboratory. Effective and statistical optimization steps were carried out as follows: (1) by screening medium compositions that affect chitosanase production significantly using a Plackett–Burman design; (2) by accessing the optimal region of the significant variables using the steepest ascent method; (3) by optimizing these significant variables by response surface methodology; (4) by validating the model developed under the optimized conditions.
MATERIALS AND METHODS
Microorganism and Inoculum Preparation
Strain YT2 was screened from the coastal soil of Bohai Sea, isolated with 2% (w/v) colloidal chitosan as the sole carbon source, and identified as
Streptomyces albus YT2 based on the biochemical
properties. The cells from the stock cultures were transferred to 50 mL aliquots of pre-cultivation medium dispensed into 500 mL Erlenmeyer flasks, and afterwards incubated for 24 h at 32 °C and 220 rpm. The pre-cultivation medium consisted of: 5 g/L chitosan, 20 g/L glucose, 10 g/L peptone, 5 g/L yeast extraction, 1 g/L KH2PO4, 1 g/L K2HPO4·3H2O, 3 g/L MgSO4, 2 g/L NaCl, pH = 7.5.
Chitosanase Production
For chitosanase production by S. albus YT2, 4 % (v/v) of inoculum (1.1×10⁷ cfu/mL) was transferred into an Erlenmeyer flask (500 mL) containing 50 mL of fermentation medium at an initial pH 7.5, in which the compositions were varied based on the experimental designs. The fermentation culture in shake flasks was carried out at 32 °C and 220 rpm for 48 h. After the fermentations designed for each set of experiments, the culture broth was centrifuged for 10 min at 8 000×g using a bench-top centrifuge
(Hermle Z323K, Germany) and the chitosanase activity in the cell-free supernatant was determined.
Determination of Chitosanase Activity
Chitosanase activity was determined by quantita-tive estimation of the reducing sugars produced from chitosan, and 85% deacetylated chitosan was used as substrate in the chitosanase assay. The reaction mixture contained 0.9 mL of 1% (w/v) soluble chitosan, 0.1 mL of diluted enzyme solution and 1 mL of 0.1 mol/L sodium acetate buffer (pH 5.8). The reaction tubes were incubated at 50 °C for 15 min. The reducing sugars formed in the supernatant were estimated spectrophotometrically at 540 nm using the dinitrosalicyclic acid method (Miller, 1959), with glucosamine as the calibration standard. Data are the means of duplicates, and standard errors were less than 5% of the means. One unit of chitosanase was defined as the amount of enzyme that could liberate l μmol of reducing glucosamine per min under the conditions described above.
Experimental Design and Data Analysis
Plackett–Burman Design
The variables that significantly influence the chitosanase production were screened using a fractional factorial Plackett–Burman (PB) design (Plackett and Burman, 1946). Thirteen independent medium compositions were evaluated at two levels (high and low) which were designated as level + 1 and level -1 respectively (Table 1).
Table 1: Minimum and maximum ranges for the parameters selected in Plackett–Burman design
Concentration (g/L) Variables Factors
-1 level 1 level
X1 Chitosan 0.25 0.50
X2 Glucose 15 25
X3 Peptone 3 6
X4 (NH4)2SO4 2 4
X5 Urea 4 8
X6 NH4Cl 1 2
X7 MgSO4 1 2
X8 KH2PO4 3 6
X9 FeSO4·7H2O 1 2
X10 ZnSO4·7H2O 1 2
X11 CaCl2·6H2O 1 2
X12 MnSO4·H2O 1 2
The significant variables were screened in 20 combinations according to the design matrix, and the responses were measured as chitosanase activity. For the selection of these factors, Design Expert 7.1.6 (Stat-Ease, Inc., Minneapolis, USA) was used to generate and analyze the experimental design of Plackett– Burman.
Path of Steepest Ascent Method
The direction of steepest ascent was parallel to the normal contour line of the model response curve and passed through the center point of the PB design experiment. The significant variables screened with the Plackett–Burman design experiments were roughly optimized using the steepest ascent method to determine the center points of each variable for the next optimization step. Experiments were performed along the steepest ascent path until no improvement in the response could be observed. This point should be near to the optimal point and could be used as the center point to optimize (Sun et al., 2007) in the following steps.
Box–Behnken Design and Response Surface Methodology
As screened through the Plackett–Burman design, three independent variables, i.e., glucose, peptone and MgSO4, were studied at three different levels (-1, 0, +1) and the factors were coded. Seventeen experiments were conducted containing five replications at the center point for estimating the purely experimental uncertainty variance. The statistical software package Design Expert® 7.1.6 was used to analyze the results. The behavior of each variable, their interactions, and statistical analysis to obtain predicted responses were explained by the following second-order polynomial equation (Coelho
et al., 2011, Liu et al., 2006):
k k
2
0 i i ii i
i 1 i 1
k k
ij i j i 1 j 1
b b x b x
b x x ,i j
= =
= =
= + +
+ <
∑
∑
∑∑
Y
(1)
where Y represents the response variable, b0 is the interception coefficient, bi is the coefficient of the linear effect, bii is the coefficient of quadratic effect, bij is the coefficient of the interaction effect when i < j, and k is the numbers of variables involved.
Validation of the Quadratic Model
In order to validate the optimization of medium compositions, fermentations were conducted using optimal medium compositions for the enzyme production at 32 ºC and 220 rpm for 48 h in 500 mL Erlenmeyer flasks containing 50 mL aliquots of the optimized medium.
RESULTS AND DISCUSSION
Selection of Significant Variables Affecting Chitosanase Activity
The optimization of the culture medium was carried out by a combination of non-statistical methodology and statistical methodology based experimental designs. Medium compositions used in the PB design were selected through non-statistical methodology (one-factor-at-a-time experiments). One-factor-at-a-time experiments revealed that chitosan, glucose, peptone,(NH4)2SO4, urea, NH4Cl, MgSO4, KH2PO4, FeSO4·7H2O, ZnSO4·7H2O, CaCl2·6H2O, MnSO4·H2O and NaCl could potentially have more effect on the chitosanase activity, and 11.56 U/mL of enzyme activity was observed (data not shown).
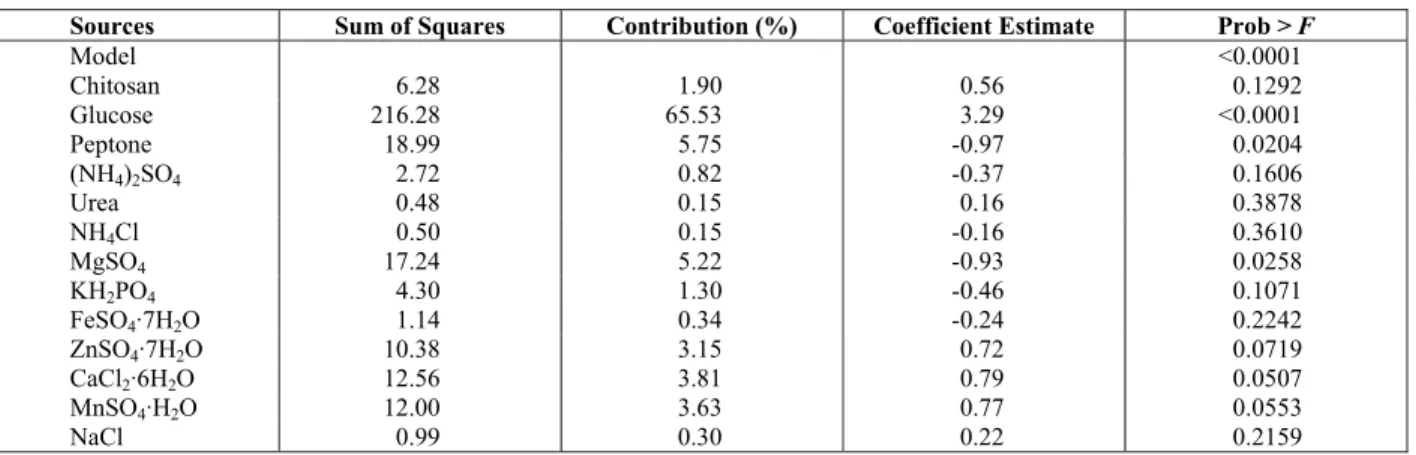
The matrix developed by the PB design and the results (chitosanase activity) are presented in Table 2, and the regression analysis is shown in Table 3. An adequate precision of 11.17 indicated an adequate signal as it measures the signal-to-noise ratio, and this model could be used to navigate the design space. Values of "Prob > F" less than 0.05 indicated that model terms were significant, on the basis of statistical analysis, Regression analysis determined that the compositions of glucose (P <0.0001), peptone(P = 0.0204,) and MgSO4 (P = 0.0258) had a significant effect on the enzyme activity, so the compositions of these compounds were evaluated in the further optimization experiments. After the neglect of insignificant terms (with P-values higher than 0.05), a modified first-order equation was developed to describe enzyme activity:
4.08 0.66 0.65 – 1.86
= − + 2− 3 7
Y X X X (2)
Table 2: Plackett–Burman design with coded values along with the observed results
Coded variable level Trial
X1 X2 X3 X4 X5 X6 X7 X8 X9 X10 X11 X12 X13
Chitosanase Activity (U/mL)
1 1 1 -1 -1 1 1 1 1 -1 1 -1 1 -1 14.75 2 -1 1 1 -1 -1 1 1 1 1 -1 1 -1 1 11.57 3 1 -1 1 1 -1 -1 1 1 1 1 -1 1 -1 5.78
4 1 1 -1 1 1 -1 -1 1 1 1 1 -1 1 15.95
5 -1 1 1 -1 1 1 -1 -1 1 1 1 1 -1 16.39 6 -1 -1 1 1 -1 1 1 -1 -1 1 1 1 1 5.77 7 -1 -1 -1 1 1 -1 1 1 -1 -1 1 1 1 7.82 8 -1 -1 -1 -1 1 1 -1 1 1 -1 -1 1 1 5.74
9 1 -1 -1 -1 -1 1 1 -1 1 1 -1 -1 1 6.35
10 -1 1 -1 -1 -1 -1 1 1 -1 1 1 -1 -1 12.66 11 1 -1 1 -1 -1 -1 -1 1 1 -1 1 1 -1 6.98 12 -1 1 -1 1 -1 -1 -1 -1 1 1 -1 1 1 16.97
13 1 -1 1 -1 1 -1 -1 -1 -1 1 1 -1 1 9.35
14 1 1 -1 1 -1 1 -1 -1 -1 -1 1 1 -1 15.72 15 1 1 1 -1 1 -1 1 -1 -1 -1 -1 1 1 14.13 16 1 1 1 1 -1 1 -1 1 -1 -1 -1 -1 1 10.88 17 -1 1 1 1 1 -1 1 -1 1 -1 -1 -1 -1 6.17
18 -1 -1 1 1 1 1 -1 1 -1 1 -1 -1 -1 5.54
19 1 -1 -1 1 1 1 1 -1 1 -1 1 -1 -1 8.02
20 -1 -1 -1 -1 -1 -1 -1 -1 -1 -1 -1 -1 -1 8.07
Table 3: Regression analysis of the PB design for chitosanase production
Sources Sum of Squares Contribution (%) Coefficient Estimate Prob > F
Model <0.0001
Chitosan 6.28 1.90 0.56 0.1292 Glucose 216.28 65.53 3.29 <0.0001 Peptone 18.99 5.75 -0.97 0.0204
(NH4)2SO4 2.72 0.82 -0.37 0.1606
Urea 0.48 0.15 0.16 0.3878
NH4Cl 0.50 0.15 -0.16 0.3610
MgSO4 17.24 5.22 -0.93 0.0258
KH2PO4 4.30 1.30 -0.46 0.1071
FeSO4·7H2O 1.14 0.34 -0.24 0.2242
ZnSO4·7H2O 10.38 3.15 0.72 0.0719
CaCl2·6H2O 12.56 3.81 0.79 0.0507
MnSO4·H2O 12.00 3.63 0.77 0.0553
NaCl 0.99 0.30 0.22 0.2159
Steepest Ascent Method for Determination of Center Point
Plackett–Burman design experiments proved to be a valuable tool for screening significant variables that affected the chitosanase activity, but it was unable to predict the optimum levels of the compositions (Chen et al., 2009). Based on the modified first-order equation obtained and the regression results, glucose, peptone and MgSO4 were found to be significant factors, which meant that increasing the concentration of X2 while decreasing
X3 and X7 had a positive effect on the chitosanase activity. The path of steepest ascent was determined to find the proper direction of changing the factors
above in order to improve enzyme activity. The experimental design of the steepest ascent and the corresponding results are shown in Table 4.
Table 4: Experimental design and results of the steepest ascent path
Trial Glucose (g/L)
Peptone (g/L)
MgSO4 (g/L)
Chitosanase activity (U/mL)
Origin 25 3.0 1.0 13.63
1 30 2.5 0.8 20.40
2 35 2 0.6 22.74
3 40 1.5 0.4 26.81
4 45 1.0 0.2 28.99
5 50 0.5 0.1 32.37
Regarding the results from the steepest ascent path, it was apparent that the yield profile showed a maximum of 32.37 U/mL at run 5. Consequently, this point was near to the region of maximum chitosanase activity response. Thus, an appropriate center point for the further optimization step was chosen: 50 g/L glucose, 0.5 g/L peptone and 0.1 g/L MgSO4.
Box–Behnken Design and Response Surface Methodology
Once the ranges of the relevant variables were selected through the PB screening and steepest ascent experiment, Box–Behnken design (BBD) and response surface methodology (RSM) were used to obtain a quadratic model, and then appraise the quadratic results and central points to estimate the pure process variability(Wang et al., 2008, Ottoni
et al., 2012), with chitosanase activity as response.
Three compositions, i.e., glucose, peptone and MgSO4, that significantly affected chitosanase activity were optimized by RSM using a 3-factor-3-level BBD. Therefore, 17 experiments with different combinations of glucose, peptone and MgSO4 were conducted (Tables 5 and 6). The results were analyzed by ANOVA and, following quadratic regression, an equation was obtained in terms of chitosanase activity.
Table 5: Coded and real values of variables in the Box-Behnken design
Levels of factors Factors
-1 0 1
A: Glucose (g/L) 45 50 55
B: Peptone (g/L) 0 0.5 1
C: MgSO4 (g/L) 0 0.1 0.2
Table 6: Observed and predicted values of chitosanase activity for the BBD matrix
Coded variable level Chitosanase activity (U/mL) Trial
A B C Observed Predicted
1 -1 -1 0 33.05 31.92
2 1 -1 0 35.90 36.37
3 -1 1 0 31.96 31.49
4 1 1 0 32.93 34.06
5 -1 0 -1 32.93 34.31
6 1 0 -1 38.34 38.12
7 -1 0 1 32.37 32.59
8 1 0 1 37.19 35.81
9 0 -1 -1 33.05 32.80
10 0 1 -1 37.20 36.29
11 0 -1 1 34.74 35.64
12 0 1 1 29.17 29.42
13 0 0 0 29.80 29.11
14 0 0 0 29.72 29.11
15 0 0 0 27.41 29.11
16 0 0 0 30.20 29.11
17 0 0 0 28.44 29.11
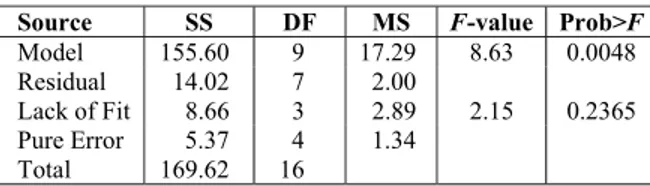
The highest activity of chitosanase observed was 38.34 U/mL in run 6 (Table 6). The model F-value of 8.63 implied that the model was significant, because there was only a 0.48% chance that the "Model F-Value" could occur due to noise (Table 7). The regression equation obtained after ANOVA indicated that the R-Squared value of 0.9173 (a value of R-Squared > 0.75 indicated the aptness of the model) ensured a satisfactory adjustment of the quadratic model to the experimental data. "Adeq. Precision" measures the signal to noise ratio. A ratio greater than 4 is desirable, and the ratio of 8.283 indicated an adequate signal. This model could be used to navigate the design space, and a low coefficient of variation (CV = 4.34 %) demonstrated that the experiments were precise and reliable. The "Lack of Fit F-value" of 2.15 implied that the Lack of Fit was not significant relative to the pure error. A second-order polynomial function was fitted to the experimental chitosanase activity, resulting in the following regression equation in terms of actual factors:
Chitosanase activity 309.74 11.55
7.53 32.75 0.19 0.30
48.60 0.12 5.36 308.68
= −
+ − − −
− + 2+ 2+ 2
A
B C AB AC
BC A B C
(3)
Table 7: Analysis of variance for the second-order polynomial model for optimization of chitosanase activity
Source SS DF MS F-value Prob>F
Model 155.60 9 17.29 8.63 0.0048
Residual 14.02 7 2.00
Lack of Fit 8.66 3 2.89 2.15 0.2365
Pure Error 5.37 4 1.34
Total 169.62 16
R2
=0.9173; CV% = 4.34; SS, sum of squares; DF, degrees of freedom and MS, mean square.
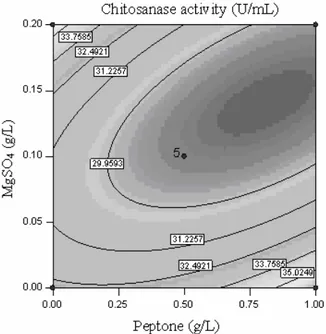
Figures 1 to 3 show the contour plots for chitosanase activity. Evidently, the chitosanase activity varied significantly with the concentration of glucose, peptone and MgSO4. The optimum value of each variable was identified based on the hump in the three dimensional plot, or from the central point of the corresponding contour plot. The results predicted by the model equation from RSM indicated that a combination of adjusting the concentration of glucose to 55 g/L, peptone to 1 g/L, and MgSO4 to 0 g/L would favor maximum chitosanase activity, giving 40.73 U mL-1.
not catabolically repressed, which was different from that in Acinetobacter sp. C-17 (Zhu et al., 2003) and
Bacillus cereus D-11 (Gao et al., 2008). Peptone as a
better nutrient source is needed by several microorganisms (Chen et al., 2009), but did not favor chitosanase production from S. albus YT2 in higher
concentration. The effect of ions on the chitosanase from S. albus YT2 was studied (data not shown) and it was found that Mg2+ was an inhibitor of the chitosanase from S. albus YT2, only 62% activity was obtained at 20 μmol/L of MgSO4, which proved the optimized result that no added MgSO4 was correct.
Figure 1: Contour plot of chitosanase activity
showing the interaction between glucose concen-tration and peptone concenconcen-tration at C = 0
Figure 2: Contour plot of chitosanase activity
showing the interaction between glucose concen-tration and MgSO4 concentration at B = 0
Figure 3: Contour plot of chitosanase activity showing
Experimental Validation of the Optimized Condition
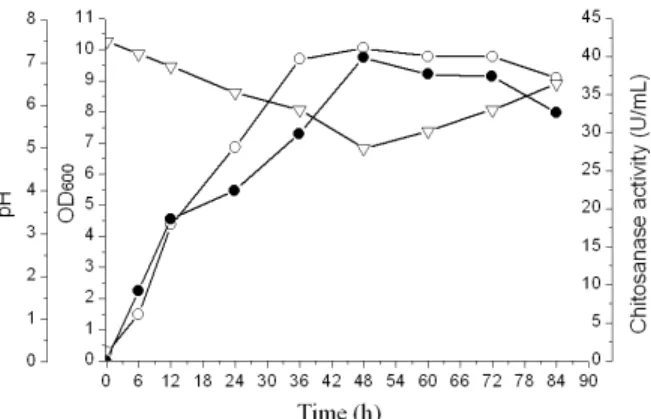
In order to confirm the optimized results, the culture of S. albus YT2 was studied using the optimal medium composition, and the results are shown in Figure 4. The maximum rate of chitosanase activity was 39.87 U/mL at 48 h, which was almost equal to the predicted value. By means of optimizing the medium composition, the activity of chitosanase was enhanced from 11.56 U/mL to 39.87 U/mL, a 3.45-fold increase. This result therefore corroborated the predicted values and the effectiveness of the model, which indicated that the optimized medium was propitious for the production of chitosanase from S. albus YT2. The final medium composition optimized with response surface methodology was: 0.5 g/L chitosan, 55 g/L glucose, 1 g/L peptone, 2 g/L (NH4)2SO4, 8 g/L urea,1g/L NH4Cl, 3 g/L KH2PO4, 1 g/L FeSO4·7H2O, 2 g/L ZnSO4·7H2O, 2 g/L CaCl2·6H2O, 2 g/L MnSO4·H2O and 2 g/L NaCl.
Figure 4: Profiles of chitosanase production in
shake-flask experiments using the optimized medium. -●- chitosanase activity; -○- OD600; -v- pH
Microbial chitosanase production has been reported by several authors, such as Bacillus cereus
(1.5 U/mL)(Piza et al., 1999),Bacillus sp. RKY3 (63.53 U/mL)(Wee et al., 2009), Streptomyces griseus
(0.92 U/mL)(Kim et al., 2001), Acinetobacter sp. C-17 (2.8 U/mL)(Zhu et al., 2003), Aspergillus sp (1.18 U/mL)
(Li et al., 2008) and Matsuebacter chitosanotabidus
(15.24 U/mL)(Park et al., 1999). Nevertheless, as far as we know, this constitutes the first report of chitosanase production by S. albus. Furthermore, the maximum chitosanolytic activity (39.87 U/mL) of
S. albus YT2 was relatively high, and this organism
has potential to be a suitable chitosanase producer. At the same time, further study of the purification and catalytic characterization of chitosanase from
S. albus YT2 is in progress.
CONCLUSIONS
Statistically based experimental designs proved to be effective for optimizing the culture medium for chitosanase activity by S. albus YT2, which resulted in about a 3.5-fold increase in the chitosanase activity relative to the original medium. Validation experiments were also carried out to verify the adequacy and accuracy of the model, and the results showed that the predicted value agreed well with the experimental values. The optimum culture medium obtained in this work provides the basis for further studies on a large scale using bioreactors.
ACKNOWLEDGEMENTS
This study was supported by the project of Shandong Province Higher Educational Science and Technology Program (J12LD02) and the research project of Ludong University (LY20083305).
REFERENCES
Chen, X. C., Bai, J. X., Cao, J. M., Li, Z. J., Xiong, J., Zhang, L., Hong, Y. and Ying, H. J., Medium optimization for the production of cyclic adenosine 3’,5’-monophosphate by Microbacterium sp. no. 205 using response surface methodology. Bioresource Technol., v. 100, 919-924 (2009). Chiang, C. L., Chang, C. T. and Sung, H. Y.,
Purification and properties of chitosanase from a mutant of Bacillus subtilis IMR-NK1. Enzyme Microb. Tech., v. 32, 260-267 (2003).
Coelho, L. F., Lima, C. J. B., Rodovalho, C. M., Bernardo, M. P. and Contiero, J., Lactic acid production by new Lactobacillus plantarum
LMISM6 grown in molasses: Optimization of medium composition. Braz. J. Chem. Eng., vol. 28, 27-36 (2011).
Gao, X. A., Ju, W. T., Jung, W. J. and Park, R. D, Purification and characterization of chitosanase from Bacillus cereus D-11. Carbohyd. Polym., v. 72, 513-520 (2008).
Hsiao, Y. C., Lin, Y. W., Su, C. K. and Chiang, B. H., High degree polymerized chitooligosaccharides synthesis by chitosanase in the bulk aqueous system and reversed micellar microreactors. Process Biochem., v. 43, 76-82 (2008).
Kim, S. K. and Rajapakse, N., Enzymatic production and biological activities of chitosan oligosaccharides (COS): A review. Carbohyd. Polym., v. 62, 357-368 (2005).
Kim, K. and Ji, H. S., Effect of chitin sources on production of chitinase and chitosanase by
Streptomyces griseus HUT 6037. Biotechnol.
Bioprocess Eng., v. 6, 18-24 (2001).
Lin, Y. W., Hsiao, Y. C. and Chiang, B. H., Production of high degree polymerized chitooligosaccharides in a membrane reactor using purified chitosanase from Bacillus cereus. Food Res. Int., v. 42, 1355-1361 (2009).
Li, S., Chen, L., Wang, C. and Xia, W., Expression, purification and characterization of endo-type chitosanase of Aspergillus sp. CJ22-326 from
Escherichia coli. Carbohyd. Res., v. 343,
3001-3004 (2008).
Liu, C. H., Lu, W. B. and Chang, J. S., Optimizing lipase production of Burkholderia sp. by response surface methodology. Process Biochem., v. 41, 1940-1944 (2006).
Mengíbar, M., Ganan, M., Miralles, B., Carrascosa, A. V., Martínez-Rodriguez, A. J., Peter, M. G. and Heras, A., Antibacterial activity of products of depolymerization of chitosans with lysozyme and chitosanase against Campylobacter jejuni. Carbohyd. Polym., v.84, 844-848 (2011).
Miller, G. L., The use of dinitrosalicylic acid reagent for the determination of reducing sugars. Anal. Chem., v. 31, 426-428 (1959).
Ming, M., Kuroiwa, T., Ichikawa, S., Sato, S. and Mukataka, S., Production of chitosan oligosac-charides by chitosanase directly immobilized on an agar gel-coated multidisk impeller. Biochem. Eng. J., v. 28, 289-294 (2006).
Molloy, C., Cheah, L. H. and Koolaard, J. P., Induced resistance against Sclerotinia sclerotiorum
in carrots treated with enzymatically hydrolysed chitosan. Postharvest Bio. Tech., v. 33, 61-65 (2004).
Ottoni, C. A., Cuervo-Fernández, R., Piccoli, R. M., Moreira, R., Guilarte-Maresma, B., Silva, E. Sabino da, Rodrigues, M. F. A. and Maiorano, A. E., Media optimization for β-Fructofuranosidase production by Aspergillus oryzae. Braz. J. Chem.
Eng., v. 29, 49-59 (2012).
Palma-Guerrero, J., Gómez-Vidal, S., Tikhonov, V. E., Salinas, J., Jansson, H. B. and Lopez-Llorca, L. V., Comparative analysis of extracellular proteins from
Pochonia chlamydosporia grown with chitosan or
chitin as main carbon and nitrogen sources. Enzyme Microb. Tech.,v. 46, 568-574 (2010). Park, J. K., Shimono, K., Ochiai, N., Shigeru, K.,
Kurita, M. and Ohta, Y., Purification, characteri-zation and gene analysis of a chitosanase (ChoA) from Matsuebacter chitosanotabidus 3001. J. Bacteriol., v. 181, 6642-6649 (1999).
Piza, F. A. T., Siloto, A. P., Carvalho, C. V. and Franco, T. T, Production, characterization and purification of chitosanase from Bacillus cereus. Braz. J. Chem. Eng., v. 16, 185-192 (1999). Plackett, R. L. and Burman, J. P., The design of
optimum multifactorial experiments. Biometrika, v. 33, 305-325 (1946).
Sun, Y., Han, B., Liu, W., Zhang, J. and Gao, X., Substrate induction and statistical optimization for the production of chitosanase from
Microbacterium sp. OU01. Bioresource Technol.,
v. 98, 1548-1553 (2007).
Wang, J., Zhou, W., Yuan, H. and Wang, Y., Characterization of a novel fungal chitosanase Csn2 from Gongronella sp. JG. Carbohyd. Res., v. 343, 2583-2588 (2008).
Wang, S. L., Liang, T. W. and Yen, Y. H., Bioconversion of chitin-containing wastes for the production of enzymes and bioactive materials. Carbohyd. Polym., v. 84, 732-742 (2011).
Wang, Z. W. and Liu, X. L., Medium optimization for antifungal active substances production from a newly isolated Paenibacillus sp. using response surface methodology. Bioresource Technol., v. 99, 8245-8251 (2008).
Wee, Y. J., Reddy, L. V. A., Chung, K. C. and Ryu, H. W., Optimization of chitosanase production from Bacillus sp. RKY3 using statistical experi-mental designs. J. Chem. Technol. Biotechnol., v. 84, 1356-1363 (2009).
Zhu, X. F., Wu, X. Y. and Dai, Y., Fermentation conditions and properties of a chitosanase from
Acinetobacter sp. C-17. Biosci. Biotechnol.