INTRODUCTION
Ferroelectric materials have been intensively investigated in the last decades for their potential applications in a variety of electronics application; including volatile memories and MEMS devices [1-5]. The non-volatile ferroelectric random access memories have been drawn considerable interest in which the information is stored in the polarization states of ferroelectrics. PZT with stichometry formula Pb (Zr0.52Ti0.48) O3 is reported to be near the morphotropic phase boundary (MPB) shows large remanent polarization, optimum piezoelectric property and high Curie temperature [6, 7]. The MPB is an almost temperature-independent phase boundary that separates two ferroelectric phases: a tetragonal crystal structure
(P4mm) and a rhombohedral structure (R3c). Compositions
near the MPB may have both of these phases coexisting to give a total of fourteen possible polarization directions (six tetragonal <001> and eight rhombohedral <111> in reference to the cubic prototype cell axes.
The possibilities of improving ferroelectric and piezoelectric properties of ceramics by physico-chemical
characteristics of precursors, additive type and proper selection of parameter of sintering process [8, 9]. By using different of types additive the properties of the PZT system can be changed. Donor and acceptor doping are used to obtain so-called ‘‘soft” and ‘‘hard’’ PZT materials, respectively [10-16].There are several substitution of elements (La, Nd, etc.) on Pb side gives rise to hard and soft PZT. [16-18]. In the present paper the study was based on isovalent substitution of strontium on lead side of the PZT. Here the doping was done in the rhombohedral phase which haves order along [111] direction leads to a favourable piezoelectric properties [19].
The microstructure, ferroelectric and piezoelectric properties of strontium substituted lead zirconate titanate (PSZT) have been reported by various groups [23-27]. According to our knowledge there is no report on ferroelectric and piezoelectric property of the PSZT nanocrystallite in 15-16nm range. The objective of this paper is to investigate the
infl uence of condition of the sol gel process on crystallite
size and the effect of crystallite size on the ferroelectric and piezoelectric property of PZT doped with strontium (PSZT)
at MPB i.e. Zr/Ti ≈ 52/48.
Studies of Sr
2+ion substitution on ferroelectric and piezoelectric
properties of PZT nanocrystalline
(Estudos da substituição do íon Sr
2+nas propriedades ferroelétricas e
piezoelétricas do PZT nanocristalino)
P. Kour, S. K. Sinha
Department of Applied Physics, Birla Institute of Technology, Patna-800014 [email protected], [email protected]
Abstract
Strontium substituted lead zirconate titanate nanocrystalline material with chemical formula Pb0.95Sr0.05 (Zr0.52Ti0.48) O3 have been
synthesized by alkoxide based sol gel method. The product was characterized by differential thermal analysis, thermogravimetric analysis, powder X-ray diffraction and scanning electron microscopy. The ferroelectric hysteresis loop measurement was carried
out at room temperature using ferroelectric loop tracer over a fi eld range of 20 kV/cm. The remanent polarization Pr, saturation
polarization Pmax and coercive fi eld Ec were 12.97 μC/cm2, 30.52 μC/cm2 and 6.5 kV/cm respectively. The piezoelectric coef
fi cient
d33 was measured with the variation of polling fi eld.
Keywords: ferroelectric properties, nanocrystallite, polarization, PSZT.
Resumo
O material nanocristalino titanato zirconato de chumbo com substituição por estrôncio de fórmula química Pb0,95Sr0,05 (Zr0,52Ti0,48) O3 foi sintetizado pelo método solgel baseado em alcóxidos. O produto foi caracterizado por análise térmica diferencial, análise termogravimétrica, difração de raios X e microscopia eletrônica de varredura. A medida do loop de histerese ferroelétrica foi feita à temperatura ambiente com um traçador de loop na faixa até 20 kV/cm. A polarização remanente Pr, a polarização de saturação Pmax e o campo coercitivo Ec foram 12,97 μC/cm2, 30,52 μC/cm2 e 6,5 Kv/cm, respectivamente. O coefi ciente piezoelétrico d
33 foi medido em função do campo de polarização.
EXPERIMENTAL
A compositions with the general chemical formula
Pb0.95Sr0.05(ZrxTi1−x)O3 was prepared using sol gel processing
routes, with x corresponding to different crystalline
modifications of the ferroelectric phase: tetragonal
(x=0.52), rhombohedral (x=0.48) [1]. 2-Methoxy ethanol
(2-MOE) was used as the starting precursor. Lead (II) acetatetrihydrate (99.99% purity, Aldrich), zirconium (IV) isopropoxide (70 wt.% purity , Aldrich) and titanium (IV) isopropoxide (97% purity, Aldrich) were used as the starting reagents to prepare the precursor solution with
stichometry Pb0.95Sr0.05(Zr0.52Ti0.48)O3 and strontium acetate
(99% purity, Aldrich) was used as Sr source. The fl ow
diagram for the preparation of PSZT gel is shown in the Fig. 1. 2-Methoxy ethanol mixed with acetyl acetone and stirred at room temperature for 0.5 h. Ti-isopropoxide was added to it while the temperature of the stirred solution
was kept at 80 °C. After 1 h the Zr-isopropoxide was added
to the heated stirred solution. After 1 h strontium acetate was added to it. Then lead acetate trihydrate was mixed with distilled water and added to the solution. Then it was
refl uxed at 80 °C for 3 h. At last 3 to 4 drops of nitric
acid was added to it. The solution was again refl uxed for
3 h at 80 °C. Then it was stirred room temperature to get
slightly yellowish clear transparent sol. It was then heated
and stirred at 80 °C to get the gelation of PSZT sol.
Differential thermal analysis (DTA) and thermogravicmetric analysis (TGA) of the green gel in
a temperature range 100 °C-1000 °C at a heating rate
of 10 °C/min was carried out to know the approximate
calcination temperature. The phase purity and homogeneity of the obtained material was determined by powder X-ray diffractometry. X-ray diffraction (XRD) measurements were performed at 2 values ranging from
15°and 70° using Philips X-ray diffractometer with
Ni-fi ltered Cukα radiation. The nanocrystalline PSZT calcined
powder was granulating and mixed with polyvinylalchol (PVA, 5% aqueous solution) in a mortar and pestle. The mixed powder was compacted to circular discs of 12 mm in diameter and ~1.5 mm in thickness by uniaxial pressing machine at 200 MPa. The binder was removed by heating
the pellet at 550 °C. Then binder burnout components were
sintered at 1000 °C for 3 h in a hermetically sealed alumina
crucible in a muffl e furnace. The surface morphology of
the sintered samples was analysed using scanning electron microscope (SEM, Jeol T330). Energy dispersive X-ray analysis (EDX) was used for elemental analysis of Sr doped PZT ceramics. The electroding of the sintered pellet was done by the silver paste. Then the sample was poled
at varying polling fi eld at an elevated temperature (~120
°C) for 2 h in silicon oil. The polarization-electric fi eld
(P-E) hysteresis measurement of poled PSZT pellet was done by Radiant Technology Hysteresis Analyser 4.4.0 at room
temperature. The linear piezoelectric coeffi cient (d33) of the
polled pellet was measured by the Sinocera YE2730Ad33
meter with the variation of polling fi eld.
RESULTS AND DISCUSSION
DTA/TG characterization
Thermal analysis of the green gel of PSZT (5/52/48) was examined by thermo gravimetry and differential thermal analysis, shown in Fig. 2. The weight loss occurred
in two steps and completed at 600 °C, as indicated by TGA
curves. In the fi rst stage weight loss was observed around
90 °C with an endothermic peak due to the removal of
water molecules. In the second stage a small exothermic
peak was observed around 300 °C due to the result of
simultaneous decomposition of organic molecule. A
large exothermic peak at 377 °C is ascribed to multiple
decomposition. The percentage of weight loss at 600 °C
and above was very small; hence calcination had been done
at 600 °C for a soaking time 3 h.
Figure 1: Flow diagram for obtaining the PSZT gel. [Figura 1: Fluxograma da obtenção do gel de PSZT.]
Stirring and heating at 80 oC
Stirring at room temeprature
2-methoxyethanol + Acetyl acetone
Ti-isopropoxide
Zr-isopropoxide Nitric
acid
PSZT sol Strontium
acetate
PSZT gel
Lead acetate trihydrate + distilled water
Heating and stirring at 80 oC
Refl ux at 80 oC
Gelation at 80 oC
Figure 2: DTA/TG curve of PSZT sample. [Figura 2: Curvas ATD/TG da amostra de PSZT.]
60
40
20
0
-20
-40
-60
-80
0
Temperature (ºC)
TG (mg)
DT
A
(uV)
200 400 600 800 1000
XRD characterization
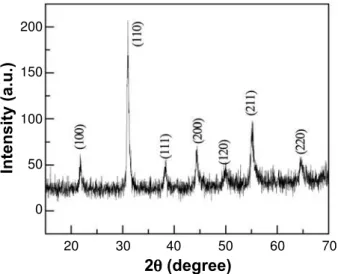
Fig. 3 shows the powder XRD pattern of PZT doped with strontium, PSZT (5/52/48).
The pattern shows a pure crystalline perovskite phase with no pyrochlore phase. The average crystallite size has been calculated using Scherrer formula and Williamson–
Hall plot. Scherrer formula [20] is defi ned as
D= kλ
βcosΘ
where the constant k depends upon the shape of the crystallite size (=0.89, assuming circular grains), is the full width at half maximum (FWHM) of intensity (a.u.) vs. 2 (degree)
profi le, is the wavelength of the Cukα radiation (=0.1542
nm), is Bragg diffraction angle and D is the average crystallite size. In Scherrer formula the average crystallite
size has been calculated using Gaussian fi t to the peaks in
XRD pattern. D has been taken as average to all the peaks.
Typical Williamson-Hall plot for PSZT (5/52/48) sample is displayed in Fig. 4. According to this method [21, 22] the
individual contributions to the broadening of refl ections can
be expressed as
βcosΘ= kλ +4εsinΘ D
The strain effect on the crystallites is represented by 4 .sin . Average crystallite sizes calculated by Scherrer formula were 16.16 nm and Williamson-Hall plot was 15.98 nm. The crystallite size obtained by Williamson-Hall method was less than those obtained by Scherrer formula. It was because the strain correction factor has been taken into account in case of Williamson-Hall method whereas it has not been taken into account in Scherrer’s method.
SEM characterization
The scanning electron microscopy micrograph of PSZT
(5/52/48) pellet sintered at 1000 °C for 8 h is shown in Fig.
5. Qualitatively it is observed that grains were uniformly distributed. The average grain size measured from the micrograph of the pellet is about 307.4 nm.
The EDX spectra of 5% Sr doped PZT pellet sintered
at 1000 °C is shown in Fig. 6. The presence of constituent
Figure 5: SEM image of PSZT sample. [Figura 5: Imagem MEV da amostra PSZT.]
Figure 6: EDX microanalysis of the PSZT pellet. [Figura 6: Microanálise EDX da cerâmica de PSZT.] Figure 3: XRD diffraction pattern of PSZT calcined powder.
[Figura 3: Difratograma de raios X do pó calcinado de PSZT.] 200
150
100
50
0
20
Intensity (a.u.)
2θ (degree)
40 60
30 50 70
Figure 4: Williamson-Hall plot of PSZT powder. [Figura 4: Gráfi co de Williamson-Hall do pó de PSZT.]
0.014
0.012
0.010
0.008
0.006
0.004
0.002
0.000 0.15
sin θ
β
β
cos
θ
element in PSZT pellet is indicated by the peak of Pb, Zr, Ti, Sr and O. The top electrode of the pellet was made of Pt, which is an also peak appearing in Fig. 6. So it could be attested that the PSZT ceramic was formed.
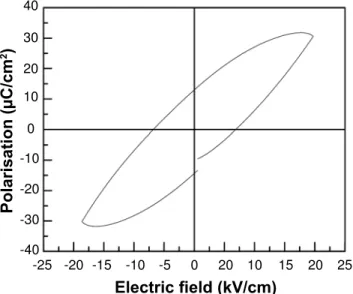
Ferroelectric hysteresis (P-E loop) of the PSZT (5/52/48)
pellet calcined at 1000 °C is presented in Fig. 7. The average
remanent polarization, (׀+Pr׀+׀-Pr׀)/2 of the PSZT pellet is
12.97 μC/cm2. The average coercive
fi eld, (׀+EC׀+׀ -EC׀)/2
for PSZT pellet is 6.5 kV/cm. The saturation polarization
(Pmax) of the pellet is 30.52 μC/cm2.
Fig. 8 shows the variation of piezoelectric coeffi cient
(d33) of PSZT (5/52/48) pellet with varying polling fi eld.
It is observed that with increasing the polling fi eld, the
piezoelectric co-effi cient (d33) increases. Maximum value
of piezoelectric co-effi cient (d33)is 413×10-12 C/Nat 33 kV/
cm polling fi eld. With further increase in the polling fi eld
Figure 7: P-E loop of PSZT pellet.
[Figura 7: Loop P-E loop da cerâmica de PSZT.] 40
30
20
10
0
-10
-20
-30
-40 -25
Electric fi eld (kV/cm)
Polarisation (
μ
C/cm
2)
-15 -5 10 20
-20 -10 0 20 15 25
Figure 8: Piezoelctric co-effi cient (d33 ) of PSZT pellet with the
variation of polling fi eld.
[Figura 8: Coefi ciente piezoelétrico (d33 ) da amostra PSZT em função do campo de polarização.]
450
350
250 400
300
200
150 20
Electric fi eld (kV/cm)
d 33
(pC/N)
25 30 35 40 45
it remains almost same. It indicates the orientation of the
domain reaches its fi nal alignment here.
CONCLUSIONS
Nanocrystallite of PSZT (5/52/48) has been successfully synthesized by the sol gel process. The thermogravimetric curve of the green gel of PSZT (5/52/48) shows the percentage
of weight loss at 600 °C and above it is very small. Hence
calcinations have been done at 600 °C. The XRD of PSZT
(5/52/48) powder shows the average crystallite size was in 15-16 nm range. The average grain size from SEM was also obtained in nano range. The piezoelectric and ferroelectric property enhance, due to the decrease in size of the average crystallite. Reasons for this could be related to processing and the control of grain boundary resistivity that lead to space-charge accumulation, which marks the size-effect response in the ferroelectric grains.
REFERENCES
[1] E. M. Lines, A. M. Glass, Principles and applications of ferroelectric and related materials, Cleardon, Oxford, UK (1977).
[2] G. H. Haertling, “Piezoelectricity and electro-optics
ceramics”, Ceramic Materials for Electronics, Ed.: R. C.
Buchanan, Marcel Dekker, New York, USA (1986) p. 168 [3] L. Benguigui, On the properties of PZT solid solutions: a reply to a comment, Solid State Comm. 19 (1986) 979-981.
[4] Y. Xu, Ferroelctric materials and their applications,
North Holland, New York, USA (1991) 72-100.
[5] R. E. Newnham, G. R. Ruschau, J. Am. Ceram. Soc. 74
(1991) 463.
[6] S. A. Mabud, The morphotropic phase boundary in PZT
solid solutions, J. Appl. Crystal. 13 (1980) 211-216.
[7] V. A. Isopov, Characteristics of coexistence of tetragonal
rhombohedral phases in piezoelectric ceramics based on PbTiO3 and PbZrO3, Sov. Phys.- Solid State 18, 4 (1976) 529-532.
[8] T. Yamamoto, Optimum Preparation Methods for
Piezoelectric Ceramics and their Evaluation, Am. Ceram.
Soc. Bull. 71(1992) 978-85.
[9] G. T. Murray, “Introduction of Engineering Materials”, Marcel Dekker, New York, USA (1993) 479-534.
[10] G. H. Haertling, Am. Ceram. Soc. Bull. 43 (1964)
875-879.
[11] M. Pisarski, Ferroelectrics 81 (1988) 297-300.
[12] A. H. Webster, T. B. Weston, J. Can. Ceram. Soc. 37
(1968) 51-54.
[13] H. Ouchi, K. Nagano, S. Hayakawa, J. Am. Ceram.
Soc. 48 (1965) 630-635.
[14] H. T. Martirena, J. C. Burfoot, J. Phys. C: Solid State
Phys. 7 (1974) 3182-9312.
[15] K. Keizer, E. H. Janssen, K. J. de Vries, A. J. Burggraaf,
Mater. Res. Bull. 8 (1973) 533-544.
[16] A. J. Burggraaf, K. Keizer, Mater. Res. Bull. 10 (1975)
[17] A. K. Shukla, V. K. Agrawal, I. M. L. Das, Janardansingh, S. L. Srivastava, Bull. Mater. Sci. 34, 1 (2011) 133-142.
[18] Uta Helbig, J. Eur. Ceram. Soc. 7 (2007) 2567-2576.
[19] R. S. Nasar, M. Cerqueira, E. Longo, J. A. Varela, A.
Beltran, J. Eur. Ceram. Soc. 22 (2002) 209-218.
[20] B. D. Culity, “Elements of X-ray Diffraction”, 2nd Ed.,
Addison-Wesley, USA (1978).
[21] G. K. Williamson, W. H. Hall, Acta Met. 1 (1953) 22.
[22] C. Suryanarayana, M. Grant Nortan, “X-ray Diffraction: A Practical Approach”, Plenum Publ. Corp., New York, USA (1998).
[23] R. Lal, S. C. Sharma, R. Dayal, Ferroelectrics 100, 1
(1989) 43-55.
[24] F. Kulcsar, J. Am. Ceram. Soc. 42, 1 (1959) 49-51.
[25] A. Dalakoti, A. Bandyopadhyay, S. Bose, J. Am. Ceram.
Soc. 89, 3 (2006) 1140-1143.
[26] M. Khalid, M. Shoaib, A. A. Khan, J. Nanosci,
Nanotech. 11, 6 (2011) 5440-5445.
[27] C. Bedoya, Ch. Mullerb, J.-L. Baudour, V. Madigou, M.
Anne, M. Roubin, Mater. Sci. Eng. B75 (2000) 43-52.