DISTINCTIVE SEDIMENTARY PROCESSES IN GUANABARA BAY – SE/BRAZIL,
BASED ON THE ANALYSIS OF ECHO-CHARACTER (7.0 kHz)
Leonardo F. Catanzaro
1, Jos´e Antˆonio Baptista Neto
1,2, Mauricio Souza Dias Guimar˜aes
1and Cleverson G. Silva
1Recebido em 31 marc¸o, 2004 / Aceito em 31 agosto, 2004 Received March 31, 2004 / Accepted August 31, 2004
ABSTRACT.Guanabara Bay bottom sediments and seabed characteristics were analysed using high-resolution (7 kHz) sub-bottom profiles associated with particle size analyses of 92 bottom sediment samples. Eight types of echo-characters were identified revealing the strong relation with the particle size distribution. Sandy bottom areas presented strong echo reflections, without sub-bottom penetration (Echo types I and III), while in muddy areas sub-bottom reflections showed the acoustic basement delineating buried sugar-loaf hills and infilled-valley features (Echo type IV). The presence of shallow gas within the sediments is indicated by acoustic blanket and a series of bottom-multiple reflections (Echo types Va and Vb). Erosion by bottom currents and artificial mechanical dredging are suggested by truncations of sub-bottom reflections and a wrinkled seabed surface (Echo types VI and VII). Crystalline basement outcrops on the seabed are recognized by multiple or single hyperbolae with varying elevations above the bay bottom (Echo type II).
Keywords: echo-character, dynamics of sediments, seismic of high resolution.
RESUMO.O presente trabalho faz uma descric¸˜ao geral das caracteristicas de fundo da Ba´ıa de Guanabara com base na descric¸˜ao de 92 amostras de sedimentos de fundo e na interpretac¸˜ao de perfis de perfilador de sub-fundo de alta freq¨uˆencia (7 kHz). Os oito tipos de ecocarater identificados revelam uma forte relac¸˜ao com as variac¸˜oes sedimentol´ogicas. Nas ´areas de fundo arenoso observa-se uma forte reflex˜ao do eco no fundo, impedindo a penetrac¸˜ao em subsuperficie (Tipos de eco I e III), enquanto que nas ´areas de fundo lamoso ´e poss´ıvel observar, abaixo dos refletores de sub-fundo, o embasamento ac´ustico fomando feic¸˜oes de morros tipo “p˜ao-de-ac¸ucar” e vales preenchidos (Tipo de eco IV). A presenc¸a de g´as nos sedimentos foi associada a uma s´erie de m´ultiplas e cortinas ac´usticas (Tipos de eco Va e Vb). Nas ´areas de eros˜ao, por correntes de fundo e dragagem mecˆanica, observa-se uma superf´ıcie irregular, com truncamentos dos refletores de sub-fundo (Tipos de eco VI e VII). Em regi˜oes de afloramento do embasamento cristalino ocorrem hip´erboles m´ultiplas ou simples, com elevac¸˜oes variadas acima do fundo submarino adjacente (Tipo de eco II).
Palavras-chave: eco-carater, dinˆamica de sedimentos, s´ısmica de alta resoluc¸˜ao.
1Departamento de Geologia/LAGEMAR, Universidade Federal Fluminense-Brazil, Av. Litorˆanea s/no – 24210-340 Gragoat´a, Niter´oi, RJ, Brasil. – E-mails: [email protected]; [email protected]; [email protected]; [email protected]
70
DISTINCTIVE SEDIMENTARY PROCESSES IN GUANABARA BAY – SE/BRAZIL, BASED ON THE ANALYSIS OF ECHO-CHARACTER (7.0 kHz)INTRODUCTION
High-frequency (3.5, 7.0 and 12 kHz) sub-bottom profiling has served as an important tool for deciphering near-bottom sedi-mentary processes in marine environments as demonstrated by several workers (e.g. Hollister & Heezen, 1972; Damuth, 1975; Embley, 1976; Flood, 1980; Jacobi & Hayes, 1992; Baptista Neto et al., 1996; Reddy & Rao, 1997; Dowdeswell et al., 1997; Zara-gosi et al., 2000; Hong & Chen, 2000; Quaresma et al., 2000; Lee et al., 2002). The types and distribution of the echo-character can be used as basis for the interpretation of depositional and erosio-nal processes, since the echo types are mainly controlled by sur-face topography, subsursur-face geometry and sedimentary texture of the superficial and sub-superficial sediments and rocks (Damuth, 1975, 1980; Embley, 1976; Damuth & Hayes, 1977).
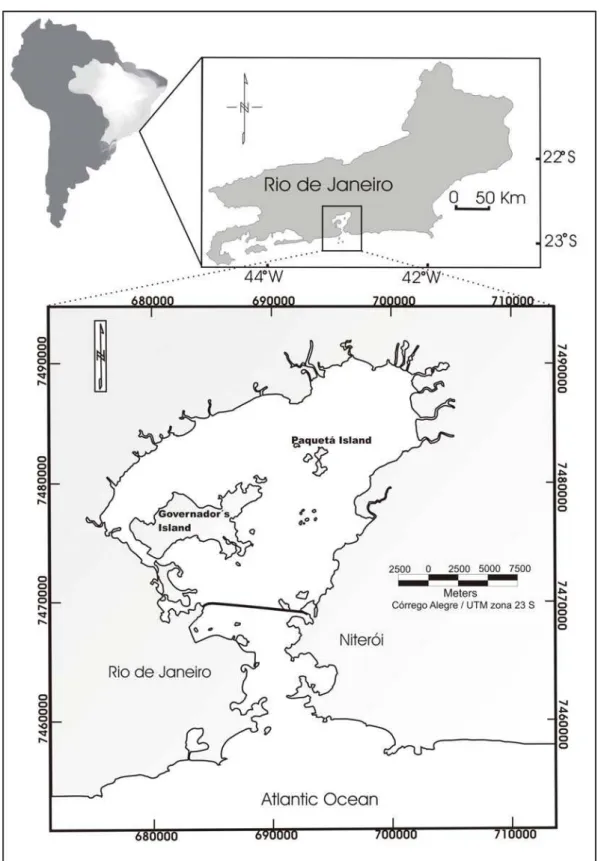
This study investigates sedimentary processes in the Guana-bara Bay (Rio de Janeiro - Brazil) (Figure 1), focusing on the bot-tom morphology and sediment characteristics distribution, inte-grating the geomorphologic, sedimentary and geophysical cha-racteristics of the bay bottom.
The Guanabara Bay is one of the most polluted bays on the Brazilian coastline, and great effort has been spent in order to de-pollute the bay. The development of studies to understand its hydrodynamics and bottom sediment characteristics in order to provide informations for environmental and water quality mana-gement projects devoted to the re-vitalization of Guanabara Bay.
ENVIRONMENTAL SETTING
Guanabara Bay is one of the largest bays along the Brazilian co-astline, located in Rio de Janeiro State (22◦40′to23◦00′S and 043◦00′to043◦18′W) (Figure 1). The bay has an area of
appro-ximately 384 km2including its several islands and presents a
co-astline of 131 km long and a mean water volume of1.87×109m3
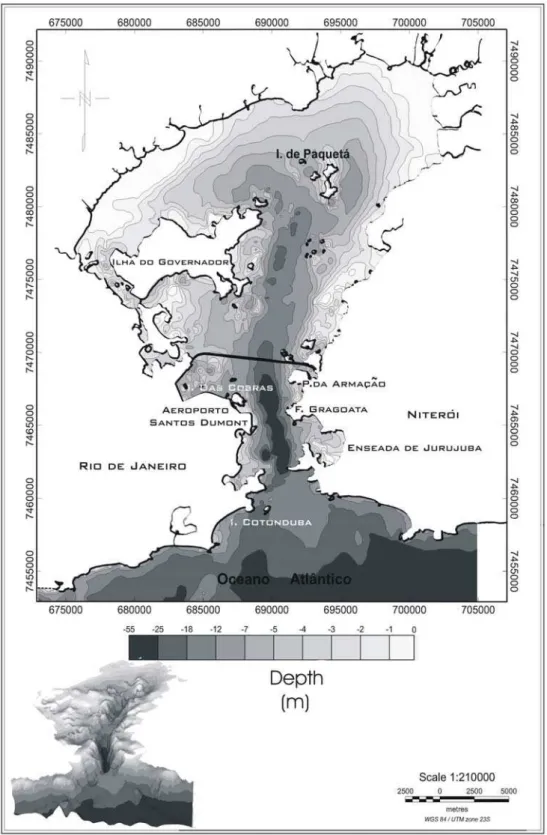
(Amador, 1980). It measures 28 km west to east and 30 km north to south, with a narrow entrance (1.6 km wide) (Kjerfve et al., 1997). Guanabara Bay shows a complex bathymetry with a re-latively flat central channel, 400 m wide, stretching from the bay’s mouth to more than 5 km into the bay more or less defined by of 30 m isobath. The deepest point of the channel is 58 m, near the bay’s entrance, towards the bay head, the channel becomes wide and shallow, averaging 5.7 m in water depth (Kjerfve et al., 1997) (Figure 2). The observed diminishing relief and present depth of the central channel is in part explained by sedimentation rates, which increases towards the bay interior, and was accelerated in
The area lies within the tropics of southeastern Brazil, but be-cause its coastal location, a humid sub-tropical climate prevails between December and April with 2,500 mm (high altitudes) and 1,500 mm (low land) of rainfall. The mean annual temperature is between 20 and25◦C (Nimer, 1989). The drainage basin has
an area of 4080 km2, consisting of 32 separate sub-watersheds
with 91 rivers and channels (Kjerfve et al., 1997). Only six rivers, however, are responsible for 85% of the total mean fresh water input, in the order of 100 m3s–1(JICA, 1994).
Nowadays, 11 million inhabitants live in the greater Rio de Janeiro metropolitan area, which is responsible for tons of untre-ated sewage directly discharged into the bay. Rio de Janeiro me-tropolitan area also includes the second largest Brazilian indus-trial region, with more than 12,000 industries dispersed along the Guanabara Bay drainage basin, accounting for 25% of the organic pollution released to the bay (FEEMA, 1990). Two oil refineries lo-cated along the bay’s shores are responsible for the processing of 7% of the national oil. At least 2,000 commercial ships dock in the port of Rio de Janeiro every year, making it the second largest harbour in Brazil. The bay is also the homeport to two naval ba-ses, a shipyard, and a large number of ferries, fishing boats and yachts (Kjerfve et al., 1997).
In the last 100 years the catchment area around Guanabara Bay has been strongly modified by human activities, in particular deforestation and uncontrolled settlement, which increased river flow velocities and sediment load and transport to the bay. Conse-quently the average rates of sedimentation increased to 1 to 2 cm year–1(Godoy et al., 1998).
METHODOLOGY
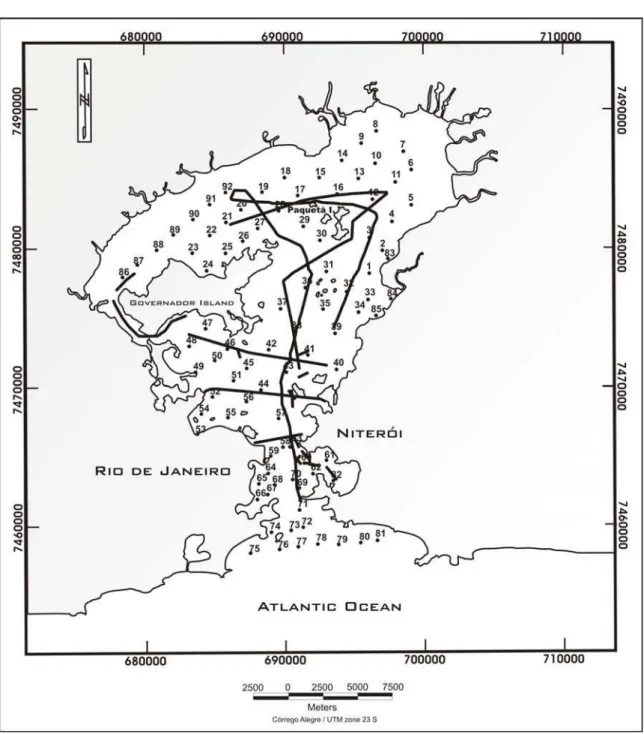
Surface sediments were collected in November 1999 with a van Veen grab sampler at 92 stations (Figure 3), providing an almost complete geographic coverage of the bay area. The exact posi-tion of each sample was recorded using a Global Posiposi-tion System (GPS). The geophysical equipment, RYTHEON RTT 1000A, ope-rates simultaneously in 200 kHz frequencies for the depth detec-tion, and 7.0 kHz for penetration through the sub-bottom. Grain size analysis of sediment samples was carried out using standard sieve techniques (for> 62µm, Wentworth scale) and pippete (< 62µm) after destruction of organic matter with H2O2. The
Figure 1– The location map of the studied area.
72
DISTINCTIVE SEDIMENTARY PROCESSES IN GUANABARA BAY – SE/BRAZIL, BASED ON THE ANALYSIS OF ECHO-CHARACTER (7.0 kHz)Figure 2– The bathymetric map of the Guanabara Bay.
Figure 3– The map with the position of the superficial samples and the seismic lines. Figura 3–Mapa com a posic¸˜ao das amostras superficiais e linhas s´ısmicas.
RESULTS AND DISCUSSION
Particle size and organic carbon content
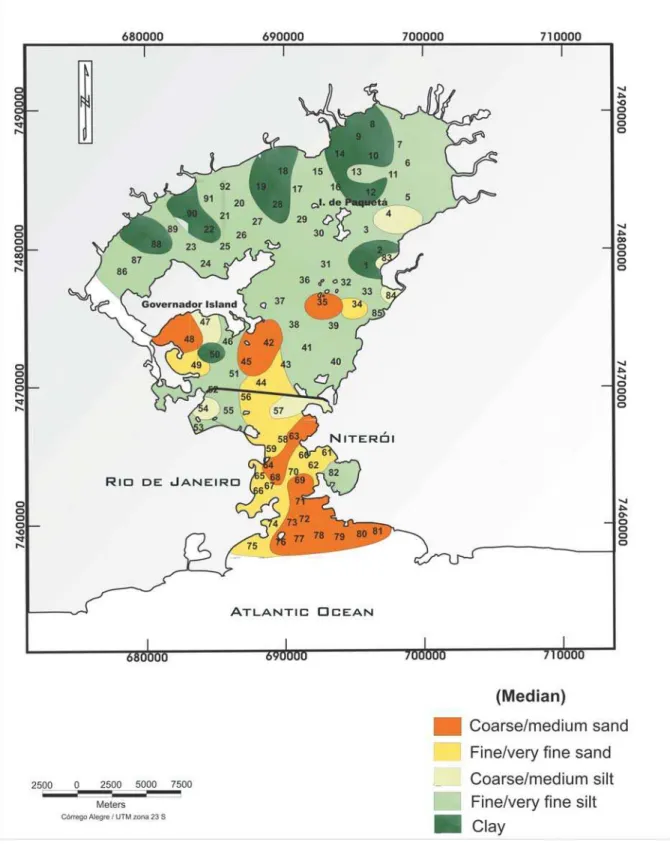
The grain size distribution reflects the tidal current energy near the bottom, which is directly influenced by bottom morphology and the Guanabara Bay shoreline contour. The bottom sediment of the bay ranges from clay to coarse sand (Figure 4), sedimentary
tex-tures can comprise from 0% to 100% of sand, 0% to 92% silt and 0% to 85% of clay. The samples from Guanabara Bay were classified into four principal groups: clay, sand, clayey silt and clay-silt-sandy, by it median.
74
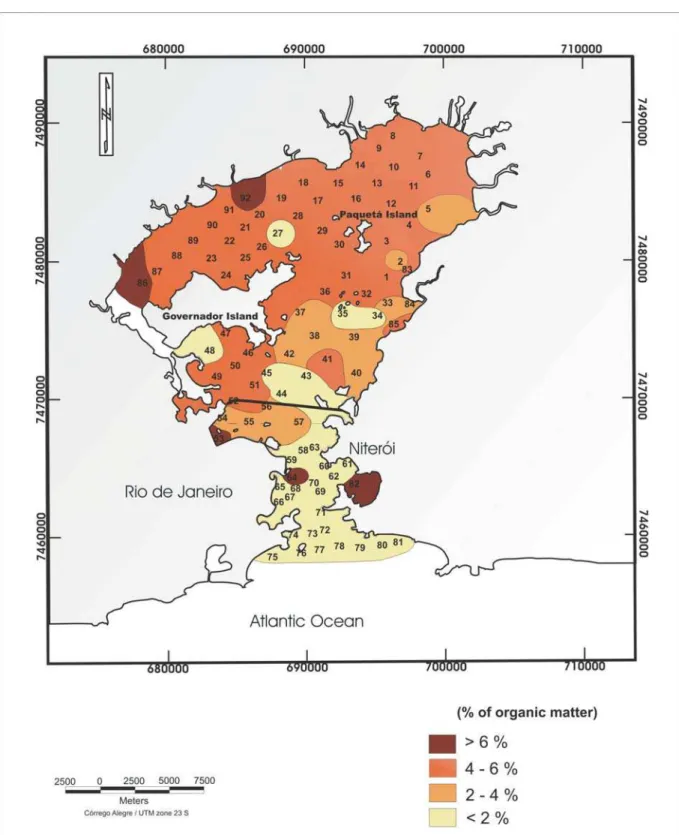
DISTINCTIVE SEDIMENTARY PROCESSES IN GUANABARA BAY – SE/BRAZIL, BASED ON THE ANALYSIS OF ECHO-CHARACTER (7.0 kHz)Figure 4– Map of particle size distribution of surface sediments from Guanabara Bay.
cording to Quaresma et al., (2000) and Kjerfve et al. (1997) these sandwaves occur along the eastern margin of the central channel between the 10 and 6 m isobaths between Morro do Morcego and Gragoat´a. These sand waves have heights of 0.5-2.5 m, lengths of 18-98 m, and decrease in both height and wavelength from the ocean into the bay in response to decreasing tidal energy. The sandwaves have steeper slopes facing the bay, indicating wave progression and bottom sand transport into Guanabara Bay. The sandwaves and their characteristics results from energetic ocean swells associated with meteorological frontal passages and the tidal flood-dominance of bottom current. From the alignment of Forte Gragoat´a and Aeroporto Santos Dumont, the bay experience a widening in the main channel, which reflects in the reduction of the currents speeds, making possible the deposition of the fine sediments in the both side of the channel, as clayed-silt and silt-clay. The north and the centre of the bay is also characterises by the presence of the muddy sediments. In the region most internal of the bay, after the Ilha do Governador (NW), observes the predo-minance of clay-silts, a sedimentation coarser than the NE in the same region, this probably occurs in function of that in this part of the bay the rivers that input in this area, are strongly impacted by the mans activities, therefore has a significant population density in this place. On the other hands, in the muddy sediments of the NE part of the bay predominates clays. Such sedimentation can be explained as product of the combination of a lower hydrodyna-mics in this area, and the presence of mangrove vegetation, which act as a trap, where only the finest sediment bypass to the bay.
Fine sediments of Guanabara Bay show high levels of orga-nic carbon (Figure 5) the higher value is 7.05%, which occurs in the NW side of the bay, and the lower value, less than 1% occur at the entrance and central part of the bay. According to Fulfaro & Ponc¸ano (1976), organic carbon is a very good indi-cator of bottom zone dynamics. Tucker (1991) suggested that in many depositional environments organic carbon is decomposed and destroyed at the sediment surface, but if the rate of organic productivities is high, the organic carbon can be preserved. The high concentration of organic carbon in the bottom sediments in the internal part of Guanabara Bay, are associated with the bottom morphology, the particle size of the sediments, the restricted water circulation in the internal areas and mainly related with the high productivities as well as great amounts of untreated sewage dis-charge in the bay. According to Carreira et al. (2002), the bay is amongst the most productive marine ecosystems with an average net primary production (NPP) of 0.17mol cm–2day–1(Rebello et
al., 1988). According to the same authors the high productivity
temperature throughout the year and by an estimated annual in-put of3.2×109mol P and6.2×1010mol N (Wagener, 1995)
derived mainly from untreated sewage discharge.
Classification of Echo types (7.0 kHz)
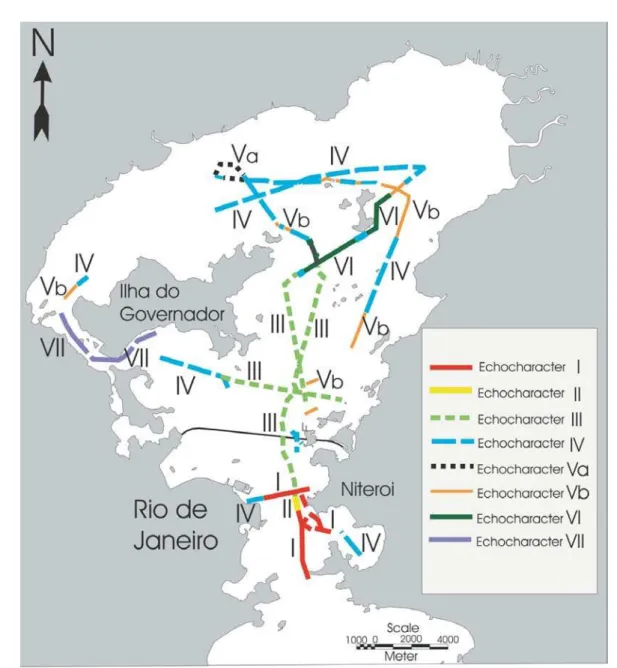
Echo types were classified mainly on the basis of the acoustic character and micro topography of the bay bottom. Seven tinct echo-character types were identified and its nature and dis-tribution throughout the bay are shown on Figure 6. The echo-character are studied and classified following the classification of Baptista Neto et al. (1996) and Quaresma et al. (2000).
Echo character type I
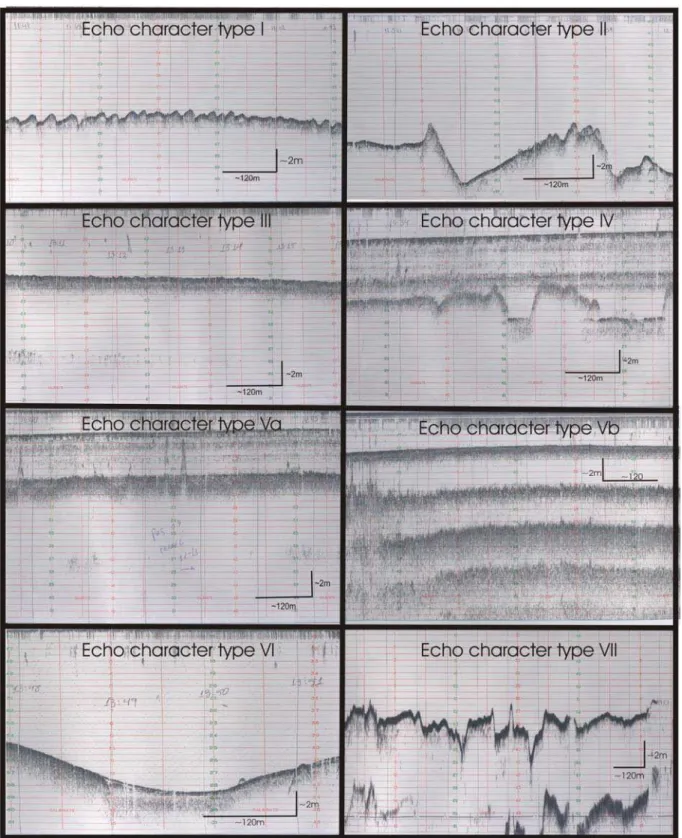
This type of echo is characterized by very sharp surface reflec-tor with no sub-bottom echoes (Figure 7), reflecting the domi-nance of superficial sands (Damuth and Hayes, 1977). This echo-character occurs at the entrance of the bay, where the sandwaves were observed (Figure 6). Quaresma et al. (2000) and Kjerfve et al. (1997) had already described the occurrence of these bed-forms at the bottom of the Guanabara Bay entrance. These authors suggested that the occurrence of such bedforms results from both very energetic ocean swell, which regularly enter the bay from the south-southwest during frontal passages, and the dominance of flood-directed tidal bottom currents. It is possible to observe the gradual reduction of the length and the height of the sandwaves towards the interior of the bay.
Echo character type II
Formed by large single or irregular overlapping hyperbolae with widely varying vertex elevations above the seafloor (Figure 7). Each hyperbolae generally show very strong surface echo and pro-longed sub-bottom echoes.
These large hyperbolic echoes are suggestive of basement highs or outcrops as was also suggested by Damuth (1980) and Lee et al. (2002). These echo types do not depend on the hydrody-namic conditions of the environment, being exclusively structu-rally controlled. It occurs mainly close to the islands and in the central channel of the bay as was already observed by Quaresma et al. (2000).
Echo character type III
76
DISTINCTIVE SEDIMENTARY PROCESSES IN GUANABARA BAY – SE/BRAZIL, BASED ON THE ANALYSIS OF ECHO-CHARACTER (7.0 kHz)Figure 5– Map of the organic carbon content (%) distribution in Guanabara Bay surface sediments.
Figure 6– Map of the Echocaracter (7.0 kHz) distribution in the Guanabara Bay.
Figura 6–Mapa de distribuic¸˜ao de ecocarater (7.0 kHz) na Ba´ıa de Guanabara.
reflectors. This type of echo occurs preferentially in the central channel of the bay (Figure 7), also appearing, perpendicular to this, indicating a transitional zone between coarse and fine sedi-ments. This echo character occurs mainly in the areas of coarse to median sands. The local strangulation or a canalization of the flow due to the bathymetric characteristics is generally responsi-ble for the occurrence of the ripple marks, this bedforms occur in a transitional zone between the areas affected by marine proces-ses and the areas affected by fluvial sedimentation (Kjerfve et al., 1997; Quaresma et al., 2000).
Echo character type IV
78
DISTINCTIVE SEDIMENTARY PROCESSES IN GUANABARA BAY – SE/BRAZIL, BASED ON THE ANALYSIS OF ECHO-CHARACTER (7.0 kHz)Figure 7– The different types of echocaracter observed in Guanabara Bay.
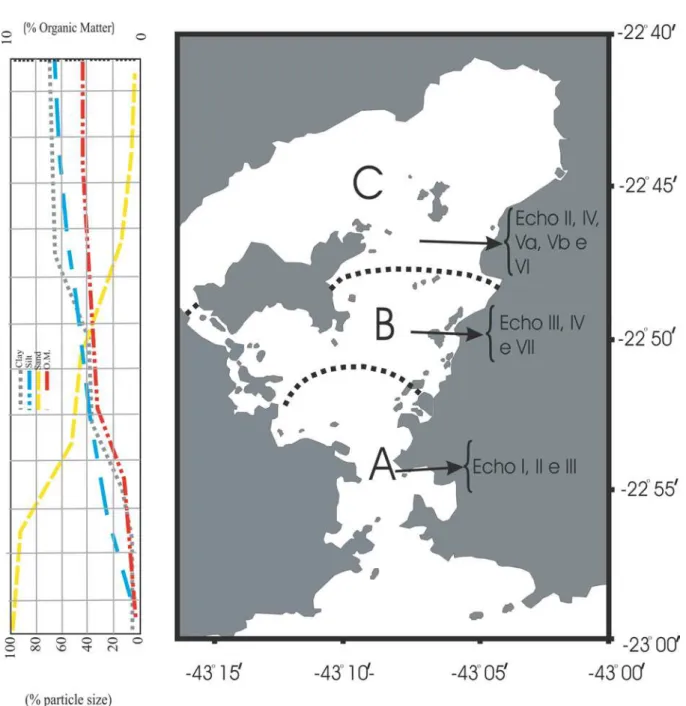
Figure 8– The syntheses map of all data analyzed. Figura 8–Mapa s´ıntese de todos os dados analisados.
Echo character type V
Echo character type V is associated with the presence of shallow gas within the sediments appearing as two distinct types named Va and Vb (Figure 7). Floodgate & Judd (1992) discuss on the origin of gas in flat areas, attributing two forms of gas origin: ther-mogenic and biogenic. The therther-mogenic origin requires gradients of pressure and temperature whereas the biogenic gas is formed by the reduction of organic matter by anaerobic bacteria
activi-ties, being methane (CH4) the most common gas. The latter
ori-gin is probably due to the main source for the gas encountered in Guanabara Bay, considering the elevated content of organic mat-ter available for bacmat-terial reduction especially within the bottom sediments of the bay’s interior.
80
DISTINCTIVE SEDIMENTARY PROCESSES IN GUANABARA BAY – SE/BRAZIL, BASED ON THE ANALYSIS OF ECHO-CHARACTER (7.0 kHz)Hovland (1992) and Costa & Figueiredo Jr (1998) elsewhere and by Oliveira (2000) in Guanabara Bay, near the Paqueta Island. Echo-character type Vb (Figure 7) presents a series of multi-ple bottom-parallel subsurface reflectors as observed by Baptista Neto et al. (1996) in Jurujuba Sound.
Echo-character type V occurs in areas of low hydrodynamic conditions within the bay, where clay and silt sediments with high concentrations of organic matter are found (Figure 6).
Echo character type VI
Echo type VI is characterized by truncation of reflectors and sligh-tly wrinkled surface (Figure 7), representing conditions of ero-sion or non-deposition of sediments in areas affected by bottom-currents. This echo type occurs on the northern extremity of the central channel, to the east of Paqueta Island. Based on the current information collected by JICA (1994), Oliveira (1996) and Ama-dor (1997) suggest that tidal currents are capable to erode and impede deposition of fine-grained sediments in this area.
Echo character type VII
Echo-character type VII is characterized by irregular and wrinkled bottom surface (Figure 7), It may represent dredging in the chan-nel area between Governador Island and Ramos Beach. Dredging of access channels and port areas is a very usual activity in Guana-bara Bay aiming to maintain the navigability in spite of the extreme sedimentation rates estimated to be as high as 100 cm/century in some areas by Amador (1997).
SUMMARY OF ECHO-CHARACTER DISTRIBUTION AND SEDIMENTARY PROCESSES IN GUANABARA BAY
The main characteristics of the echo-character found in Guana-bara Bay are synthesized on Table 1. Based on the main types of echo-characters in association with the bottom sediments and with the main hydrodynamic compartments of Guanabara Bay, it is possible to recognize three distinct regions reflecting the domi-nant sedimentary processes within the bay. These regions reflect the decreasing marine and tidal influence towards the bay’s inte-rior (Figure 8).
Near the entrance, the dominance of the tidal energy, conjuga-ted with the waves results on the predominance of sand deposits, highly reflective with characteristic sandwave bedforms. A transi-tion zone in the upper part of the central channel presents a
mix-tidal current velocities. The acoustically transparent, flat and pre-dominantly muddy bottom of the bay’s interior is dominated by sediment settling reflecting the low energy environment, where fine clastic particles are deposited with fine particulate organic matter. In these low energy areas where conditions for bacterial degradation of organic matter occurs, shallow gas can be formed, obliterating the penetration of the acoustic waves, and generating characteristic echo types presenting acoustic blanket and multiple bottom reflectors.
CONCLUSIONS
The association between the geophysical and sedimentological data is a very useful tool to understand the hydrodynamic condi-tions of the Guanabara Bay bottom.
The grain-size distribution reflects the tidal current energy near the bottom, which is directly influenced by the bottom morphology and the Guanabara Bay shoreline contour.
The geophysical data analyses revealed a strong relationship with the sediments permitting the distinction of seven types of character distributed within Guanabara Bay. These echo-character types are useful to discriminate the higher energy areas, dominated by sand deposits on the entrance of the bay and on the central channel, from the lower energy regions located on the interior of the bay, covered by silts and clays. The presence of bi-ogenic gas within the bottom sediments was also detected by the echo-character type, in areas of organic-rich mud deposits loca-ted on the interior of the bay.
The recognition of the different hydrodynamic compartments of Guanabara Bay, as reflected by the sediment distribution and echo-character types can be used as subsidiary information to the diagnostic of the environmental quality and de-pollution pro-grams, helping to identify areas of deposition of fine sediments which usually tend to accumulate pollutants and areas of erosion, sediment by-pass or non-deposition which normally are less im-pacted by pollution.
ACKNOWLEDGEMENTS
Departa-Echo type Sediment Description Forms of bottom
and subbottom Processes
Local and depth of
occurrence Profile
Type I Predominantly
sandy
Strong bottom reflectors, absence of subbottom
reflectors
Sandwaves
Transport by current near the
bottom
Entrance of the bay, with an average depth
of 20m
Type II — Basement highs or
outcrops Irregular bottom
Structural and lithological control Varied Type III Transitional zone between coarse and fine sediment
Strong reflection, absence of subbottom
reflectors
Flat bottom with little ripple marks
Transport by current near the
bottom
Between Paquetá Island and the Bridge,
between the depth of 10 to 20m.
Type IV Predominantly
muddy
Strong prolonged surface echo, with the presence of internal reflectors and the acoustic basement
Flat bottom with the presence of the acoustic basement –
sugarloaf type
Calm sedimentation
Inner part of the Bay, in the protected and calm condition, depth
average of 5 to 10m.
Muddy Transparent subbottom reflector with evidence of
gas escape
A plain bottom surface with acoustic blanket
in the subbottom
Sedimentation by vertical aggradation
The inner part of the bay, with depth between 1 to 5 m.
Muddy
Bottom-multiple reflection with a blurred
aspect, without strong contrast suggesting the
presence of gas
A plain bottom surface, with the presence of a
plain-parallel subbotom
Sedimentation by vertical aggradation
Predominantly in the NE of the Bay, close to
the coast
Muddy Truncations of subbottom reflection
A plain bottom in the form of channel, with a surface slightly
wrinkled
Erosion by bottom current
Between Governador and Paqueta Islands, with depth between 10
to 20m
Sandy
Strong reflection of a irregular and wrinkled bottom surface suggesting dredging
Extremely irregular and wrinkled bottom
surface
Artificial mechanical
dredging
Between Governador Island and The continent, with depth
between 1 to 5m.
REFERENCES
AMADOR ES. 1980. Assoreamento da Ba´ıa de Guanabara – taxas de sedimentac¸˜ao. Anais da Academia Brasileira de Ciˆencias. 52(4): 723– 742.
AMADOR ES. 1997. Ba´ıa de Guanabara e ecossistemas perif´ericos – Ho-mem e Natureza. Rio de Janeiro, Retroarte Gr´afica e Editora. 539 p.
BAPTISTA NETO JA, SILVA MAM & FIGUEIREDO Jr AG. 1996. S´ısmica de alta frequˆencia e o padr˜ao de distribuic¸˜ao de sedimentos na Ense-ada de Jurujuba (Ba´ıa de Guanabara) – RJ/Brasil. Revista Brasileira de Geof´ısica, 14(1): 51–58.
82
DISTINCTIVE SEDIMENTARY PROCESSES IN GUANABARA BAY – SE/BRAZIL, BASED ON THE ANALYSIS OF ECHO-CHARACTER (7.0 kHz)a fertilized tropical estuary, Guanabara Bay, Brazil: an elemental, isotopic and molecular marker approach. Marine Chemistry, 79: 207–227.
COSTA EA & FIGUEIREDO JR AG. 1998. Echo-character and sedimentary processes on the Amazon Continental Shelf. Anais da Academia Brasi-leira de Ciˆencias. 70(2): 187–200.
DAMUTH JR. 1975. Echo-character of the western Equatorial Atlantic floor and its relationship to the disposal and distribution of terrigenous sediments. Marine Geology, 18: 17–45.
DAMUTH JR. 1980. Use of high-frequency (3.5 – 12 kHz) echograms in the study of near-bottom sedimentation processes in the deep-sea: a review. Marine Geology, 38: 51–75.
DAMUTH JR & HAYES DE. 1977. Echo-character of the east Brazilian continental margin and its relationship to sedimentary processes. Ma-rine Geology, 24: 73–95.
DOWDESWELL JA, KENYON NH & LABERG JJ. 1997. The glacier – in-fluenced Scoresby Sund Fan, East Greenland continental margin: evi-dence from GLORIA and 3.5 kHz records. Marine Geology, 143: 207– 221.
EMBLEY RW. 1976. New evidence for occurrence of debris flow deposits in the deep sea. Geology, 4: 371–374.
FEEMA. 1990. Projeto de recuperac¸˜ao gradual da Ba´ıa de Guanabara, Vol. 1. Fundac¸˜ao Estadual de Engenharia do Meio Ambiente, Rio de Janeiro, RJ, Brazil, 203 pp.
FLOOD RD. 1980. Deep sea sedimentary morphology: modelling and interpretation of echo-sounding profiles. Marine Geology, 38: 77–92.
FLOODGATE GD & JUDD AG. 1992. The origins of shallow gas. Conti-nental Shelf Research. 12(10): 1145–1156.
FULFARO VJ & PONC¸ANO WL. (1976). Sedimentac¸˜ao atual do Estu´ario e Ba´ıa de Santos. Um modelo Geol´ogico aplicado a projetos de expanc¸˜ao da Zona Portu´aria. Anais1◦Congresso Brasileiro de Geologia de
Enge-nharia. 2: 67.
GARCIA-GARCIA A, VILAS F & GARCIA-GIL S. 1999. A seeping sea-floor in Ria environment: Ria de Vigo (Spain). Environment Geology. 38(4): 296–300.
GODOY JM, MOREIRA I, BRAGANC¸A MJ, WANDERLEY C & MENDES LB. 1998. A study of Guanabara Bay sedimentation rates. Journal of Radioanalytical and Nuclear Chemistry, 227(1-2): 157–160.
HOLLISTER CD & HEEZEN BC. 1972. Geologic effects of ocean botton currents: western North Atlantic. In: A.L. Gordon (Editor), studies in Phy-sical Oceanography. Gordon and Breach, London, 37–66 pp.
HONG E & CHEN IS. 2000. Echo character and sedimentary processes along a rifting continental margin, northeast of Taiwan. Continental Shelf Research. 20: 599–617.
JACOBI RD & HAYES DE. 1992. Northwest African Continental rise:
data. In: Poag C.W. & de Graciansky P.C. (eds), Geologic Evolution of Atlantic Continental Rises. Reinhold, New York, pp. 293–326.
JICA. 1994. The study on recuperation of the Guanabara Bay ecosystem, 8 volumes. Japan International Cooperation Agency. Kokusai Kogyo Co., Ltd., Tokyo.
JUDD AG & HOVLAND M. 1992. The evidence of shallow gas in marine sediments. Continental Shelf Research. 12(10): 1081–1095.
KJERFVE B, RIBEIRO CA, DIAS GTM, FILIPPO A & QUARESMA VS. 1997. Oceanographic characteristics of an impacted coastal bay: Ba´ıa de Guanabara, Rio de Janeiro, Brazil. Continental Shelf Research 17(13): 1609–1643.
KJERFVE B, LACERDA LD & DIAS GTM. 2000. Ba´ıa de Guanabara, Rio de Janeiro, Brazil. In: U. Seelinger & Kjerfve B. Coastal Marine Ecosystems of Latin America, Ecological Studies, 144: 107–115.
LEE SH, CHOUGH SK, BACK GG & KIM YB. 2002, Chirp (2-7kHz) echo characters of the South Korea Plateau, East Sea: styles of mass movement and sediment gravity flow. Marine Geology. 3042: 1–21.
NIMER E. 1989. Climatologia do Brasil. Rio de Janeiro: Instituto Brasi-leiro de Geografia e Estat´ıstica (IBGE).
OLIVEIRA LV. 2000. Assoreamento na Ilha de Paquet´a. Dissertac¸˜ao de Mestrado. Departamento de Geologia. Universidade Federal Fluminense, Niter´oi-RJ. 41 p.
OLIVEIRA MAC. 1996, Utilizac¸˜ao de documentos cartogr´aficos na avaliac¸˜ao de processos de sedimentac¸˜ao em ambientes estuarinos – Um estudo de caso na Ba´ıa de Guanabara (RJ-Brasil), Programa de P´os-Graduac¸˜ao em Geografia, Instituto de Geociˆencias, UFRJ, Dissertac¸˜ao de Mestrado, 124 p.
QUARESMA VS, DIAS GTM & BAPTISTA NETO JA. 2000. Caracterizac¸˜ao da ocorrˆencia de padr˜oes de sonar de varredura lateral e s´ısmica de alta frequˆencia (3,5 e 7,0 kHz) na porc¸˜ao sul da Ba´ıa de Guanabara – RJ. Revista Brasileira de Geof´ısica, Rio de Janeiro, 18(2): 201–214.
REBELLO AL, PONCIANO CR & MELGES LH. 1988. Avaliac¸˜ao da Pro-dutividade Prim´aria e da Disponibilidade de Nutrientes na Ba´ıa de Gua-nabara. Anais da Academia Brasileira de Ciˆencias. 60(4): 419–430.
REDDY DR & RAO TS. 1997. Echo characters of the continental margin, western Bay of Bengal, India. Marine Geology, 140: 201–217.
TUCKER ME. 1991. Sedimentary/Petrology: An introduction to the origin of sedimentary rocks.2a ed. London Blackwell. Scientific Publication. 260 p.
WAGENER ALR. 1995. Burial of organic carbon in estuarine zones – esti-mates for Guanaraba Bay, Rio de Janeiro. Qu´ımica Nova 18(6): 534–535.
Cel-Leonardo Fernandes de Catanzarograduated in Oceanography at Universidade Estadual do Rio de Janeiro, UERJ in 1999. M.Sc. in Marine Geology and Geophysics at the Marine Geology Laboratory (LAGEMAR) of Universidade Federal Fluminense, obtained in 2003. Currently is working as a free-lancer oceanographer in Denmark.
Jos´e Antˆonio Baptista Netograduated in Geography at Universidade Federal Fluminense, in 1989. M.Sc. in Marine Geology and Geophysics obtained in 1993 at Universidade Federal Fluminense, and PhD in GeoSciences obtained at the Queen´s University of Belfast – Northern Ireland/UK in 1996. Professor at the Geography Department of Universidade Estadual do Rio de Janeiro (FFP), since 1999. Associate professor at the Geology Department of Universidade Federal Fluminense since 1996 and Research Scholar of CNPq since 2002.
Mauricio de Sousa Dias Guimar˜aesgraduated in Oceanography at Universidade Estadual do Rio de Janeiro, UERJ, in 2002. M.Sc. student at the Marine Geology and Geophysics Graduate Program at Universidade Federal Fluminense, UFF, working in coastal geomorphology. Currently working as a geophysicist at C&C Technologies do Brasil.