A Work Project, presented as part of the requirements for the Award of a Master Degree in Management from the NOVA – School of Business and Economics
PME.BOX
–
Internationalization to Brazil
Augusto Maria Mota Gomes Henriques da Silva
Number 604
A Project carried out on the Field Lab in Entrepreneurial Innovative
Ventures, under the supervision of:
Professor Filipe Pamplona de Castro Soeiro
2 INDEX
EXECTIVE SUMMARY ... 2
1. INTRODUCTION AND BUSINESS DESCRIPTION ... 4
1.1Historic Background / Business Idea ... 4
1.2 Team ... 4
1.3 Opportunity ... 5
1.4 Vision ... 6
1.5 Mission ... 6
1.6 Strategic Objectives ... 6
1.7 Products & Service Offering ... 7
2- BUSINESS MODEL ... 8
2.1 Competitive Advantage ... 8
2.2 VALUE PREPOSITION ... 9
2.2.1 Target Segment ... 9
2.2.2 Revenue Model ... 9
2.3 OPERATING MODEL ... 10
2.3.1 Value Chain ... 10
2.3.2 Cost Model ... 10
2.3.3 Organization Structure ... 11
3. ENVIRONMENTAL CONTEXT ... 11
3.1 Market Analysis ... 11
3.2 Market Dimension ... 12
3.2.1 Size... 12
3.2.2 Value ... 13
3.2.3 Growth ... 13
3.3 Key drivers ... 13
4. Market specifics ... 14
4.1Market Needs ... 14
4.2 Market segmentation ... 14
4.3 Industry Mapping ... 14
4.4 Porter’s Five Forces Analysis ... 15
4.5 Competitive Assessment ... 16
4.6 SWOT & TOWS Analysis: ... 17
5. Marketing and Sales Strategy ... 18
5.1 Marketing Mix ... 18
5.1.1 Product ... 18
5.1.2 Price... 18
5.1.3 Place ... 18
5.1.4 Promotion ... 19
5.2 Sales Strategy ... 19
5.3 Products & Services Positioning ... 20
6. MANAGEMENT STRUCTURE ... 20
7. RISK ANALYSIS ... 21
8. IMPLEMENTATION PLAN ... 22
9. MODE OF ENTRY & Collaborative Arrangements ... 22
10. FINANCIAL ANALYSIS ... 23
11. CONCLUSIONS / RECOMMENDATIONS ... 25
12. BIBLIOGRAPHY ... 26
3 EXECTIVE SUMMARY
This Work Project is a Business Plan that describes the internalization process of PME.BOX to Brazil, with special focus in São Paulo region.
PME.BOX is an IT start-up that was set up at 2010 and is located in Costa de
Caparica, more precisely in Madan Park (Incubation Park). The company’s main
product uses high technology business intelligent software called pme.box, which offers several features (touch screen, web-based, pay-per use principle) to the clients. Pme box is a low cost software directed for SMEs. Therefore, the software was designed for several areas, such as: Management, Marketing and Internet; which allow start-ups to carry out their daily tasks with a single software. Despite SMEs lack of financial resources, they represent 99% of the Brazilian market, a country that has an expected GDP growth of 3.5% in 2011 and 20121. Consequently, this country represents a great opportunity to a software like pme.box.
Brazil is a growing market and at the same time a competitive one. Hence, PME.BOX should enter through a Joint Venture, where the other party is responsible for the
Initial Investment (0.5 million €). PME.BOX will be responsible for providing the
software’s technology (development, testing, updates, customization, extra services).
Additional to the Joint Venture, PME.BOX will have to look for Partnerships with large companies in key channels (Banking, Insurance, Hardware and Consultancy), in order to help the distribution and selling the product. This will be particularly crucial in the first years, to help the company growing faster, gain brand awareness and take advantage of time-to-market, with the strategic objective of reaching 1% of market share. Finally, with this entry, PME.BOX is expecting to reach an NPV=29,712,250€; a ROE=79.5% and a Break Even Point=494,590€, giving these analytical KPIs, it is
clear how successful and rewarding this entry in Brazil could be.
Keywords: PME.BOX; Software; Internationalization; Brazil; SMEs; Partnerships
4 1. INTRODUCTION AND BUSINESS DESCRIPTION
1.1Historic Background / Business Idea
PME.BOX Holding is a Portuguese start up that operates in the IT market and it was founded in 2010 by an entrepreneurial team, headed by José Carlos Graça. The firm is located in Costa de Caparica, inserted in a Technology Incubation Park called Madan Parque. PME.BOX Holding belongs to Buglos, a group that has several firms and important partnerships (HP; Banco Popular; IAPMEI; PT).
PME.BOX’s main product is pme.box, a business management software, which will
be explained in more detail in section 1.7 Products&Services Offering. Pme.box software is targeted to micro/small and medium enterprises with 1-100 employees. This segment is growing due to economic crisis (nowadays represent 95-99% of each
country’s companies), and those companies have some specific problems in terms of
management software, so it is a potential opportunity to PME.BOX.
The firm has as main objective the internationalization in order to take advantage of the time-to-market. PME.BOX is already present in India, where the R&D is located, and it expects to expand to Brazil in 2012 and to Spain and Poland in 2014.
1.2 Team
5
entrepreneur with a lot of experience in sales, meaning an increase of quality of bargaining knowledge to the company. Personally he was several times national show jumping champion (horses), so he can be an added value in terms of winning culture for the company; and COO - Bruno Judas Nunes – An entrepreneur with experience in web-based management applications, supporting the company in the field of operations management. Before that, he was business partner at Imporvete (1997), at Simbolo Perfeito (2009) and at Segurança e Prevenção. Based on his experience, he is able to make a difference and provide competitive advantage to PME.BOX.
1.3 Opportunity
As widely known, the world is in an international crisis (except for some countries), with hard access to credit and lack of financial resources. So enterprises have to know where and how to invest in the market. José Carlos Graça (PME.BOX CEO) as the entrepreneur that he is, knows that he had to expand his business to a growing market, in order to acquire strong partnerships, create brand awareness and disseminate his product. Therefore, he chose Brazil. Why Brazil? For several reasons: 1) The Brazilian Economy is currently the seventh largest economy in the world according to the latest projection of the International Monetary Fund and has one of the best internal markets2;2)Brazilian Start Ups tend to grow 3 to 6 % in excess each year for the next six years; 3) The Brazilian GDP is expected to grow between 3% and 4% in 2011 and in 2012; 4) SME’s, the potential customers of PME.BOX, represent 25% of the GDP and account for 14 million jobs, representing 60% of formal employment in the country. They also constitute 99% of the 6 million existing formal institutions3; 5) In Brazil we have approximately 10 million informal institutions, which are expected
2
6
to be converted into formal institutions starting gradually the following years; 6) High rate of Broadband Internet access in Brazil, more specifically in São Paulo.
The opportunity also arose due to the evolution of the IT market, an unexplored tool that nowadays is becoming indispensable – Mobility – where there are no barriers to circulate, so people can be anywhere at any time doing their tasks with any device with access to internet. This option of mobility is not anymore a luxury, but a mandatory feature to improve the work devices. PME.BOX has also two other aspects that represent competitive advantages: Availability and Time Optimization – PME.BOX guarantees these advantages through its software, which is very user friendly, efficient and quick, making life easier to the users. Additionally, another opportunity that PME.BOX can enjoy is the Software as a Service trend, which means more companies will use products like Pme.box software4.
1.4 Vision
PME.BOX aims to be in the top 10 in Business Management Software in Brazil, in the next three years, which will help to be in the worldwide top market in 2020.
1.5 Mission
PME.BOX offers a fully new software, that gives mobility and high technology to micro, small and medium companies in order to provide efficiency and quickness to manage their business information.
1.6 Strategic Objectives
PME.BOX hasas main goal growth in a worldwide dimension, and in order to do that the company has a tremendous advantage: Time-to-market which allows the company to create business critical mass, brand awareness and avoid competition. However, growth in a global scale is not easy, so PME.BOX has to do Partnerships with local companies that have financial power and knowledge about the local market in order to
4
7
launch the brand, expand it and to deal with market demand – These Partnerships will reduce market barriers, providing access to market and help to create brand awareness. To make this expansion sustainable, the product will be the same in all countries and the financial partner just has to invest in Sales and Marketing to guarantee that the product is commercialized, because the product, as well as its technological upgrade, is already done by PME.BOX. The company’s internationalization policy consists of: 1) reaching the Brazilian Market in 2012; 2) Spanish and Polish markets in 2014; and 3) getting a market share in each market of 1%. Those markets will be reached through joint ventures with local companies. The scope of this Business Plan is the market entry in Brazil.
1.7 Products & Service Offering
Pme Box, What is it?5 It is a business management software with several new
features that can help micro/small and medium enterprises in their day-to-day activities and needs. It is a fully service, which enjoys the particularity of being web based, does not need previous installation, and also has a touch screen feature, meaning that the software can be managed from anywhere with any kind of device (computers, iPads, tablets, smartphones, iPhones) as long as it has Internet access. Pme Box, How to take it? Firstly, the customer has to acquire the licence number,
which is given without any payment; secondly the client has to register in the PME.BOX web site; and thirdly, the company puts its data into the software. After these three steps the client is able to use the product to its full capacity.
Pme Box, What it does? Once the licence is acquired, the customer has no user limit,
which can help the company to be sustainable in terms of growing. PME.BOX software provides services in three important areas: Management, Marketing and Internet. Management: Pme.box offers you a very complete management service,
8
such as: Enterprise Resource Planning (ERP); Resources Management; Stock Management; Documents management (articles, invoices, reports). Marketing: With Pme.Box software, the customer is able to manage: Unlimited business contacts; Customer Relationship Management (CRM); Telemarketing and Email Marketing.
Internet: This software gives the customer access to: E-commerce (shop online);
Unicre network; paypal principle; emails accounts; portals, among other benefits. The company also has other services besides the pme.box software, which include: training services, E-commerce, Websites, helpdesk and software customization. Concluding, the P&S offering reflects a major point of differentiation through Innovation as a source of competitive advantage.
2- BUSINESS MODEL6
2.1 Competitive Advantage
When a company expands its operations to another country, the unique way to be well succeeded is to have competitive advantage in some fields. There are Temporary Competitive Advantages and Sustainable Competitive Advantages. The first one is when the company can benefit from it during a while until being subject of copy; the second one is when the company can profit from it for a long period. Subsequently factors that can provide a competitive advantage and the VRIO framework table are explained: High Technology – Pme.box is a software which is in the top in terms of technology, and contains several advantages: Touch screen, Web-based, Cloud Computing; Fully product – Software that helps the company to manage several areas such as: Management, Marketing and Internet. This allows the company to use uniquely one software to cover all areas, which affects positively the efficiency and time optimization; Partnerships – Local Distributive Partners are the key for Pme.box sales, since they are responsible to deliver the software to the customers.
9
Investor partners are also very important because they are responsible for all the operations in the country (except technology); Competitive Price / Pay per use – Competitive Price represents high quality at low prices which is crucial to SMEs. They also can benefit from the conditions of payment from PME.BOX: the companies only pay the time that they use, on a per second basis.
Figure 1 – VRIO Framework
Hence, from this table, we can see that PME.BOX has two Temporary Competitive Advantages and also two Sustained Competitive Advantages, which means great possibilities to be successful in the Brazilian Market.
2.2 VALUE PREPOSITION
2.2.1 Target Segment
As was mentioned before, Pme.box software is directed to micro/small and medium companies with 1-100 employees, from all possible sectors and activities. Why this target? Because this software can provide mobility, light and flexible payment conditions, customization and it is very user friendly, which means the software can
satisfy SME’s needs. For better understanding check 4.1 Market Needs.
2.2.2 Revenue Model7
PME.BOX has 2 main sources of revenue: Licences represent 62%, which is associated to monthly fees and package of 100 hours; Services represent 38%, and are related to software customization, websites, training and e-commerce;
10 2.3 OPERATING MODEL
2.3.1 Value Chain
The company’s value chain has 5 primary activities supported by 3 secondary
activities. In the Primary Activities the firm has: Project Analysis & Evaluation; Software Development; Testing & Validation; Distribution & Sales and Customer Service. The three first ones belong to R&D activities and only represent 10% of the value chain, due to the fact that R&D is carried out by PME.BOX Holding at a
“discount price”; Customer Service corresponds to 10% representing several activities
(helpdesk, customization, among others); Distribution & Sales only represent 7,5%, due to the Partnerships that PME.BOX S.A Brazil will have in order to distribute the product. In the Secondary Activities there are 3 areas: Firm Infrastructure, Human Resources Management and Marketing. Firm Infrastructure is 10% due to the management of the company; Human Resources corresponds to 10%, represented especially by the recruitment process in order to have a competent team; and Marketing is the item that is most representative with 15% due to the importance to make the product known, so it is where the organization invests more. Summing up, the Profit Margin will be 42,5%, meaning a great profit for the company.
Figure 2 – Value Chain
2.3.2 Cost Model
11
represented by: commissions to agents or partners; marketing campaigns; recruitment; training and R&D – These costs are related to production and sales, if these factors are high, variable costs are also high. Fixed costs will represent approximately 66% and Variable Cost will represent 34% of the total. For a more detailed explanation please check 10. Financial Analysis.
2.3.3 Organization Structure
Regarding the Organization Structure, the system will be similar to the others PME.BOX (Portugal, India). The enterprise will be named PME.BOX S.A Brazil, 50% owned by PME.BOX Holding and the other 50% will be owned by an Investment Partner – it will be a Joint Venture. In terms of stakeholders, PME.BOX S.A Brazil will be linked to several entities that are very different from each other. For a more detailed description please check section 4.3 Industry Mapping.
3. ENVIRONMENTAL CONTEXT
3.1 Market Analysis
Brazil belongs to the BRIC countries and is nowadays in 7th place in the world economic ranking. With a population of 198.7 million and with 94% of employment8, Brazil is one of the most attractive markets in the world and Portuguese firms have special connections with the Brazilian Market according to the History of both countries.
The Brazilian market has a special phenomenon. According to SEBRAE, there are formal and informal companies, there are almost 16 million Brazilian companies but only 6 million fulfill the formal requirements, and the other 10 million are registered by individual name, which means that the informal enterprises do not need to have a management software and deal with some bureaucracy, because they use “green
8AICEP Portugal Global. 2011. “Brasil –
12 receipts”, but the Brazilian Government wants to end with this situation as soon as
possible, so the informal companies have to change to formal companies and need to start to have all the prerequisites and one of them is the use of management software, which is an huge opportunity to companies like PME.BOX.
In political terms, Brazil is for the first time led by a woman, Dilma Rousseff who was elected in 2010. Having the economy as a main focus, the Government is
correcting some “economic problems”, like inflation, through monetary and fiscal
policies. Another method that the Government has already used after reaching stability was the public investment, with a program named PAC (Growth Acceleration Program)9 in order to accelerate the economic growth. On the economic side, Brazil is considered the strongest economy of South America. According to SEBRAE the GDP is growing (3.5% in 2011 and 2012), the Brazilian Foreign Investment is 4,096,223,578.6€ - These factors were reached due to different factors: economic reforms; development of social policies; the international conditions that are extremely favorable and which benefit from the country’s natural resources in a more rational way. Socially, Brazilian people are progressively educated, proof of that is the increase of undergraduate students, which will represent more productivity to the country. Regarding the technological factors, Brazil has a high rate of broadband Internet access, represented by the number of internet hosts that is 19.316 million (2010) and by the number of internet users that is 75.982 million (2009), occupying the 4th and 5th respectively10.
3.2 Market Dimension
3.2.1 Size
As mentioned before, PME.BOX’s targets are micro, small and medium enterprises.
9AICEP. 2011. “Brasil –Ficha de Mercado (Maio 2011)” : 1 -33
13
This group represents 99% of the total Brazilian market, about 5,83 million existing formal institutions (in a total of 5,85 million companies), which means 14 million jobs and 60 % of formal employment11. SME’s also correspond to 99.8% of companies that are created every year.
3.2.2 Value
SMEs in Brazil represent 25% of the Gross Domestic Product (GDP), as the Brazilian
GDP in 2010 was 1.555 trillion €, so SMEs worth0.38875 trillion €. The estimation
for 2011 is approximately 1.606 trillion €, so the value of SMEs is 0.4015 trillion €12
. 3.2.3 Growth
According to SEBRAE, the expected growth of SMEs in 2012 and in 2013 will be 5% and in 2014 will be of 6%, which means an increase of market to PME.BOX.
3.3 Key drivers
These factors are the most important factors for an enterprise to be successful in the market13: Partnerships: Obtaining good partnerships is essential in two aspects: to open distributive channels and to obtain investment to enter in the market. Without these factors it is impossible to reach a good performance; Innovation: An IT Company has to have this subject always in mind, and always has to continue improving in order to gain a competitive advantage in its product; Brand awareness: It is fundamental to new companies, to acquire as soon as possible the recognition of its brand in the market; Customer support: In order to attain customer satisfaction and loyalty, the company has to support them constantly, promoting the software customization, training and helpdesk, among others. These factors will link the customers to the firm; Time-to-market: It is crucial for a company to enter in the market as soon as possible, to gain a competitive advantage and possibly to have the
11
SEBRAE. www.sebrae.com.br accessed on 10h September 2011 12
SEBRAE. www.sebrae.com.br accessed on 10th September 2011 13
14
benefits of first mover opportunity.
4. Market specifics
4.1Market Needs
When a market is almost only composed by SMEs, the firms that are dealing with them have to pay attention to several factors: Conditions of payment: give to SMEs more than one option and price flexibility, like PME.BOX that has 3 options; Mobility: Provide a web-based software to the clients allowing them to manage their company in any place with any device; User friendly software: SMEs nowadays want an efficient product but at the same time one that is easy to use; Customer Service: A constant support from the company that sells the software, like backups, training, chat, among others. These factors are important to create customer loyalty and brand awareness to the firm14.
4.2 Market segmentation
In Brazil, SMEs represent 99.8% of total number of firms, which is 5.83 million of a total of 5.8515 million of Brazilians companies – This means, that PME.BOX has to segment the market because it is impossible to establish its operations everywhere. The segmentation will be done in terms of states and not in terms of services sector, because PME.BOX software can operate in all different sectors, with the software customization application. So PME.BOX chose São Paulo as preferential market because this state represents 30.87% of Brazilian companies, which is 1.806 million16 of SMEs, not forgetting that São Paulo is considered the capital of Business in Brazil, so it is the right city for PME.BOX to start its operations.
4.3 Industry Mapping17
The main PME.BOX stakeholders are: 1) PME.BOX Holding: Sharing of
14
PME.BOX S.A Data – Interview with Dr.Carlos Graça about his business trip to Brazil in August of 2011 15
SEBRAE. www.sebrae.com.br accessed on 5th September 2011 16
SEBRAE. www.sebrae.com.br accessed on 5th September 2011
15
technology, knowledge and the respective CEO; 2) Potential Investors: Business Angels, Venture Capital in order to make Joint Venture or finance the move to the Brazilian Market; 3) Distributive Partnerships: Large companies in key channels will facilitate the distribution of Pme box, e.g.: OI; Vivo; HP; Stefanini and Bradesco;
4) Regulator Identities: These types of organizations affect PME.BOX’s activities
and business due to their laws and their bureaucracy. E.g.: Federal Revenue of Brazil; SEBRAE, Government; 5) Customers: Micro/Small and Medium companies (1-100 employees); 6) Competitors: Companies that belong to the IT market, which offer the same kind of products or substitute products to the PME.BOX target. E.g.: Cigam, AEDOS, Vitro and Netgera; 7) Suppliers: Outsourcing of accounting and solicitors, and supporting hardware to PME.BOX’s products; 8) Universities/Research Park Partners: Projects done by students of Universities and research conditions granted
by the Research Park. E.g.: NOVA School of Business and Economics, Universidade Nova de Ciências e Tecnologia and Madan Parque.
These stakeholders will affect directly PME.BOX’s Organization Structure and its environmental context, helping the firm entering the market and supporting
PME.BOX’s competitive advantages.
4.4 Porter’s Five Forces Analysis18
To gain better understanding of the Brazilian Market, Porter’s Five Forces Analysis will provide a good industry analysis, which will help PME.BOX to define its business strategy and be successful in such an attractive and competitive market like Brazil. Threat of New Entrants: High – 1) No patent from PME.BOX, which will allow to new companies copy the products; 2) Low level of bureaucracy when developing a product and entering the market; 3) huge market, which gives more opportunities to all companies. Buyers Power: Medium – The target customers,
16
SMEs with 1-100 employees, are price sensitive. Even though, SMEs (5,85 million, in
total) are geographically dispersed, which diminishes buyers’ bargaining power.
Threat of Substitutes: Medium/High – It is important to take into account as
substitutes the management software, which is not web-based. This type of software without web included is a product already implemented in the market and has
customers’ loyalty. However, the market is changing and requiring other aspects, such
as Cloud Computing and Software as a Service. These aspects give advantage to web-based software like PME.BOX19. Suppliers Power: Low – In the IT market, the suppliers have very low bargaining power, since the companies do everything in their own, so they do not need external help. PME.BOX S.A Brazil outsources with PME.BOX Holding, which is similar to making it inside the organization because the company belongs to the Holding. Industry Rivalry: High – Being such a huge market with continuous growth year after year, Brazil became a trendy market where there are a lot of competitors, each one trying to take opportunities from the market. Therefore, in order to be successful, enterprises have to fulfill the market needs following its key drivers. Hence, PME BOX has to provide a high level of customer service, be quick in the time-to-market and make good agreements with Partners. Doing these agreements, PME BOX eases its activity in terms of distribution channels and financial resources.
4.5 Competitive Assessment
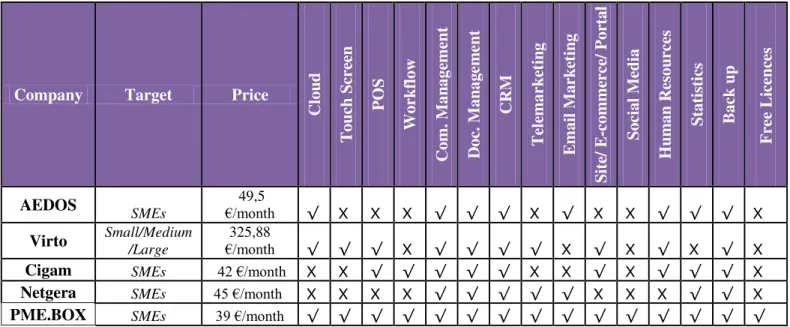
In the next table20, competitors and their main characteristics will be presented in order to help evaluating in which level of rivalry they are. The evaluation is based in 3 parameters: Price; the target; software features.
19
http://computerworld.uol.com.br/negocios/2010/12/03/erp-em-2011-as-10-tendencias-mais-importantes-do-ano/ accessed on 6th December 2011
17
Company Target Price
C loud T ouch S cr een POS Workf low C om . Man age m ent D oc. M anag em ent CRM T el em arke ti n g E m ai l Ma rke ti ng Sit e/ E -com m erc e/ Por ta l Soci a l M edi a H um an R es ou rc es Stat ist ic s B ack up Free Li ce nc es
AEDOS SMEs €/month 49,5 √
X X X √ √ √ X √ X X √ √ √ X
Virto Small/Medium/Large €/month325,88 √ √ √
X √ √ √ √ X √ X √ X √ X
Cigam SMEs 42 €/month X X √ √ √ √ √ X X √ X √ √ √ X
Netgera SMEs 45 €/month X X X X √ √ √ √ √ X X X √ √ X
PME.BOX SMEs 39 €/month √ √ √ √ √ √ √ √ √ √ √ √ √ √ √
Figure 3 – Competitive Assessment
As it is perceptible in this table, PME.BOX is the company that offers more valuable features and is also the more accessible one in terms of price, which is related with
company’s competitive advantages and product positioning.
4.6 SWOT & TOWS Analysis:
This type of analysis measures the Internal Factors and the External Factors (SWOT), but also gives recommendations (TOWS) for the company to improve, turning threats into opportunities and weaknesses into strengths:
18
With these recommendations, PME.BOX is able to face the future challenges and deal with possible obstacles, helping the company maintaining its competitive advantages.
5. Marketing and Sales Strategy
5.1 Marketing Mix
5.1.1 Product
PME.BOX software is a management solution that includes Marketing and Internet areas, under the pay-per-use principle. The product provides mobility to the customer, due to the touch screen application and for being web-based. For a more detailed description please check section 1.7. Product & Services Offering.
5.1.2 Price21
PME.BOX has 3 options of price: 1) pme.box free – which gives only the licence for free with 20 hours of training; 2) pme.box start up – A package of 100 hours, where 1
hour costs 0,49€; 3) pme.box eco 12 – Gives unlimited access to use the software
through a fix fee of 39€ per month.
5.1.3 Place
PME.BOX in terms of distribution has two options: either the products are directly sold by PME.BOX or through its partners. In both alternatives, the product can sold
through the company’s website. Additionally, and depending on the option chosen,
the product can be sold in the company’s office or in the partners’ stores. Moreover, PME.BOX wants to have one or two partners at maximum per channel. The company will choose channels that have big impact in SMEs such as: Telecommunications, Banking, Insurance, Hardware and IT Consultancy.
PME.BOX prefers the first alternative, because if the sale is consumed through its partners, the company has to give 10% of the sale’s value. However, these partners are quite important since they allow market penetration. This will be particularly
19
important in the initial years as PME.BOX is a new company in the market that still lacks power and brand awareness to sell a high number of licenses without partners.
5.1.4 Promotion
In order to promote its software, the organization will focus in two aspects: free marketing and paid marketing. The first option will be based in word-of-mouth (the most powerful technique in marketing) and on the Internet (social networks, ads in the
partners’ websites and chats). In the second alternative, the company will invest on
the presence in business fairs, meetings or forums where potential customers can be found. With these presences, the company will be able to give information about the product and demonstrate how the software works. Another way to promote the product is investing in advertising through media communication. This consists on ads in business newspapers focused on SMEs, and TV commercials in business channels.
5.2 Sales Strategy
With the purpose of gaining brand awareness and market share, PME.BOX will focus on distributing as many licenses as possible to its customers. As licenses are free and provide 20 hours of free use, if the customer likes the software he will want to continue using it. Therefore, the client has to choose between two paid options: a monthly fee or a package of 100 hours – PME.BOX revenues increase with the
customers’ usage.
Another tactic the company uses for sales is commission (10% of the product’s sale). The principle is the following: the more an agent/distributive partner sells the more he earns, and consequently more PME.BOX profits – Everybody gains with this
”snowball” approach. Specific business contract rules, sales goals and reporting have
20 5.3 Products & Services Positioning
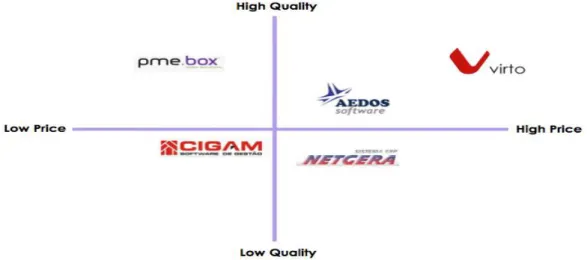
PME.BOX developed a user-friendly software with high technology which represents
the variable quality. Despite the software’s good quality, the product is sold at low
prices (comparing with its peers), which can create competitive advantage in terms of price/quality ratio. This positioning may seem hard to achieve and be profitable at the same time, especially for a small firm. However, it is a great strategy to create brand awareness and collect new customers in a new market like Brazil.
Figure 5 – Positioning Map
From this positioning map22, it is possible to conclude that PME.BOX has a high quality product but at the same time a low cost one, and comparing with its competitors it clearly has a competitive advantage in terms of price/quality.
6. MANAGEMENT STRUCTURE23
PME.BOX S.A Brazil will have 7 different areas, each with different responsibilities:
1) Board – responsible for the connection between PME.BOX S.A Brazil and
PME.BOX Holding. Additionally will be responsible for all operation in Brazil; 2) Management – responsible for the supervision of all areas, one person by area that will report directly to the board. 3) Sales – responsible for distribution channels,
22
21
certified partners and online stores. 4) Marketing – responsible for social media,
marketing’s campaigns and communication; 5) Training and Quality Assurance –
responsible for certification, training and control of certified partners quality and staff; 6) Contact Center – responsible for telemarketing and helpdesk; 7) Accounting
– responsible for invoicing and credit control.
To conclude, PME.BOX is a flat organization, which provides a quick response to the clients through its Board that is efficiently connected with the decision power, supporting the time-to-market as a strategic objective.
7. RISK ANALYSIS
The objective of this point is to assess the main risks that might be posed against
PME.BOX’s success. The company has a major factor, that it is the key for the
expansion – Partnerships. Without collaborative arrangements (distributive partners and investors), the company will have two main risks: commercial risk and financial risk.
Commercial Risk: Without distributive Partnerships, it is very difficult to put the
software available in the Brazilian market. PME.BOX’s Potential Partners have a
powerful position in their markets (key channels), which will facilitate the software’s distribution and its respective commercialization. Financial Risk: For a startup, like PME.BOX the expansion for another country is a huge opportunity, but only in a system such as joint venture, where the other party is responsible for the initial investment. Otherwise PME.BOX has no possibility to expand to another country because it lacks financial resources to invest.
PME.BOX has two other risks that can be caused by other reasons, without
Partnerships’ influence: technological risk and operational risk. Technological Risk:
22
its own product for constant improvement of pme.box, continue researching new technologies and solutions for the market and obtain patent registration in order to avoid software copying. Operational Risk: Brazilian market has 5,85 million companies, operating in different sectors, locations and with different sizes. This factor implies dealing with different associations, governments with dissimilar cultural backgrounds. So, PME.BOX has to adjust its operations through the Software Adaption in each place that the company operates.
8. IMPLEMENTATION PLAN
2012 Jul Aug Sep Oct Nov Dec
Business Plan Preposition (Presentation to Investors)
Identify Potential Investors Set Up the Office Equipment acquisition (Printers,
furniture…)
Software Adaptation to Brazilian market – (Translate for Portuguese from Brazil) Joint Venture Creation - PME.BOX S.A
Brazil
Recruitment Process
Training Process (staff for PME.BOX)
2013 Jan Feb Mar Apr May Jun Jul Aug Sep Oct Nov Dec
Establish partnerships with local companies in São Paulo
Start Software Commercialization (website, stores)
Establish Contact Centre (Helpdesk, Telemarketing)
Training for Clients (Lectures to how use the software)
Marketing Campaigns (fairs, outdoors, commercials,..)
Survey to measure clients satisfaction Partner’s Performance Review – Number
of sales
Figure 6 – Implementation Plan
9. MODE OF ENTRY & Collaborative Arrangements
23
requirements: 1) The other party will be responsible for the initial investment (0,5
million €); 2) PME.BOX Holding will be responsible for all software’s technology
(development, testing, updates, customization, extra services); 3) Each party will detain 50% of PME.BOX S.A Brazil but where PME.BOX Holding will have a veto right; 4) PME.BOX Holding will receive 10 % of the royalties of all sold licenses (no services included) payable on a quarterly basis in order to keep up with R&D.
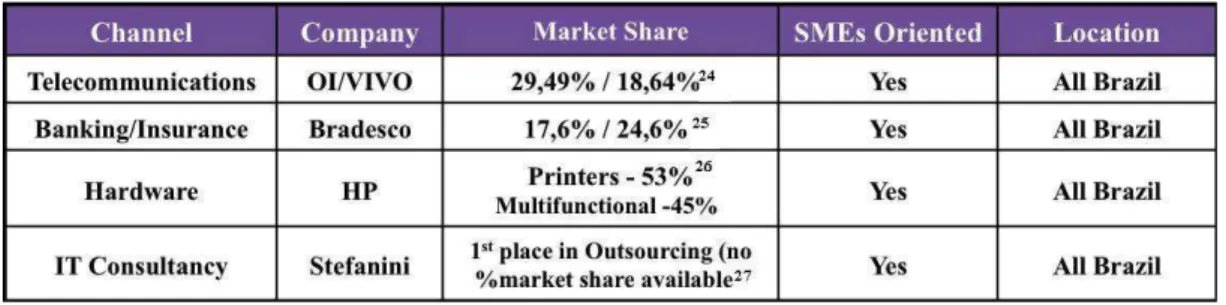
According Collaborative Arrangements, PME.BOX S.A Brazil aims at having Partners in several channels. To select the right partner, there is a general criterion: the size of the company (market share, brand awareness, profits); the geographic dispersion (in order to spread even more the product); the channel where it is inserted; and if the company is SMEs oriented. So, with this information provided, the next table shows24some potential partners that PME.BOX can have for the expansion:
Figure 7 – Collaborative Arrangements
The agreement with these partners will be the following: on each sale they make, they receive 10% of the respective value.
10. FINANCIAL ANALYSIS28
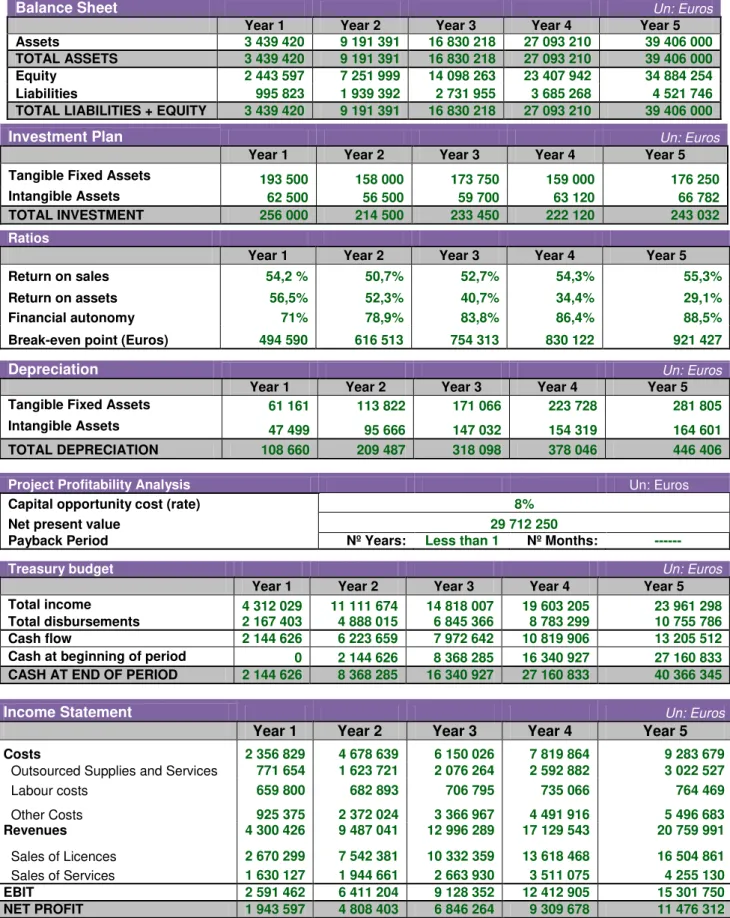
To evaluate this business plan, it is essential to take into account the financial model to perceive if the expansion is feasible and sustainable over the years:
24 Teleco. http://www.teleco.com.br/mshare.asp accessed on 5th November 2011
25 Bradesco - http://www.bradescori.b.br/site/conteudo/interna/default.aspx?secaoId=653&idiomaId=2 accessed on 5th November 2011
26
HP. http://www.hp.com/latam/br/pyme/novidades/aug_novidades_01.html accessed on 5thNovember 2011 27 Stefanini. http://www.stefanini.com/BR/Premios.html accessed on 5thNovember 2011
24
Figure 8 – Financial Data
In order to reach these values, PME.BOX had to do some assumptions, the most important were: 1) 1% of market share in the first year as was mentioned before in the vision; 2) A systematic increase of sales over the years, especially when PME.BOX
Balance Sheet Un: Euros
Year 1 Year 2 Year 3 Year 4 Year 5
Assets 3 439 420 9 191 391 16 830 218 27 093 210 39 406 000
TOTAL ASSETS 3 439 420 9 191 391 16 830 218 27 093 210 39 406 000
Equity 2 443 597 7 251 999 14 098 263 23 407 942 34 884 254
Liabilities 995 823 1 939 392 2 731 955 3 685 268 4 521 746
TOTAL LIABILITIES + EQUITY 3 439 420 9 191 391 16 830 218 27 093 210 39 406 000
Depreciation Un: Euros
Year 1 Year 2 Year 3 Year 4 Year 5
Tangible Fixed Assets 61 161 113 822 171 066 223 728 281 805
Intangible Assets 47 499 95 666 147 032 154 319 164 601
TOTAL DEPRECIATION 108 660 209 487 318 098 378 046 446 406
Ratios
Year 1 Year 2 Year 3 Year 4 Year 5
Return on sales 54,2 % 50,7% 52,7% 54,3% 55,3%
Return on assets 56,5% 52,3% 40,7% 34,4% 29,1%
Financial autonomy 71% 78,9% 83,8% 86,4% 88,5%
Break-even point (Euros) 494 590 616 513 754 313 830 122 921 427
Investment Plan Un: Euros
Year 1 Year 2 Year 3 Year 4 Year 5
Tangible Fixed Assets 193 500 158 000 173 750 159 000 176 250
Intangible Assets 62 500 56 500 59 700 63 120 66 782
TOTAL INVESTMENT 256 000 214 500 233 450 222 120 243 032
Project Profitability Analysis Un: Euros
Capital opportunity cost (rate) 8%
Net present value 29 712 250
Payback Period Nº Years: Less than 1 Nº Months: ---
Treasury budget Un: Euros
Year 1 Year 2 Year 3 Year 4 Year 5
Total income 4 312 029 11 111 674 14 818 007 19 603 205 23 961 298
Total disbursements 2 167 403 4 888 015 6 845 366 8 783 299 10 755 786
Cash flow 2 144 626 6 223 659 7 972 642 10 819 906 13 205 512
Cash at beginning of period 0 2 144 626 8 368 285 16 340 927 27 160 833
CASH AT END OF PERIOD 2 144 626 8 368 285 16 340 927 27 160 833 40 366 345
Income Statement Un: Euros
Year 1 Year 2 Year 3 Year 4 Year 5
Costs 2 356 829 4 678 639 6 150 026 7 819 864 9 283 679
Outsourced Supplies and Services 771 654 1 623 721 2 076 264 2 592 882 3 022 527
Labour costs 659 800 682 893 706 795 735 066 764 469
Other Costs 925 375 2 372 024 3 366 967 4 491 916 5 496 683
Revenues 4 300 426 9 487 041 12 996 289 17 129 543 20 759 991
Sales of Licences 2 670 299 7 542 381 10 332 359 13 618 468 16 504 861
Sales of Services 1 630 127 1 944 661 2 663 930 3 511 075 4 255 130
EBIT 2 591 462 6 411 204 9 128 352 12 412 905 15 301 750
25
sells directly its product, due to the increase of brand awareness that the company will achieve over the years; 3) An increase in the number of members of the management structure, related with the number of clients that the company will gain through the years; 4) The increase of the salaries over the years is strictly related with the GDP growth; and 5) On the first year the company will not provide the e-commerce service and customization of the clients’ website.
Concluding, with the values above presented in the tables, PME.BOX has all financial conditions to follow with this expansion and to profit with it.
11. CONCLUSIONS / RECOMMENDATIONS
To conclude this Business Plan, it is important to give some recommendations in order to ensure the success of this expansion and make it sustainable. For that purpose, short-term and medium/long-term recommendations will be presented. In the short-term the following activities are recommended: 1) To choose a good Investor to realize the Joint Venture, with knowledge of the market to break some market barriers and turning easier the entry as well as to build good Partnerships to guarantee the distribution of the product with the purpose of gaining brand awareness; 2) Be selective in the recruitment process in order to ensure the right choice of the employees for the company to reach good internal and external performance, helping the clients and be recognized for the premium customer service; 3) Keep investing in R&D with the aim toinnovate and provide new features to its software, such as: video calls to the clients or free access to the bank account (both using pme.box). In the medium/long-term it is recommended: 1) Establishment of agreements with local Universities or Business Incubation Parks with the goal of helping the development of new ideas in order to improve the software; 2) Franchising – It will be important to
26
other markets, which will ensure a strong position in the market; 3) Patent Registration – As known, it is a slow process but in technological terms is essential to
avoid product’s plagiarism and with this protection it is possible to overcome the
technological risk mentioned before.
Therefore, if PME.BOX follows these recommendations, it will enhance its probability of having success in such a competitive but at the same time prospering market like Brazil. Additionally, this will facilitate PME.BOX’s international expansion and help it achieving one of the goals stated in the company vision: to be in the worldwide top market in 2020.
12. BIBLIOGRAPHY
Books:
Blokdjik, Gerard. January 21, 2008. SaaS 100 Success Secrets: How Companies Successfully Buy, Manage, Host and Deliver Software as a Service (SaaS): Emereo Publishing
Porter, Michael E. December 1996. “What Is Strategy?”: Harvard Business Review November
Kuratko, D. and Hodgetts, R. 2007. “Entrepreneurship – Theory, Process, Practice”:
International Student Edition
Published Articles:
AICEP, Portugal Global. 2011. Brasil – Ficha de Mercado (Maio 2011): 1- 33
Reference websites:
Bradesco – www.bradesco.com.br
Central Intelligence Agency - www.cia.gov
Computer World – www.computerworld.uol.com.br Deloitte – www.deloitte.com.br
HP – www.hp.com.br
International Monetary Fund - www.imf.org
Instituto Brasileiro de Geografia e Estatística - www.ibge.com PME.BOX – www.pme-box.com
Receita Federal do Brasil - www.receita.fazenda.gov.br SEBRAE – www.sebrae.com.br
27
Appendices
Exhibit 1 – Pme box in the iPad
28
Exhibit 3 - Industry Mapping
29 BOARD (2)
SALES (1)
DISTRIBUTION CHANNELS (1)
CERTIFIED PARTNERS (1)
ONLINE STORE (1)
MARKETING (1)
SOCIAL MEDIA (1)
COMMUNICATION (1)
RESOURCE (1)
TRAINING & QUALITY ASSURANCE (1)
CONTACT CENTER (1)
TELEMARKETING (2)
HELPDESK (2)
ACCOUNTING (1)
INVOICING (1)
CREDIT CONTROL (1)
Exhibit 5 –Porter’s Five Forces Analysis
30
31
Exhibit 8 – Financial Data
Assumptions
Year 1 Year 2 Year 3 Year 4 Year 5
Growth Rate of Sales Quantities
Products
Pme.box - direct selling
100 hours Package --- 70,0% 60,0% 50,0% 35,0%
Monthly fee --- 70,0% 60,0% 50,0% 35,0%
Pme.box - commercial Partnerships
100 hours Package --- 40,0% 30,0% 25,0% 15,0%
Monthly fee --- 40,0% 30,0% 25,0% 15,0%
Services
E-commerce (website + store) --- 0,0% 0,0% 0,0% 0,0%
Custom Website --- 0,0% 0,0% 0,0% 0,0%
Customization --- 0,0% 0,0% 0,0% 0,0%
Training Services --- 0,0% 0,0% 0,0% 0,0%
Growth Rate of Sales Prices
Products
Pme.box - direct selling
100 hours Package --- 0,0% 0,0% 0,0% 0,0%
Monthly fee --- 0,0% 0,0% 0,0% 0,0%
Pme.box - commercial Partnerships
100 hours Package --- 0,0% 0,0% 0,0% 0,0%
Monthly fee --- 0,0% 0,0% 0,0% 0,0%
Services
E-commerce (website + store) --- 0,0% 0,0% 0,0% 0,0%
Custom Website --- 0,0% 0,0% 0,0% 0,0%
Customization --- 0,0% 0,0% 0,0% 0,0%
Training Services --- 0,0% 0,0% 0,0% 0,0%
Salaries Growth Rate
Board --- 3,5% 3,5% 4,0% 4,0%
Management --- 3,5% 3,5% 4,0% 4,0%
Sales --- 3,5% 3,5% 4,0% 4,0%
Marketing --- 3,5% 3,5% 4,0% 4,0%
Quality Assurance --- 3,5% 3,5% 4,0% 4,0%
Contact Centre --- 3,5% 3,5% 4,0% 4,0%
Accounting --- 3,5% 3,5% 4,0% 4,0%
Social Welfare Rate 9,00% 9,00% 9,00% 9,00% 9,00%
Average Payment Time in days (0-360) for
inventories 60 60 60 60 60 Average Payment Time in days (0-360) for
outsourced services 30 30 30 30 30 Average Collection Time in days (0-360) 45 45 45 45 45
Average Inventory Rotation in days 7 7 7 7 7
VAT on Purchase of Inventories 21,0% 21,0% 21,0% 21,0% 21,0%
VAT on Purchase of Outsourced Services 18,0% 18,0% 18,0% 18,0% 18,0%
VAT on Sales of Products, Goods and
Services 18,0% 18,0% 18,0% 18,0% 18,0% VAT Difference 45 45 45 45 45
Income tax rate 25,0% 25,0% 25,0% 25,0% 25,0%
Un: Euro
Outsourced Supplies and
Services
Year 1
Year 2 Year 3 Year 4 Year 5
Jan Feb Mar Apr May Jun Jul Aug Sep Oct Nov Dec Total
Office 100m2 (includes energy, water, cleaning, etc)
3000 3000 3000 3000 3000 3000 3000 3000 3000 3000 3000 3000 36 000 36 000 36 000 36 000 36 000
Insurance (liability) 500 500 500 500 500 500 500 500 500 500 500 500 6 000 6 000 6 000 6 000 6 000
Communications 1000 1000 1000 1000 1000 1000 1000 1000 1000 1000 1000 1000 12 000 12 000 12 000 12 000 12 000
Representation costs & Travelling, board and lodging
2500 2500 2500 2500 2500 2500 2500 2500 2500 2500 2500 2500 30 000 30 000 30 000 30 000 30 000
Transportations -
Leasing 5000 5000 5000 5000 5000 5000 5000 5000 5000 5000 5000 5000 60000 60000 60000 60000 60000
Office materials 250 250 250 250 250 250 250 250 250 250 250 250 3000 3000 3000 3000 3000
Legal expenses 500 500 500 500 500 500 500 500 500 500 500 500 6000 6000 6000 6000 6000
Chartered Accountant
Costs 250 250 250 250 250 250 250 250 250 250 250 250 3000 3000 3000 3000 3000 Auditors Costs 250 250 250 250 250 250 250 250 250 250 250 250 3000 3000 3000 3000 3000
Publicity 10000 10000 10000 10000 10000 10000 10000 10000 10000 10000 10000 10000 120000 120000 120000 120000 120000
Commissions 3446 5168 6891 10337 13782 17228 18951 20673 24119 27564 31010 34455 213624 578483 752028 940035 1081041
Security 500 500 500 500 500 500 500 500 500 500 500 500 6000 6000 6000 6000 6000
Cleaning 500 500 500 500 500 500 500 500 500 500 500 500 6000 6000 6000 6000 6000 Royalties 10%
Licenses - PME.BOX Holding (R&D)
4307 6460 8614 12921 17228 21535 23688 25842 30149 34455 38762 43069 267030 754238 1033236 1361847 1650486
Labour Costs
Jan Feb Mar Apr May Jun
MGS SWC Total MGS SWC Total MGS SWC Total MGS SWC Total MGS SWC Total MGS SWC Total
Board 16 000 1 440 17 440 16 000 1 440 17 440 16 000 1 440 17 440 16 000 1 440 17 440 16 000 1 440 17 440 16 000 1 440 17 440
Management 20 000 1 800 21 800 20 000 1 800 21 800 20 000 1 800 21 800 20 000 1 800 21 800 20 000 1 800 21 800 20 000 1 800 21 800
Sales 4 500 405 4 905 4 500 405 4 905 4 500 405 4 905 4 500 405 4 905 4 500 405 4 905 4 500 405 4 905
Marketing 3 000 270 3 270 3 000 270 3 270 3 000 270 3 270 3 000 270 3 270 3 000 270 3 270 3 000 270 3 270
Contact Centre 2 600 234 2 834 2 600 234 2 834 2 600 234 2 834 2 600 234 2 834 2 600 234 2 834 2 600 234 2 834
Accounting 2 000 180 2 180 2 000 180 2 180 2 000 180 2 180 2 000 180 2 180 2 000 180 2 180 2 000 180 2 180
Total 48 100 4 329 52 429 48 100 4 329 52 429 48 100 4 329 52 429 48 100 4 329 52 429 48 100 4 329 52 429 48 100 4 329 52 429
Labour Costs
Total Year 1 Year 2 Year 3 Year 4 Year 5
RB SWC Total RB SWC Total RB SWC Total RB SWC Total RB SWC Total
Board 209 280 18 835 228 115 216 605 19 494 236 099 224 186 20 177 244 363 233 153 20 984 254 137 242 480 21 823 264 303
Management 261 600 23 544 285 144 270 756 24 368 295 124 280 232 25 221 305 453 291 442 26 230 317 672 303 099 27 279 330 378
Sales 58 860 5 297 64 157 60 920 5 483 66 403 63 052 5 675 68 727 65 574 5 902 71 476 68 197 6 138 74 335
Marketing 39 240 3 532 42 772 40 613 3 655 44 269 42 035 3 783 45 818 43 716 3 934 47 651 45 465 4 092 49 557
Contact
Centre 34 008 3 061 37 069 35 198 3 168 38 366 36 430 3 279 39 709 37 887 3 410 41 297 39 403 3 546 42 949
Accounting 2 333 210 2 543 2 415 217 2 632 2 500 225 2 724 2 600 234 2 833 2 703 243 2 947
Total 605 321 54 479 659 800 626 508 56 386 682 893 648 435 58 359 706 795 674 373 60 694 735 066 701 348 63 121 764 469
Labour Costs
Jul Aug Sep Oct Nov Dec
MGS SWC Total MGS SWC Total MGS SWC Total MGS SWC Total MGS SWC Total MGS SWC Total
Board 16 000 1 440 17 440 16 000 1 440 17 440 16 000 1 440 17 440 16 000 1 440 17 440 16 000 1 440 17 440 16 000 1 440 17 440
Management 20 000 1 800 21 800 20 000 1 800 21 800 20 000 1 800 21 800 20 000 1 800 21 800 20 000 1 800 21 800 20 000 1 800 21 800
Sales 4 500 405 4 905 4 500 405 4 905 4 500 405 4 905 4 500 405 4 905 4 500 405 4 905 4 500 405 4 905
Marketing 3 000 270 3 270 3 000 270 3 270 3 000 270 3 270 3 000 270 3 270 3 000 270 3 270 3 000 270 3 270
Contact Centre 2 600 234 2 834 2 600 234 2 834 2 600 234 2 834 2 600 234 2 834 2 600 234 2 834 2 600 234 2 834
Accounting 2 000 180 2 180 2 000 180 2 180 2 000 180 2 180 2 000 180 2 180 2 000 180 2 180 2 000 180 2 180
35 Auxiliary
Calculations
Year 1
Year 2 Year 3 Year 4 Year 5
1 2 3 4 5 6 7 8 9 10 11 12 Total
Suppliers account at beginning of
period
0 37 763 42 337 46 911 56 059 65 207 74 355 78 929 83 503 92 650 101 798 110 946 0 120 094 159 666 204 166 254 967
Purchases of
outsourced services 37 763 42 337 46 911 56 059 65 207 74 355 78 929 83 503 92 650 101 798 110 946 120 094 910 551 1 915 991 2 449 992 3 059 601 3 566 582 Suppliers account
at end of period 37 763 42 337 46 911 56 059 65 207 74 355 78 929 83 503 92 650 101 798 110 946 120 094 120 094 159 666 204 166 254 967 297 215 Payment of
outsourced services during the period
0 37 763 42 337 46 911 56 059 65 207 74 355 78 929 83 503 92 650 101 798 110 946 790 457 1 876 420 2 405 492 3 008 800 3 524 333
Receivables at the beginning of the
period
0 90 780 181 559 249 644 363 118 499 288 635 457 726 237 794 321 907 796 1 043 965 1 180 134 0 1 316 304 1 399 339 1 916 953 2 526 608
Sales of products,
goods and services 90 780 136 169 181 559 272 339 363 118 453 898 499 288 544 677 635 457 726 237 817 016 907 796 5 628 333 11 194 709 15 335 622 20 212 860 24 496 789 Receivables at the
end of the period 90 780 181 559 249 644 363 118 499 288 635 457 726 237 794 321 907 796 1 043 965 1 180 134 1 316 304 1 316 304 1 399 339 1 916 953 2 526 608 3 062 099 Collection during
the period 0 45 390 113 474 158 864 226 949 317 728 408 508 476 593 521 983 590 067 680 847 771 626 4 312 029 11 111 674 14 818 007 19 603 205 23 961 298 Deductible VAT 5 760 6 458 7 156 8 551 9 947 11 342 12 040 12 738 14 133 15 529 16 924 18 319 138 898 292 270 373 728 466 719 544 055
Collected VAT 13 848 20 772 27 695 41 543 55 391 69 239 76 163 83 086 96 934 110 782 124 630 138 477 858 559 1 707 667 2 339 332 3 083 318 3 736 798
VAT to be
paid/recovered 8 087 14 313 20 540 32 992 45 444 57 896 64 123 70 349 82 801 95 253 107 706 120 158 719 662 1 415 398 1 965 605 2 616 599 3 192 744 VAT final balance --- --- --- --- --- --- --- --- --- --- --- --- 227 863 176 925 245 701 327 075 399 093
VAT paid/recovered in the
period
--- --- 8 087 14 313 20 540 32 992 45 444 57 896 64 123 70 349 82 801 95 253 491 798 1 466 336 1 896 829 2 535 225 3 120 725
Salaries paid
during the period 52 429 52 429 52 429 52 429 52 429 52 429 52 429 52 429 52 429 52 429 52 429 52 429 659 800 682 893 706 795 735 066 764 469 Net earnings
before tax --- --- --- --- --- --- --- --- --- --- --- --- 2 591 462 6 411 204 9 128 352 12 412 905 15 301 750 Income tax on
current year earnings --- --- --- --- --- --- --- --- --- --- --- --- 647 866 1 602 801 2 282 088 3 103 226 3 825 437 Payment of
income tax in the year
36
Investment Plan Year 1 Year 2 Year 3 Year 4 Year 5
Jan Feb Mar Apr May Jun Jul Aug Sep Oct Nov Dec Total
Tangible Fixed
Assets
1) Equipment
- Hardware -
Data Center 3 000 3 000 3 000 3 000 3 000 3 000 3 000 3 000 3 000 3 000 3 000 3 000 36 000 36 000 36 000 36 000 36 000 - Portable
Devices (PC, iPhone, iPad, Netbook, etc)
25 000 0 0 0 0 0 0 0 0 0 0 0 25 000 0 12 500 0 15 000
- PVC Card
Printer 1 000 0 0 0 0 0 0 0 0 0 0 0 1 000 0 1 000 0 1 000 - Barcode
Scanner 250 0 0 0 0 0 0 0 0 0 0 0 250 0 250 0 250 - Barcode
Printer 250 0 0 0 0 0 0 0 0 0 0 0 250 1 000 1 000 1 000 1 000 - PME.BOX
website, helpdesk, e-commerce, workflow, etc
10 000 10 000 10 000 10 000 10 000 10 000 10 000 10 000 10 000 10 000 10 000 10 000 120 000 120 000 120 000 120 000 120 000
- Basic Printer 1 000 0 0 0 0 0 0 0 0 0 0 0 1 000 1 000 1 000 1 000 1 000
. Furniture and
Administrative eq. 10 000 0 0 0 0 0 0 0 0 0 0 0 10 000 0 2 000 1 000 2 000
Total Tangible
Fixed Assets 50 500 13 000 13 000 13 000 13 000 13 000 13 000 13 000 13 000 13 000 13 000 13 000 193 500 158 000 173 750 159 000 176 250
Intangible Assets 1) Adapt PME.BOX to local
needs
10000,0 0,0 0,0 0,0 0,0 0,0 0,0 0,0 0,0 0,0 0,0 0,0 10 000 0 0 0 0
2) Studies and
Analysis 833,3 833,3 833,3 833,3 833,3 833,3 833,3 833,3 833,3 833,3 833,3 833,3 10 000 10000 10000 10000 10000 3) Software (OS,
ANTIVIRUS, ETC.)
1041,7 1041,7 1041,7 1041,7 1041,7 1041,7 1041,7 1041,7 1041,7 1041,7 1041,7 1041,7 12 500 12500 12500 12500 12500
4) Training 833,3 833,3 833,3 833,3 833,3 833,3 833,3 833,3 833,3 833,3 833,3 833,3 10 000 12000 13000 14000 15000
5) Research and
Development 833,3 833,3 833,3 833,3 833,3 833,3 833,3 833,3 833,3 833,3 833,3 833,3 10 000 11000 12100 13310 14641 6) Marketing &
Public Relations 833,3 833,3 833,3 833,3 833,3 833,3 833,3 833,3 833,3 833,3 833,3 833,3 10 000 11000 12100 13310 14641
Total Intangible
37
Depreciation and Provisions % 2012 2013 2014 2015 2016
Tangible Fixed Assets
- Hardware - Data Centre 33,33% 11 999 23 998 35 996 47 995 59 994
- Portable Devices (PC, iPhone, iPad, Netbook, etc) 33,33% 8 333 8 333 12 499 12 499 17 498
- PVC Card Printer 33,33% 333 333 667 667 1 000
- Barcode Scanner 33,33% 83 83 167 167 250
- Barcode Printer 33,33% 83 417 750 1 083 1 417
- PME.BOX website, helpdesk, e-commerce, workflow, etc 33,33% 39 996 79 992 119 988 159 984 199 980
- Basic Printer 33,33% 333 667 1 000 1 333 1 667
. Furniture and Administrative eq. 0,00% 0 0 0 0 0
Sub-total 61 161 113 822 171 066 223 728 281 805
Intangible Assets
1) Adapt PME.BOX to local needs 33,33% 3 333 3 333 3 333 0 0
2) Studies and Analysis 100,00% 10 000 20 000 30 000 30 000 30 000
3) Software (OS, ANTIVIRUS, ETC.) 33,33% 4 166 8 333 12 499 12 499 12 499
4) Training 100,00% 10 000 22 000 35 000 39 000 42 000
5) Research and Development 100,00% 10 000 21 000 33 100 36 410 40 051
6) Marketing & Public Relations 100,00% 10 000 21 000 33 100 36 410 40 051
Sub-total 47 499 95 666 147 032 154 319 164 601