A Work project presented as part of the requirements for the Award of a Master’s Degree in Management from the Nova School of Business and Economics
Healthy Brand Extentions Targeted at
Adolescents:
Can products encourage healthier eating habits and still be fun?
Clara Nobre Braga dos Santos ♯909
A Project carried out on the Children Consumer Behaviour Fieldlab, with the supervision of:
ABSTRACT
This study aims to understand if launching healthy extensions of brands that have high acceptance among adolescents could contribute to healthier eating habits. We also analyzed the impact of this launch on brand image. We conducted a survey with 121 Brazilian teenagers and used the market leader brand to study the hypothesis. Results showed that brand preference remained very high with the introduction of the new reduced sugar product, although this caused significant effects regarding brand image. These effects vary regarding age and gender of the child, and also whether the adolescent had already engaged in weight control practices.
Key words: Brand extension, Brand image, Health, Adolescents
INDEX
ABSTRACT ... 2
1. INTRODUCTION ... 4
LITERATURE REVIEW AND HYPOTHESIS FORMULATION ... 5
1.1 Adolescents’ Relationship with Brands and Food ... 5
1.2 Stages of Cognitive Development ... 6
1.3 Adolescents’ Relationship with Healthy Eating and Diets ... 7
1.4 Brand Extensions ... 8
1.5 Adolescents, Self-‐Image and Dieting ... 8
METODOLOGY ... 10
1.6 Legal an Ethical Issues ... 10
1.7 Research Method ... 10
1.8 Pre test ... 10
1.9 Sample ... 10
1.10 Measurements ... 11
1.10.1 Questionnaire 1: Brand Awareness ... 11
1.10.2 Questionnaire 1 Results ... 11
1.10.3 Brand Preference ... 12
1.10.4 Brand Image ... 13
RESULTS ... 14
1.11 Sample ... 14
1.12 Hypothesis testing ... 14
CONCLUSIONS ... 19
LIMITATIONS AND FUTURE RESEARCH ... 20
REFERENCES ... 20
APPENDIXES ... 23
1.
INTRODUCTION
Overweight children and adolescents are a growing concern, with 5% to over 25% of 11 to 13 year old children around the globe being overweight or obese, reaching epidemic proportions in industrialized and in low and middle-income countries, especially in urban areas (WHO, 2009,2005).
Nielsen´s 2011 global survey showed that 48% of consumers are trying to lose weight and one seventh of them are cutting down on fat. The industry is responding to that reducing sugar from consumer packaged goods (Mintel, 2010).
There is a strong preference in the FMCG market to launch innovations through extensions, as opposed to new brands (Taylor, 2004). However, failure of extensions is significantly high (ACNielsen’s 2005). The trend to launch products via extensions can be explained due to the fact that this transfers to the new product qualities that the brand already has in the eyes of the consumer (Boush et al., 1987). Adolescents have strong brand loyalty (Solomon et al., 2006), which makes it even harder for new brands to be launched towards this specific target. For that reason, when directing healthy products to adolescents, it makes sense to do so under a brand that already has a good acceptance with them. Moreover, brand extensions have the advantage of securing trial due to brand awareness (Swaminathan et al., 2001). On the other hand, acceptance of brand extensions by adolescents depends on the fit between parent and extension category (Xin, Liu et al., 2012), making sure the new product fits within the brand’s promise (Kapferer, 2008), and does not damage its image.
that simply stating the benefits of healthy food is not enough to promote its purchase and consumption (Gary et al, 2007). Mothers struggle with the desire to please their children, but still providing healthy options (Gary et al, 2007). Products that have a high appeal to the adolescents while catering to a desire for healthier choices would please both the child and the parent, and availability of healthier options could influence children´s purchase (Rexha et al, 2010). Therefore, being able to successfully take advantage of a high-levered brand and promote consumption of healthier alternatives could be an encouraging possibility to promote better eating habits among children.
This study aims to understand if reduced sugar brand extensions targeted at adolescents are able to have the necessary fit with the fun parent brand in order to generate positive response when it comes to brand preference and brand image, thus resulting in a successful strategy for product launch.
LITERATURE REVIEW AND HYPOTHESIS FORMULATION
1.1 Adolescents’ Relationship with Brands and Food
When it comes to taste, adolescents have a very strong and inflexible view of what is considered “good” or “bad”, the former being often related to unhealthy food and the later to healthy options (Clifford et al., 2007). Moreover, there is a strong preference for things that “look good” (Clifford et al., 2007). Having foods that are already have the appeal (color, consistency, packaging, logo, smell, texture) that adolescents appreciate, could overcome this aversion to the looks and taste of food that is seen as healthy. Familiarity also plays an important hole, since preference increases when consumers are familiar and experienced with a certain object (Bettman et al., 1998). According to Clifford et al. (2007), when it comes to health concerns, adolescents see calorie dense foods as “bad for you”, and many define healthy dieting by the exclusion of these foods. Although they often opt for such foods, they have a sense of guilt in doing so, and report healthy eating as an intention that is hard to follow due to their cravings. Moreover, adolescents tend to see themselves as helpless when it comes to eating healthy, thinking they need aid from parents in order to do so. This affects their self-image as they see themselves as unable to take charge of a healthier diet. This leads to our first hypothesis:
H1: When it comes to familiar brands, adolescents will prefer the reduced
sugar version of the breakfast cereal to the regular version.
1.2 Stages of Cognitive Development
develop those characteristics even further, in the reflexive stage, in which more detailed consideration of a product’s performance attributes are taken (John, 1999). This leads to our second hypothesis:
H2: Low fat/sugar products will be more appealing to older children.
1.3 Adolescents’ Relationship with Healthy Eating and Diets
Adolescents struggle with their body image, having an ideal image of being thin and even ostracizing the ones who do not fit into this profile. This is a concern common to both genders; however, it is stronger of teenage girls (Clifford et al., 2007).
Adolescents have, typically, a lack of urgency when it comes to their health (Neumark-Sztainer et al., 1999), and they point overweight as a reason to start eating more healthily, since they value more the short-term benefit of being thin than the long term one of being healthy (Clifford et al., 2007).
Researches indicate that adolescents consume a significant amount of light products, and many of them are or have been in some sort of diet. A study conducted by the University of Minnesota showed that, among the adolescents studied, half of the females and one fourth of the males claimed to be in some sort of diet in the previous year (Neumark-Sztainer et al., 1999). Moreover, research shows that women consume more light and low sugar products, and they do so more frequently (Flaczyk et al.,
2006).
more dissatisfied and more concerned about their physical appearance than men (Frederick et al., 2006), showing more anxiety related to feelings of attractiveness and satisfaction with their body (Kamps and Bermam, 2011). This leads to the next hypothesis:
H3: Girls will be more receptive than boys when it comes to healthier
versions of known products.
H3.1: The gender gap increases with age.
1.4 Brand Extensions
An easier and cheaper way of launching new products into the market is through brand extensions, since this saves the need to create awareness from scratch. It is also a safe option since failures in brand extensions are usually forgotten with little or no harm to the parent brand (Kapferer, 2008). Extensions failure is usually due to a lack of understanding of the parent brand, and what it stands for, creating an over-stretch (Haig, 2003).
Taking into account that healthy brand extensions of fun parent brands keep the
fun appeal in their marketing and communication campaigns, the next hypothesis is: H4: Launching a healthy(er) version of a product from a certain brand will
not damage its brand image.
1.5 Adolescents, Self-‐Image and Dieting
(Neumark-Sztainer, Butler and Palti, 1995), which plays an important role in adolescence (WHO, 2005). Many researches have tried to explain this link and the best explanation that can be drawn from available data is based upon sociocultural factors (Heinberg, Wood and Thompson, 1996), since, with increased availability of food, there has been a shift in the beauty ideal from the time in which fatness was a sign of prosperity (Brown and Bentley-Condit, 1998) to nowadays, when being thin is the new ideal body status (Popkin et al., 1993). Adolescents are especially vulnerable to the influence of peers, mass media, and social and cultural norms (Johnston and Haddad, 1996), and it is known that unnecessary or frequent dieting are risk factors for eating disorders (French, Story and Perry, 1995). For that reason, it is important to know if the launch and promotion of reduced sugar or reduced fat products might encourage extreme dieting behavior. This leads to the fifth hypothesis:
H5: Preference for reduced sugar products will be higher for adolescents
who adopt weight control practices
H5.1: Preference for reduced sugar products is more strongly
associated with adoption of unhealthy weight control practices than
with healthy ones
METODOLOGY
1.6 Legal an Ethical Issues
In order to respect ethical requirements, the guidelines from UNICEF (2002) were used. It was required permission from parents and from the schools. Confidentiality was guaranteed and the academic purpose of the study was explained to parents and adolescents. We explained to adolescents that there were no right or wrong answers and that they could decide to participate or not despite of parent’s authorization.
1.7 Research Method
This study aims to find numerical evidence for the proposed hypothesis, measuring brand image and brand preference. For that reason, quantitative research (questionnaires) was used. Qualitative research should be used in further studies, if the goal is to understand the reason for certain behavior (Malhotra et al., 2007). The questionnaires were applied in two private schools in Brazil, one in the city of Contagem and the other in the city of Vespasiano. The study was conducted in two steps so each child answered two questionnaires.
1.8 Pre test
A pre test with 8 children was done, in order to see if there were any problems in understanding the questions. There were no difficulties, so we proceeded to apply the questionnaires to the sample.
1.9 Sample
A total of 121 parent´s authorizations were received, so 121 questionnaires were applied to the children, 61 to the experimental group and 30 to the control group. Regarding the parent´s questionnaires (see appendix I), 120 were answered.
1.10 Measurements
This first questionnaire to children had the aim to measure brand awareness (recall and recognition). The second questionnaire accessed brand preference and brand image. We also used variables related to the adolescent’s concern with health and healthy eating (see appendixes III and IV). We also included a questionnaire to parents, to understand better the sample (see appendix I). First, they were asked about education level, in order to access social class. Then they were asked which breakfast cereal their children often consumed, to evaluate the frequency of consumption and relate to the awareness levels. The last question evaluated how often they talked to their children about healthy eating (McLeod, 2008) on a 5-point Likert scale, in order to see if the children were coming from households that valued healthy habits.
1.10.1 Questionnaire 1: Brand Awareness
In order to know which brand to be used on questionnaire 2, the first questionnaire aimed at accessing wich were the “known” and “unknown” brands. First, adolescents were asked to write all brands of cereal that they could think of, in order to test recall. Further, they were asked to mark which cereals they knew from a list of nine options, to test recognition. Pictures were provided at this stage, since often brand awareness cannot be separated from its symbols and imagery (Aaker, 1996).
A total number of 121 questionnaires were applied, to children between 11 and 14 years of age. The brands Chocapic and Zadimel had the lowest scores in brand awareness (both recall and recognition) Chocapic presented 0% recall and 4,9% recognition, whereas Zadimel had 0% recall and 0% recognition. The brand that had the highest awareness levels was Sucrilhos, with recall of 90,2% and recognition of 100%. Thus being the brand used to test the hypothesis.
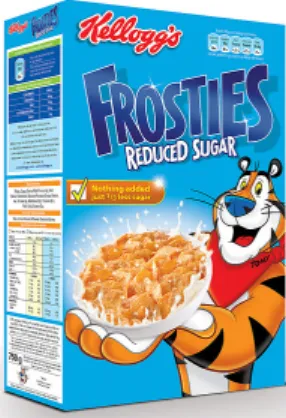
In order to test preference and brand image for the reduced sugar version of the known brand, a package for the reduced sugar version of Sucrilhos was created. It was inspired by the packaging of the brand Frosties1 Reduced Sugar, which is already commercialized in some countries such as the UK and Portugal (see Figure 1) The reduced sugar product used is not real, but a simulation of a packaging created in order to conduct this research (see appendix III; Q1, Q2).
1.10.3 Brand Preference
Brand preference, in this case, was considered the extension to which customers prefer a certain brand to other brands of breakfast cereal. In order to do so, adolescents were asked to rate their preference for four different cereal brands, ordering them from most to least preferred brand, being 1 the most preferred brand and 4 the least preferred one.
The experimental group was presented with four cereal options, one of them was Sucrilhos Reduced Sugar and the other three were regular versions of other cereals (Chocapic, Zadimel and Cornflakes). The control group had the same options, except that they were presented with the regular version of Sucrilhos, instead of the Reduced
1 Frosties is the name of Sucrilhos in countries such as The United States, United Kingdom, Portugal and
France
Sugar option, as can be seen in the questionnaires for both groups (appendix II and III). To see which brands were the most and the least preferred, we computed preference means for the brands presented individually for each child. To compare the preference for the regular or the reduced sugar version we compared the mean for the control versus the experimental group as a whole and per subgroup, according to each hypothesis (age, gender, weight control measures).
1.10.4 Brand Image
RESULTS
1.11 Sample
The questionnaires of the parents were analyzed in order to understand better the sample. 120 valid questionnaires were received from parents. Most parents had an education level between 9th and 12th year (26% and 34%, respectively), although there is a high percentage of parents (22%) with a degree of some sort. When asked which brand of breakfast cereal their children usually consumed, Sucrilhos was the most mentioned brand (64%), followed by Nescau (24%), Cornflakes (6%) and finally, Nesquick (4%). This corroborated the results of the brand awareness questionnaire 1 from children. Since Sucrilhos was the most consumed brand, it makes sense that it had high awareness. Finally, when asked how frequently parents talked to their children about health, most of the parents indicated to do it either “Frequently” (70%) or “Very Frequently” (17%), which may indicate that this is a common subject on the respondents homes or that parents may have felt compelled to answer positively due to a social desirability bias (Podsakoff et al., 2003).
Our children sample was composed of 121 children, 54% girls and 46% boys. In terms of gender distribution in the control and experimental groups, it was homogeneous, as proved by a Chi-Square test (p=.239).
1.12 Hypothesis testing
In order to test the hypothesis presented, the two groups (experimental and control) were divided into 4 subgroups. The experimental group was divided into
subgroup 1 (composed of younger children) and subgroup 2 (composed of older
Hypothesis H1 claimed that adolescents would prefer the reduced sugar version of Sucrilhos to its regular version. To test that, an independent sample T-Test was conducted, comparing the preference means for the experimental group (mean = 1.31) versus the control group (mean = 1.32). A p value of .816 was found, which means that are no statistical differences for mean preference of the reduced sugar versus the regular version, indicating that H1 should be rejected.
We also divided the preference ratings into high (when the brand was placed in the first position) versus medium-low (when the brand was placed in positions 2, 3 or 4), and conducted a Chi Square test, (p=.871), which confirmed the results.
The second hypothesis H2 predicted that older children would be more receptive of the reduced sugar brand. In order to test that, mean preference for all the subgroups was calculated. Subgroup 1 had a mean preference for Sucrilhos of 1.23, Subgroup 2 had a mean of 1.40, Subgroup 3 had a 1.40 mean preference and Subgroup 4 mean was 1.23. In the case of the older group, the means are contrary to our expectations, with children preferring the normal version to the reduced sugar version.
Hypothesis H3 predicted that girls would be more receptive of the reduced sugar brand than boys. Table 1 presents the means obtained for each gender, as well as the p values obtained for the T-Tests and Chi-Square tests conducted. As we can see, for both genders the mean preference for the reduced sugar version is lower than the normal version, but since these differences are non-significant, we can conclude that there is no effect for both genders, and, therefore, we can reject H3.
Table 1: Comparison between experimental and control preference levels for each gender
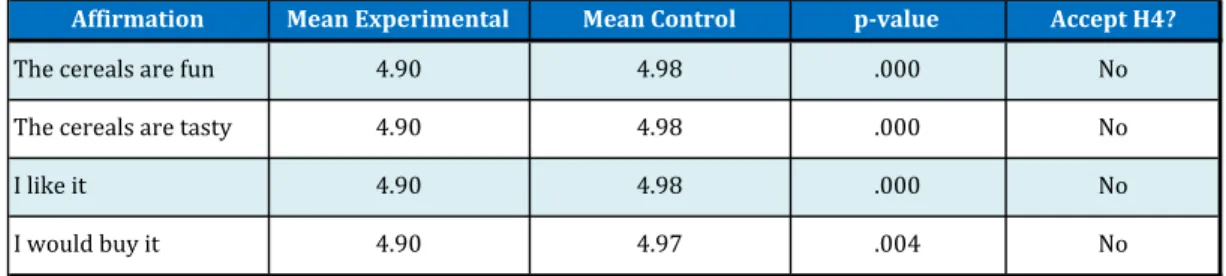
For hypothesis H4, in order to test the fit between the reduced sugar version with the brand’s image, students were asked to rate four statements about the brand. The means for each variable rating were compared for the experimental group (in which the entire line, reduced sugar and regular versions were presented) and for the control group (in which just the regular version was presented). In order to do so, a series of independent T-Tests was conducted. The results are summarized in Table 2 and indicate that there is a significant difference in the ratings given for the brand in the experimental group and in the control group for all of the attributes tested. That means that a reduced sugar version affects the brand image of Sucrilhos, so H4 is rejected.
Table 2 T-Test of brand image between control and experimental groups
The test was then repeated, taking into account the impact the reduced sugar version would have on brand image regarding age and gender differences. Tables 4 and 5 summarize the results. It is possible to see that both girls and boys see the brand
Mean%
Experimental%Mean%Control% T1Test
how%many%rated%
high%preference% control
how%many%rated%
high%preference% experimental
Chi1Square
Females 1.36 1.38 p=.764 (21)-72% 26-(72%) p=.986
Males 1.24 1.26 p=.748 (25)-81% 20-(80%) p=.952
Affirmation Mean,Experimental Mean,Control p2value Accept,H4?
4.90
4.90
4.90
4.90
I&like&it 4.98 .000 No
I&would&buy&it 4.97 .004 No
The&cereals&are&fun 4.98 .000 No
image affected by the launch of a reduced sugar product. Purchase intention, however, was not altered for the girls. Regarding age, the launch has no impact for younger children at all, but has a strong impact on older children in all attributes tested.
Table 3- T-Test between experimental and control brand image attributes according to gender
Table 4 T-Test between experimental and control brand image attributes according to age
Hypothesis H5 predicted that children that already adopt some sort of weight control measure would be more inclined to have a higher preference for the reduced sugar version. Only 24% of our sample confirmed to have adopted some of these practices in the past. Weight control practices considered were: dieting (8.3%), eating
less sugar in order to lose weight (22.3%), skipping meals in order to lose weight (0%),
and others (19%).
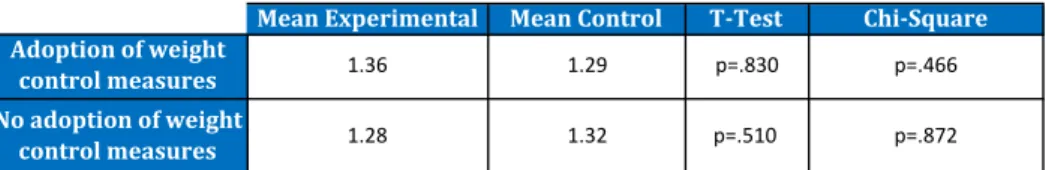
In order to test this Hypothesis, the sample was divided into children who had adopted weight control measures and children who had not. Within both groups we conducted T-Tests and Chi-Square tests between the control and the experimental groups. Results suggest that there are no significant differences on all groups (Table 5), and, therefore, H5 is rejected.
Mean%Experimental Mean%Control p0value Mean%Experimental Mean%Control p0value
4.89 4.89 4.89 4.89
p=.001
I%would%buy%it 4.93 p=.247 4.92 5.00 p=.001
I%like%it 4.97 p=.019 4.92 5.00
p=.001
The%cereals%are%tasty 4.97 p=.019 4.92 5.00 p=.001
The%cereals%are%fun 4.97 p=.019 4.92 5.00
Affirmation
Females Males
Mean%Experimental Mean%Control p0value Mean%Experimental Mean%Control p0value
p=.000 4.87
4.87
4.87
4.87
I%would%buy%it 4.94 4.93 p=.947 5.00
p=.000
I%like%it 4.94 4.97 p=.226 5.00 p=.000
The%cereals%are%tasty 4.94 4.97 p=.226 5.00
Affirmation
Younger Older
Table 5: Results for preference between children who have and have not adopted weight control measure
We also tested if brand image varied according to adoption of weight control practices. In order to do that, an Independent Variable T-Test was conducted, comparing brand attributes rating for experimental versus control groups, for children who adopted weight control measures and for children who did not adopt them (Table 6). Results suggest that, for children who adopt weight control measures, the reduced sugar version diminishes the “fun” aspect of the brand. However, it does not affect other attributes studied. Among the group who did not adopt weight control measures the impact on brand image is stronger, with the reduced sugar version significantly impacting all attributes studied.
Table 6: T-Test between Experimental and Control Brand Image Attributes according to adoption of weight control measures
Hypothesis H5.1 could not be tested because none of the adolescents claimed to have taken unhealthy measures in other to lose weight (only healthy measures such as exercise and eating fewer sweets were reported). This could be due to the fact that, even though anonymity was guaranteed, unhealthy eating habits are associated with eating disorders, which are a sensitive issue. Therefore, such questions are subject to omission by interviewees (Brener et al, 2003), due to its sensitive nature.
Mean%Experimental Mean%Control T1Test Chi1Square Adoption%of%weight%
control%measures 1.36 1.29 p=.830 p=.466
No%adoption%of%weight%
control%measures 1.28 1.32 p=.510- p=.872
Mean%Experimental Mean%Control p0value Mean%Experimental Mean%Control p0value
p=.007 p=.000 p=.000 p=.007 4.92
4.92 4.92
4.98 5.00 5.00 4.98 5.00
4.86 4.86 4.86
p=.023 p=.934 p=.934 p=.934
Adoption%of%weight%control%measures No%adoption%of%weight%control%measures Affirmation
The%cereals%are%fun
The%cereals%are%tasty
I%like%it
4.86 4.86 4.86
4.92
CONCLUSIONS
The findings of this study revealed that the reduced sugar version had a very high acceptance, as high as the regular version, among adolescents from 11 to 14 years old, with disregard of gender. When it comes to age, older children had high preference for both versions, despite having a higher mean preference for the regular version. Younger children, however, had a higher mean preference for the reduced sugar version, still having high preference for both versions. A reflection of this age differences can be seen when analyzing brand image. For older children, the launch of the reduced sugar version had an impact on brand image, reducing the positive responses the brand elicits. To younger children, however, there was no impact on brand image due to the launch of the reduced sugar version. This suggests that the product could be more successful if targeted to younger adolescents.
It was also possible to see that the reduced sugar version did not have a higher preference among children who usually adopt weight control measures, leading to the conclusion that launching and marketing such products to this target would not take advantage of children who are more concerned with weight control nor particularly encourage such concerns. Due to its universal acceptance (even when preference and image were affected, they still remained very high) to different ages, genders and behaviors (concerned and not concerned with weight and/or health), making these products available would appeal to a broad audience and could benefit a lot of adolescents.
is strong enough, as it is the case of Sucrilhos, to be able to sustain high preference and positive brand image even with the impacts that the launch of a reduced sugar version can bring.
LIMITATIONS AND FUTURE RESEARCH
Since eating disorders are a sensitive issue, it is possible that it was not accurately reported in the questionnaires (Rosen & Poplawski, 1987). For this reason, we suggest further research to conduct a deeper analysis, built with help of doctors and psychologists and using more detailed methods that would be able to perceive more accurately which children are prone to developing eating disorders.
Moreover, this study should be conducted with different brands that do not have such strong image, preference and/or awareness in the market, in order to test if the results would vary.
Lastly, we could see that the sample was mostly composed by children whose parents have high levels of education, so a broader social background would be desired in order to have a better representation of the population.
REFERENCES
• Aaker, D. A. 1996. “Measuring Brand Equity Across Products and Markets.” California Management Review, 38(Spring): 102-120.
• Archer, S. 1989. “The Status of Identity: Reflections on the Need for Intervention.” Journal of Adolescence, 12: 345 – 359.
• Bettman, J.R., Luce, M.F., Payne, J.W. 1998."Constructive Consumer Choice Processes", Journal of Consumer Research, 25(3):187-217.
• Boush, DM. & Loken, B. 1991. "A Process-Tracing Study of Brand Extension Evaluation", Journal of Marketing Research, 28 (February): 16-28.
• Brown, P; Bentley-Condit UK. 1998. “Culture, evolution and obesity”. In Handbook of obesity ed Bray GA, Bouchard C, James WPT, 143-55. New-York: Marcel Dekker.
• Chandon, P. 2004. “Note on brand Audit: How to Measure Brand Awareness, Brand Image, Brand Equity and Brand Value”, INSEAD
• Dennison, CM; Shepherd, R. 1995. “Adolescent Food Choice: an Application of the Theory of Planned Behaviour.” Journal Human Nutrition Dietetics, 8:9-23.
• Flaczyk, E; Kobus, J & Korczak, J. 2006. “Assessment of Consumption of “ Light Food by Students”, ACTA Scientiarum Polonorum Technologia Alimentaria, 5(1): 173-181.
• Fox, KR; Page, A; Peters, DM et al. 1994. “Dietary restraint and fatness in early adolescent girls and boys.” Journal of Adolescence, 17:149
• Fraser, K & Eccles, J. 1995. “Sex, hopes and fears: Gender Differences in Adolescents’ Possible Selves” Youth and Society, 31(3): 187-309.
• French, SA; Story, M; Perry, CL. 1995. “Self-esteem and obesity in children and adolescents: a literature review.” Obesity Research, 3:479-90
• Hellier, P.K.; Geursen, G.M.; Carr, R.A.; and Rickard, J.A. 2000. “Customer repurchase intention: A general structural equation model.” European Journal of Marketing, 37 (11/12): 1762-1800
• John, D. R.1999. "Consumer Socialization of Children: A Retrospective Look at Twenty-Five Years of Research". Journal of Consumer Research, 26(3): 183-213
• Johnston, PK; Haddad, EH. 1996 “Vegetarian and other dietary practices.” In: Adolescent Nutrition– Assessment and management, ed Rickert VI, 57-88. New York: Chapman & Hall Inc,
• Haig, Matt. 2003. Brand Failures:The Truth About the 100 Biggest Branding Mistakes of All Time,London: Kogan Paige
• Heinberg, LJ; Wood, KC; Thompson, JK. 1996. “Body image.” In: Adolescent Nutrition – Assessment and management. Ed Rickert VI, 136-156. New York: Chapman & Hall Inc.
• Kamps, C. and Bermam, S. 2011 “Body image and identity formation: the role of identity distress”. Revista Latinoamericana de Psicología 43(2):267-277
• Kapferer, J. 2008. The New Strategic Brand Management: Creating and Sustaining Brand Equity Long Term, Fourth Edition, London: Kogan Page
• Malhotra, NK. & Birks, D. 2003. Marketing Research – an applied approach. London: Prentice Hall.
• McLeod, S. A. 2008. Likert Scale Retrieved from www.simplypsychology.org/likert-scale.html
• Moschis, GP.; Moore, RL.; Stanley, TJ. 1984. “An Exploratory Study of Brand Loyalty Development”. Advances in Consumer Research, 11: 412-417.
• Neumark-Sztainer, D; Story, M; Perry, C; Casey, M. 1999. “Factors Influencing Food Choices of Adolescents: Findings from Focus-Group Discussions with Adolescents” Journal of the American Dietetic Association, 99 (8):929-937.
• Neumark-Sztainer, D; Butler, R; Palti, H. 1995. “Eating disturbances among
adolescent girls: evaluation of a school-based primary prevention program.” Journal Nutrition
Education, 27:24-31.
• Noble, G; Stead, M; Jones, S; McDermott, L; McVie, D. 2007 “The paradoxical food
buying behaviour of parents: Insights from the UK and Australia.”, British Food Journal, 109
(5): 387-398.
• Podsakoff, PM.; MacKenzie, SB.; Jeong-Yeon, L. 2003 “Common Method Biases in Behavioral Research: A Critical Review of the Literature and Recommended Remedies.” Journal of Applied Psychology, 88(5): 879-203.
• Rexha, D; Mizerki, K; Mizerki, D. 2010. “The Effect of Availability, Point of Purchase Advertising and Sampling on Children´s First Independent Food Purchases” Journal of Promotional Management, 16(1): 148 – 166.
• Rosen, JC & Poplawski, D. 1987. “The validity of self-reported weight loss and weight gain efforts in adolescents.” International Journal of Eating Disorders, 6:515–23.
• Robertson, TS. 1979. "Parental Mediation of Television Advertising Effects," Journal of Communication, 29 (Winter), 12-25.
• Seyama, W. 2006. “Factors of Successful Brand Extensions in the FMCG Industry”
MBA dissertation, University of Pretoria, Pretoria, viewed 12/10/20:
http://upetd.up.ac.za/thesis/available/etd-04012010-113445.
• Solomon, M; Bamossy, G; Askegaard, S; Hogg, MK. 2006. Consumer Behavior, A European Perspective, Third Edition, Essex:Prentice Hall.
• Srull, T. K. 1984. “Methodological techniques for the study of person memory and
social cognition.” In Handbook of social cognition Vol 2, ed. R. S. Wyer & T. K. Srull, 1-72.
Hillsdale NJ: Erlbaum Associates.
• Stevenson, C; Doherty, G; Barnett, J; Muldoon, OT; Trew, K. 2007. “Adolescents’ views of food and eating: Identifying barriers to healthy eating”. Journal of Adolescence, 30: 417-434.
• Story, M & French, SF. 2004. “FoodAdvertising and Marketing Directed at Children and Adolescents in the US.” International Journal of Behavioral Nutrition and Physical Activity; 1: 3.
• Taylor, D. 2004. Brand Stretch: Why 1 in 2 Extensions Fail, and How to Beat the Odds. West Sussex: John Wiley & Sons Ltd
• Vanitha, S; Richard, JF; Srinivas, KR. 2001. “The Impact of Brand Extension Introduction on Choice.” Journal of Marketing, 65(4): 1-15.
• Ward, S. 1974. “Consumer Socialization” Journal of Consumer Research, 1(2): 1-14.
• World Health Organization. 2009. “Prevelance of Overweight and Obesity in Children and Adolescents.” Fact Sheet 2.3 December.
• World Health Organization. 2005. “Issues and challenges for the health sector : issues in adolescent health and development”, WHO Press Nutrition in adolescence .
• Xin, L & Jing, H. 2012. “Adolescent Evaluations of Brand Extensions: The Influence of Reference Group.” Psychology & Marketing Journal, 29(2): 98-106.
Websites:
• World Health Organization. Global strategy on diet, physical activity, and health: childhood overweight and obesity. Accessed September 10, 2012.
• Mintel.com Accessed November 28, 2012.
23
A
PPE
ND
IXE
S
I. P a ren t’s A u th o riz a tio n F o rm a n d Q u es tio n n a ir
e
Clara Nobre Braga dos Santos, Aluna de Mestrado em Gestão Nova School of Business and Economics
Contactos: 91 286 68 73 – [email protected]
____________________________________________________________________________________
Questionário Responsável
1. Indique*suas*habilitações*literárias*
□**Sem*estudos* * □*12º*Ano*(Ensino*Secundário)*
□*4º*Ano*(Ensino*Primário)* □*Bacharelado/Licenciatura*
□*9º*Ano*(Ensino*Básico)* □*Pós*Graduação*
2. Quais*cereais*matinais*seu*filho*costuma*consumir?*(pode*indicar*mais*do*que*uma*marca*e,*se*for*esse* o*caso,*coloqueNas*por*ordem*decrescente*de*consumo,*desde*aquela*que*o(a)*seu(sua)*filho(a)* consome*mais*para*as*que*consome*menos)* * * * 3. Com*que*frequência*costuma*conversar*com*seu*filho*sobre*alimentação*saudável?** *
1* 2* 3* 4* 5*
Muito*Frequentemente* Frequentemente* Ocasionalmente* Raramente* Nunca*
*
Obrigada*pela*sua*colaboração!* Clara Nobre Braga dos Santos, Aluna de Mestrado em Gestão
Nova School of Business and Economics Contactos: 91 286 68 73 – [email protected]
____________________________________________________________________________________
Assunto: Pedido de autorização para educando participar em estudo sobre lançamento de extensões de linha de produtos “saudáveis” (com teor reduzido de açúcares).
____________________________________________________________________________________
Exmo. Sr. Pai ou Responsável,
Sou aluna do Mestrado em Gestão da Universidade Nova de Lisboa e estou fazendo minha tese na área de comportamento do consumidor infantil. Para tal, estou estudando a relação dos adolescentes com extensões de linha saudáveis, caracterizados no meu estudo por versões com açúcar reduzido de produtos já conhecidos. O estudo visa por um lado perceber de que forma as marcas podem introduzir produtos mais saudáveis na sua gama de produtos; e como isso é valorizado pelos adolescentes ou se, pelo contrário, vai promover maiores obsessões com o controlo de peso (uma tendência recente e preocupante na adolescência). As conclusões da tese serão muito importantes quer em termos de entender o que é ético e recomendável, bem como se é necessário introduzir alguma legislação que vise a proteção da saúde pública.
Necessitava que o(a) seu filho(a) respondesse a um pequeno questionário com questões relacionadas a cereais matinais e alimentação saudável, assim como sobre a sua opinião sobre os temas de saúde e controle de peso. Tudo isto demorará cerca de 20 minutos, será feito na escola e coordenado com as aulas. Preciso ainda de algumas informações pessoais suas, a serem dadas no questionário que envio abaixo.
Os dados recolhidos serão analisados por mim e a sua confidencialidade é total, sendo apenas publicados na tese os resultados do estudo sem a referência aos dados dos alunos e sem a identificação da escola onde o estudo foi realizado (apenas será mencionado a cidade e o tipo de escola, pública ou privada). Os resultados do estudo serão enviados para a escola, podendo ser consultados por todos os encarregados de educação. Desde já agradeço a sua cooperação.
Com os melhores cumprimentos,
---
Autorizo o(a) aluno(a)________________________________________________ do _____ º ano,
turma _____ a participar neste estudo.
______________________, ______ de ________________ de 2012
______________________________________ Assinatura)do)encarregado)de)educação) )
24 II. C h il d ren ´s Q u es tio n n a ir
e
1: A w a ren es
s T
es
t
25 III. C h il d ren ´s Q u es tio n n a ir
e
2
: H
yp o th es is T es tin g – E xp er im en ta
l Gr
26 ! 3! 2.!Em!relação!a!marca!SUCRILHOS,!apresentada!abaixo,!você!a!considera:! ! ! ! ! ! ! ! ! ! ! ! Concordo!Muito! ! Concordo! ! Não!Sei! ! ! ! ! Não!Concordo! ! Não!Concordo! Nada! ! São!divertidos! ! ! ! ! ! ! São!Saborosos! ! ! ! ! ! ! Gosto! ! ! ! ! ! ! Compraria! ! ! ! ! ! ! ! 4! 2.,Hábitos,Alimentares, , 1.!Você!fez!algum!tipo!de!dieta!no!último!ano?! !
Sim Não!
!
2.!Você!pensa!em!seu!peso!quando!escolhe!o!que!vai!comer?!
Nunca!! Quase!Nunca!! As!vezes! Quase!sempre!! Sempre!
3.!Você!pensa!na!sua!saúde!quando!escolhe!o!que!vai!comer?!
Nunca!! Quase!Nunca!! As!vezes! Quase!sempre!! Sempre!
4.!Já!tentou!consumir!menos!doces!para!perder!peso?!
Sim Não!
5.!Já!saltou!refeições!com!o!objetivo!de!perder!peso?!
Sim Não!
!
6.!Já!tomou!outras!medidas!para!perda!de!peso?!Se!sim,!quais?!
Sim Não!
!
27 IV. C h il d ren ’s Q u es tio n n a ir
e
2 – C o n tr o
l Gr
28 ! 3! 4.!Em!relação!a!marca!SUCRILHOS,!apresentada!abaixo,!você!a!considera:! ! ! ! ! ! ! ! ! ! ! ! Concordo!Muito! ! Concordo! ! Não!Sei! ! ! ! ! Não!Concordo! ! Não!Concordo! Nada! ! São!divertidos! ! ! ! ! ! ! São!Saborosos! ! ! ! ! ! ! Gosto! ! ! ! ! ! ! Compraria! ! ! ! ! ! ! ! 4! 2.,Hábitos,Alimentares, , 1.!Você!fez!algum!tipo!de!dieta!no!último!ano?! !
Sim Não!
! 2.!Você!pensa!em!seu!peso!quando!escolhe!o!que!vai!comer?!
Nunca!! Quase!Nunca!! As!vezes! Quase!sempre!! Sempre!
3.!Você!pensa!na!sua!saúde!quando!escolhe!o!que!vai!comer?!
Nunca!! Quase!Nunca!! As!vezes! Quase!sempre!! Sempre!
4.!Já!tentou!consumir!menos!doces!para!perder!peso?!
Sim Não!
5.!Já!saltou!refeições!com!o!objetivo!de!perder!peso?!
Sim Não!
!
6.!Já!tomou!outras!medidas!para!perda!de!peso?!Se!sim,!quais?!
Sim Não!
!