Yougan Cheng, Hans Othmer*
School of Mathematics, University of Minnesota, Minneapolis, Minnesota, United States of America
Abstract
Chemotaxis is a dynamic cellular process, comprised of direction sensing, polarization and locomotion, that leads to the directed movement of eukaryotic cells along extracellular gra-dients. As a primary step in the response of an individual cell to a spatial stimulus, direction sensing has attracted numerous theoretical treatments aimed at explaining experimental observations in a variety of cell types. Here we propose a new model of direction sensing based on experiments usingDictyostelium discoideum(Dicty). The model is built around a reaction-diffusion-translocation system that involves three main component processes: a signal detection step based on G-protein-coupled receptors (GPCR) for cyclic AMP (cAMP), a transduction step based on a heterotrimetic G protein Gα2βγ, and an activation
step of a monomeric G-protein Ras. The model can predict the experimentally-observed response of cells treated with latrunculin A, which removes feedback from downstream pro-cesses, under a variety of stimulus protocols. We show that Ga2bgcycling modulated by
Ric8, a nonreceptor guanine exchange factor for Ga2in Dicty, drives multiple phases of Ras activation and leads to direction sensing and signal amplification in cAMP gradients. The model predicts that both Ga2and Gβγare essential for direction sensing, in that membrane-localized Ga2, the activated GTP-bearing form of Ga2, leads to asymmetrical recruitment of
RasGEF and Ric8, while globally-diffusing Gβγmediates their activation. We show that the predicted response at the level of Ras activation encodes sufficient‘memory’to eliminate the‘back-of-the wave’problem, and the effects of diffusion and cell shape on direction sens-ing are also investigated. In contrast with existsens-ing LEGI models of chemotaxis, the results do not require a disparity between the diffusion coefficients of the Ras activator GEF and the Ras inhibitor GAP. Since the signal pathways we study are highly conserved between Dicty and mammalian leukocytes, the model can serve as a generic one for direction sensing.
a11111
OPEN ACCESS
Citation:Cheng Y, Othmer H (2016) A Model for Direction Sensing inDictyostelium discoideum: Ras Activity and Symmetry Breaking Driven by a Gβγ
-Mediated, Gα2-Ric8–Dependent Signal Transduction
Network. PLoS Comput Biol 12(5): e1004900. doi:10.1371/journal.pcbi.1004900
Editor:Anand R. Asthagiri, Northeastern University, UNITED STATES
Received:December 30, 2015
Accepted:April 6, 2016
Published:May 6, 2016
Copyright:© 2016 Cheng, Othmer. This is an open access article distributed under the terms of the Creative Commons Attribution License, which permits unrestricted use, distribution, and reproduction in any medium, provided the original author and source are credited.
Data Availability Statement:All relevant data are within the paper and its Supporting Information files.
Funding:This work was supported by: National Science Foundation Division of Mathematical Science No. 9517884 and No. 131974 to HO; and the Isaac Newton Institute for Mathematical Sciences and The Simons Foundation to HO. The funders had no role in study design, data collection and analysis, decision to publish, or preparation of the manuscript.
Author Summary
Many eukaryotic cells, includingDictyostelium discoideum(Dicty), neutrophils and other
cells of the immune system, can detect and reliably orient themselves in chemoattractant gradients. In Dicty, signal detection and transduction involves a G-protein-coupled recep-tor (GPCR) through which extracellular cAMP signals are transduced into Ras activation
via an intermediate heterotrimeric G-protein (Ga2bg). Ras activation is thefirstpolarized
response to cAMP gradients in Dicty. Recent work has revealed mutiple new characteris-tics of Ras activation in Dicty, thereby providing new insights into direction sensing mech-anisms and pointing to the need for new models of chemotaxis. Here we propose a novel reaction-diffusion model of Ras activation based on three major components: one
involv-ing the GPCR, one centered on Ga2bg, and one involving the monomeric G protein Ras. In
contrast to existing local excitation, global inhibition (LEGI) models of direction sensing, in which a fast-responding but slowly-diffusing activator and a slow-acting rapidly diffus-ing inhibitor set up an internal gradient of activity, our model is based on equal diffusion
coefficients for all cytosolic species, and the unbalanced local sequestration of some species
leads to gradient sensing and amplification. We show that Ric8-modulated Ga2bgcycling
between the cytosol and membrane can account for many of the observed responses in Dicty, including imperfect adaptation, multiple phases of Ras activity in a cAMP gradient,
rectified directional sensing, and a solution to the back-of-the-wave problem.
Introduction
Many eukaryotic cells can detect both the magnitude and direction of extracellular signals using receptors embedded in the cell membrane. When the signal is spatially nonuniform they may respond by directed migration either up or down the gradient of the signal, a process called taxis. When the extracellular signal is an adhesion factor attached to the substrate or
extracellular matrix, the response is haptotaxis [1], and when it is a diffusible molecule the
pro-cess is called chemotaxis. Chemotaxis plays important and diverse roles in different organisms,
including mediation of cell-cell communication [2], in organizing and re-organizing tissue
dur-ing development and wound healdur-ing [3–5], in trafficking in the immune system [6], and in
cancer metastasis [7].
Chemotaxis can be conceptually divided into three interdependent processes: direction
sensing, polarization, and locomotion [8,9]. In the absence of an external stimulus, cells can
extend random pseudopodia and‘diffuse’locally, which is referred to as random motility [10].
Direction sensing refers to the molecular mechanism that detects the gradient and generates an
internal amplified response, providing an internal compass for the cell [11]. Polarization
temporal signalling protocols [8,16,17].
The first step of the chemotactic process involves signal transduction by GPCR’s that activate
G-proteins, which is described in detail in the following section. Activated G-proteins can in turn activate numerous pathways, and the pathway we analyze here involves Ras, which is a monomeric G protein that functions as a molecular switch that activates downstream effectors such as PI3K in its activated GTP-bound state. Activation of Ras is the earliest measurable
polarized signalling event downstream of G protein activation [14,18]. A major question from
both the experimental and the theoretical viewpoints is how the cell transduces a shallow spatial gradient of extracellular cAMP into a steeper internal gradient of activated Ras. Recent
experi-ments show that Ras activity exhibits multiple temporal phases in cAMP gradients [19]. The
first phase is transient activation of Ras that is essentially uniform over the entire cell boundary. In the second phase, symmetry is broken and Ras is reactivated exclusively at the up-gradient side of the cell. The third phase is confinement, in which the crescent of activated Ras localizes further to the region exposed to the highest cAMP. Other recent observations that are not incor-porated in existing models are as follows. Firstly, the Ras symmetry breaking does not depend
on the presence of the actin cytoskeleton—treatment of cells with latrunculin A (LatA), which
leads to depolymerization of the network—does not destroy the symmetry-breaking [19].
Sec-ondly, it was found that when two brief stimuli are applied to the same cell, the response to the second stimulus depends on the interval between the stimuli, which indicates that there is a
refractory period [20]. Other experiments show that the adaptation of Ras activation is slightly
imperfect, and Ras activity is suppressed when the chemoattractant concentration is decreasing
in time, a phenomenon called rectification [21]. Finally, it was reported that there is a persistent
memory of Ras activation, even when the cells are treated with LatA [22].
These new results are difficult to interpret in the framework of existing models, a number of
which have been proposed [11,20,22–29]. Most current models are based on an activator and
inhibitor mechanism called LEGI—local excitation, global inhibition—to explain both
direc-tion sensing and adaptadirec-tion when the chemoattractant level is held constant [30]. While these
models shed some light on direction sensing, their usefulness is limited due to the
oversimplifi-cation of the signal transduction network—as will be elaborated later. In particular, none of the
existing models incorporates sufficient mechanistic detail to satisfactorily explain the spectrum of observations described above, which provides the rationale for a more comprehensive model that enables us to test hypotheses and make predictions concerning the expected behavior of the signal transduction pathways.
The key components in the model we develop herein are the G-protein Ga2bg, RasGEF and
RasGAP, which control rapid excitation and slower adaptation of Ras, and Ric8, a guanine
nucleotide exchange factor that activates the Ga2-component of Ga2bg[31]. The model is
steps that affect actin polymerization, but we can restrict attention to the Ras dynamics and its upstream effectors because there is no known direct feedback to Ras from downstream steps
between Ras and the actin cytoskeleton. We show that Gβγmediates adaptation of Ras activity
in a uniform stimulus and transient activation in a gradient. It is also shown thatGα2
contrib-utes to the imperfect adaptation in a uniform stimulus, and that it is an essential element for
front-to-back symmetry breaking in a gradient, highlighting the important roles ofGα2and
Ga2bgcycling between the bound and dissociated states. We also show that Ric8 contributes to
the amplification of Ras activity by regulatingGα2dynamics: the reactivation of Gα2by Ric8
induces further asymmetry in Ga2bgdissociation, which in turn amplifies the Ras activity.
Finally, we investigated the effects of diffusion and cell shapes on direction sensing, and the potential role of Ric8 in the establishment of persistent Ras activation, which provides a solu-tion to the back-of-the-wave problem.
Signal transduction pathways
In light of the restriction to LatA-treated cells, the backbone of the chemotactic pathway
activated in response to changes in extracellular cAMP isΔcAMP!ΔGPCR occupation
!ΔGαβγactivation!ΔRas activity. We describe this pathway in terms of three modules: the
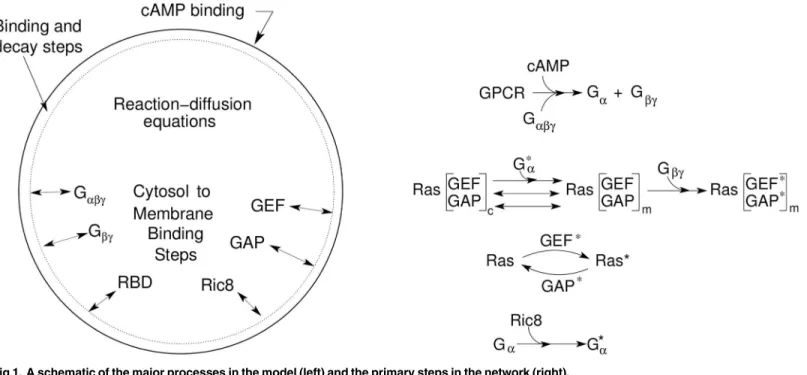
GPCR surface receptors cAR1-4, Ga2bgand Ras, as illustrated inFig 1.
The GPCR surface receptor. The first step in Dicty chemotaxis is binding of cAMP to the G-protein coupled receptors (GPCRs) cAR1-4. The four receptor types, which have different affinities, are expressed sequentially throughout the developmental transition from a unicellular to a multicellular organism. Switching of receptor subtypes enable Dicty to response to changing chemoattractant concentrations in a wide range and hence program morphogenesis
appropri-ately [32–34]. Lateral diffusion of the receptors has been suggested by observing green
fluores-cent protein (GFP)-tagged receptors in Dicty. The diffusion coefficient measured from the
movements of individual receptors is about 2.7 ±1.1 × 10⁻¹⁰cm2s−1[35], which is small at the
scale of the cell size, but which could be locally significant on the scale of structures such as blebs.
Fig 1. A schematic of the major processes in the model (left) and the primary steps in the network (right).
nals for gradient sensing, since studies show that localized responses such as Ras activation
occur upstream of PI3-kinase activity and downstream of G protein activity [18]. There are 11
Gαsubunits and a single Gβand Gγsubunit in Dicty [42]. This single Gβγsubunit is essential
for chemotactic signal transduction sincegb cells do not show any Ras activation [19] and do
not chemotact [14]. The primaryGαsubunit in chemotaxis is Ga2, sincega2cells lack an
essen-tial component of the response to cAMP, as described later [19,31].
Ligand binding to the GPCR catalyzes the exchange of GTP for GDP on the Gαsubunit,
causing the dissociation of activated G
asubunits and Gβγsubunits. Hydrolysis of GTP in Ga
induces reassociation, which reduces active G-protein subunits when the chemoattractant is
removed [8,30]. By monitoringfluorescence resonance energy transfer (FRET) between theα
andβsubunits, the membrane dynamics of the heterotrimer prior to and after simulation in
Dicty has been visualized [43,44], and it has been shown that G protein activation reaches a
persistent dose-dependent steady-state level during continuous stimulation,i.e.,no adaptation
occurs at this level [25,43].
These and other studies show that Ga2bgand Gβγsubunits cycle between the cytosol and the
plasma membrane, while the activated Gαprobably remains membrane-bound [17,45].
More-over, although asymmetric distributions of Gβγsubunits are observed in highly polarized Dicty,
in LatA-treated cells Gβγis uniformly distributed along the plasma membrane and within the
cytosol in the presence of a cAMP gradient [46], which further suggests that Gβγis also cycling
between the membrane and the cytosol. Finally, it is reported that Dicty‘resistant to inhibitors
of cholinesterase 8’(Ric8) is a nonreceptor GEF for Ga2, which convertsGa2GDP into the
acti-vatedGa2-GTP form [31]. The regulation of Ric8 activity is currently not clear, but its role as a
GEF probably involves binding of Ga2to Ric8 [31].
Ras GTPases. Ras belongs to the family of small G proteins that function as molecular switches to control a wide variety of important cellular functions. In Dicty, there are 5
charac-terized isoforms: RasS, RasD, RasB, RasC, and RasG encoded by 14 Ras family genes [8]. RasC
and RasG proteins appear to be particularly important for chemotaxis, of which RasG is the
key Ras protein in the regulation of cAMP-mediated chemotaxis [19].
In the chemotactic backbone the Ras module provides a link between G proteins and downstream pathways. Ras proteins exist in an inactive GDP-bound state and an active GTP-bound state, and conversion between these is regulated by RasGEFs and GTPase activating proteins (RasGAPs). RasGEFs catalyze the exchange of GDP for GTP, thereby activating Ras, whereas RasGAPs stimulate the GTPase activity, converting the protein into the inactive GDP-bound form. Regulation of Ras conversion by GEF and GAP includes protein-protein or protein-lipid interactions, binding of second messengers, and post-translational modifications that induce one or more of the following changes: translocation to a specific compartment of the cell, release from autoinhibition, and the induction of allosteric changes in the catalytic
domain [47]. Several methods have been developed to detect Ras protein and small GTPase
Ras-binding domain (RBD) peptide. The RBD of Raf1 only binds to the activated Ras-GTP, which enables localized visualization of Ras activity. The response of activated Ras in Dicty shows near-perfect adaptation, although some deviation from perfect adaptation can be
observed [21].
The full set of reactions and translocation steps are given inTable 1, wherein reactions and
translocations are labeled asRsandJs, respectively, and the corresponding rate laws, which
are derived by assuming mass-action kinetics for all steps, are denoted by rsandjs, respectively.
In reality the translocation of a substance between the cytosol and the membrane takes place within a layer near the membrane, but we treat this as a surface reaction. Moreover, we assume that complex formation is always fast and that a negligible amount of the factors is in the
Table 1. Kinetics and rates of the reactions.
Label and Description Kinetics Rate Reference
①ligand binding
R1:cAMPþRÐ
kþ 1
k1
R k
þ
1,k1 [35,43]
②Ga2bgcycling J
1:Gabg;mÐ
h1
h2
Gabg;c h1, h2 [17,45]
③Ga2bgdissociation R2:Gabg;mþR
!k2
G
aþGbg;mþR
k2 [8,30]
④Gβγcycling
J2:Gbg;mÐ
h3
h4
Gbg;c h3, h4 [17,45]
⑤GTPase ofG
a R3:Ga!
k3
Ga k3 [8,30]
⑥Ric8 cycling
J3:Ric8mÐ
h5
h6
Ric8 c
h5, h6 [31]
⑦Promoted Ric8 cycling J
4:Ric8cþGa!
h7
Ric8mþG
a h7 Assumed
⑧Ric8 activation R
4:Ric8mþGbg;m!
k4
Ric8þGbg;m k4 Assumed
⑨Gαreactivation R
5:Ric8
þG a!
k5
Ric8þG
a k5 [31]
⑩Ric8 inactivation R
6:Ric8
!k6
Ric8
m k6 Assumed
⑪Ga2bgreassociation R7:G
aþGbg;m!
k7
Gabg;m k7 [8,30]
⑫RasGEF cycling
J5:RasGEFmÐ
h8
h9
RasGEFc h8, h9 [49]
⑬Promoted RasGEF cycling J
6:RasGEFcþG
a!
h10
RasGEFmþG
a h10 [50–53]
⑭RasGAP cycling
J7:RasGAPmÐ
h11
h12
RasGAPc h11, h12 [47]
⑮RasGEF activation R
8:RasGEFmþGbg;m!
k8
RasGEFþG
bg;m k8 [19,28]
⑯RasGEF inactivation R
9:RasGEF
!k9
RasGEFm k9 [19,28]
⑰RasGAP activation R
10:RasGAPmþGbg;m!
k10
RasGAPþG
bg;m k10 [19,28]
⑱RasGAP inactivation R
11:RasGAP
!k11
RasGAPm k11 [19,28]
⑲Ras activation R
12:RasGEF
þRas!k12
RasGEFþRas k12 [19,28]
⑳Ras inactivation R
13:RasGAP
þRas!k13
RasGAPþRas k13 [19,28]
㉑Spontaneous Ras activation R
14:Ras!
k14
Ras k14 [19,28]
㉒Spontaneous Ras inactivation R
15:Ras
!k15
Ras k15 [19,28]
㉓RBD cycling
J8:RBDmÐ
h13
h14
RBDc
h13, h14 [19,28]
㉔Promoted RBD cycling J
9:RBDcþRas
!h15
RBDmþRas h15 [19,28]
lular space. The system is solved numerically using a finite element discretization in space and backward differentiation for the time stepping, implemented in the COMSOL multiphysics package. In the following sections, we exhibit the cell response under various stimulation
pro-tocols, and for notational simplicity, we useGαin place ofGα2when necessary. Some of the
results that will be discussed are as follows.
• Under uniform stimuli–
• The transient response
• Imperfect adaptation
• The response ofga2andric8−cells.
• Under graded stumuli–
• The origin of the biphasic Ras activation and the necessity of‘activator’diffusion
• How the magnitude of gradient amplification depends on the cAMP amplitude and
gradient
• The response ofga2andric8−cells in a gradient.
• The‘back-of-the-wave’problem.
Remarks.
• The affinities of four receptors in Dicty have been measured in various conditions [33] and
receptors have the ability of switching their affinity between high affinity and low affinity
[34]. To avoid modeling all four receptors, we model the binding with an averaged binding
affinity and dissociation rate
• The intrinsic guanosine triphosphatase (GTPase) activity ofGahydrolyses the bound GTP
on the plasma membrane, whose rate can vary depending on the influence of regulator of G
protein signalling (RGS) proteins [54,55]
• The regulation of Ric8 activity is still not clear. We assume a translocation-activation
mecha-nism here: Ric8 translocation can be promoted byGa(The scenarios of Gαpromotion and
no promotion (gα-null) are also investigated); Ric8 is activated by Gβγ,m(The scenario of
translocation-only is investigated, in which caseRic8mconverts Gαdirectly intoGa). The
simulations suggest that this activation is not essential to induce symmetry breaking
• An inactivation is introduced to balance the Ric8 activation step. In the translocation-only
Results
The response under a uniform stimulus
Gαdynamics. As previously noted, Ga2bgdissociates rapidly upon addition of
chemoattrac-tant and G
aand Gβγreach a dose-dependent steady-state level during continuous stimulation,
even though downstream responses subside [43]. The computed dose-dependent time
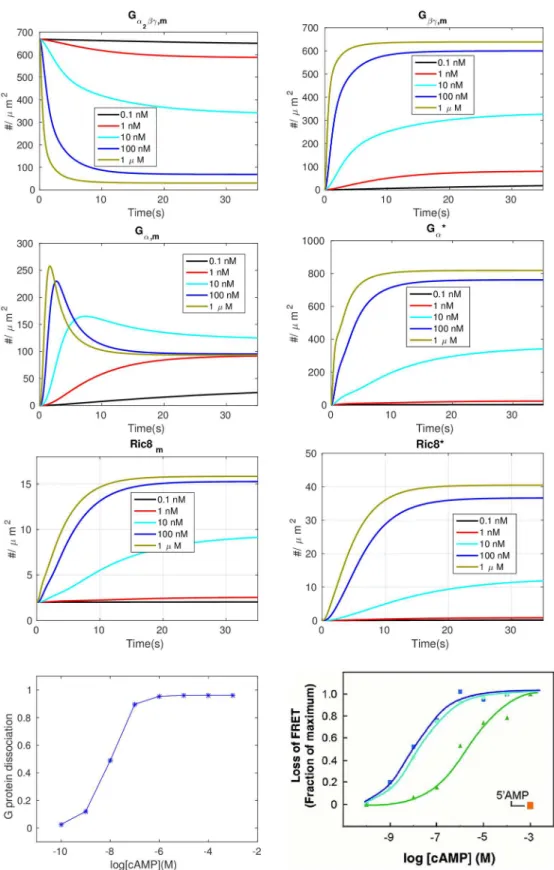
evolu-tions of Ga2bgand Gβγare shown in thefirst row ofFig 2. Under a spatially-uniform stimulus the
concentration of Ga2bgdecreases due to dissociation induced by cAMP-bound cAR, the
concen-tration of Gβγsubunits increases, and the steady state level of each is dose-dependent. The time
to reach a steady state level decreases as the cAMP increases, and at 1μMcAMP the dissociation
is stabilized within 5 seconds of activation, which is consistent with results in [43].
The dynamics of theGαsubunits are shown in the second row ofFig 2. As shown in the
right panel,Gαis activated in a dose-dependent persistent manner similar to Gβγ, butGa
reaches steady state more slowly than Gβγand the steady state concentration is higher at a
given cAMP stimulus, because both forms ofGαremain membrane-bound. Surprisingly, the
simulation shows thatGαexhibits a biphasic response when the cAMP concentration is above
a certain threshold. When the cAMP concentration is lower than 1 nM theGαconcentration
increases to the steady state monotonically, but if the cAMP concentration is greater than 10
nM theGαconcentration shows an initial overshoot and then decreases to the steady state,
which illustrates the kinetic diversity of G protein signalling [56]. Furthermore, unlike the
response of GβγandGa, for which a higher concentration of cAMP produces a higher steady
state levels of subunits, forGαthere is an optimal cAMP concentration at which the steady
state level ofGαis maximized.
In light of our assumption that Ric8 is localized on the membrane byG
aand activated by
Gβγ, it follows that the model predicts that Ric8 activation is also nonadaptative, as
demon-strated in the third row ofFig 2. In the fourth row ofFig 2we show the comparison of
dose-dependent Ga2bgdissociation between the observations in [43] and our model prediction. One
sees that the predictions matches the experimental data and both show that dissociation of
Ga2bgis saturated at 1μMcAMP.
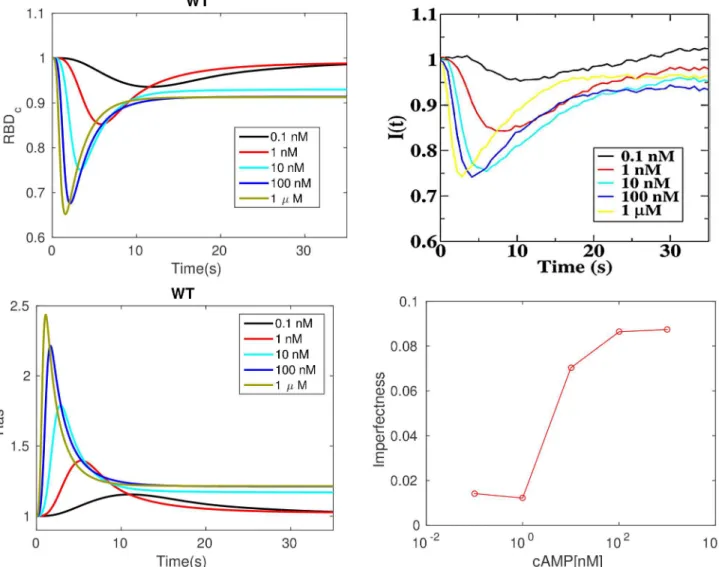
Imperfect adaptation at the level of Ras. It is suggested in [28] that adaptation of Ras activity is due to incoherent feedforward control via activation and inactivation of Ras by Ras-GEF and RasGAP, resp. Ras activation is monitored via membrane localization of RBD, which diffuses freely in the cytosol and is localized at the membrane by binding to active Ras. The comparison between the experimental results for LatA-treated cells and the model predictions
are shown in the top row ofFig 3. One sees that the model captures several basic aspects seen
in the observed Ras activation.
• After an increase in cAMP, RBD rapidly translocates to the membrane and binds toRas—
whose dynamics are shown in bottom left ofFig 3—reaching a maximum in a few seconds.
This is followed by a more gradual return to the cytosol, where RBD returns to approximately its basal level.
• The maximum response increases with increasing concentrations and saturates at about 1
μMcAMP.
• The time to the peak of theRasresponse decreases with increasing cAMP concentration.
While perfect adaptation has been confirmed in bacterial gradient sensing [57], the
Fig 2. The time course of various components under different levels of uniform stimuli.First row —Ga2bgand Gβγ:Second row—GαandG
a;Third row:—Ric8 andRic8*.Fourth row—The dose dependent dissociation at steady state. Left: model prediction;Right: Dose-response curves for cAMP (dark blue), 2’ -dcAMP(light blue), and 8-Br cAMP (green), and 5’AMP (orange) from [43] with permission.
takes place [58–60]. Although it was claimed that the adaptation is near-perfect in Dicty [28],
the experimental results in the top right panel ofFig 3show that it is not. Imperfect activation
is also reported in [21], and the degree of imperfection is quantified at various cAMP stimulus
levels there. The model also predicts imperfect adaptation, as shown in the top left panel ofFig
3, and the deviation from perfect adaptation is shown in the bottom right panel of that figure.
Both the simulations and experimental measurements show that the deviation from perfect adaptation increases with the level of stimulation and saturates at about 100 nM, and in both cases the relative deviation from perfect adaptation does not exceed 0.1.
It is suggested in [28] that the local activator and global inhibitor of a LEGI model are
RasGEF and RasGAP, respectively, and that only RasGAP diffuses in the cytosol. Our model differs from this at the level of Ras activation by incorporating a diffusion-translocation-activa-tion mechanism for both RasGEF and RasGAP. In other words, RasGEF and RasGAP are both
globally supplied through diffusion—with the same diffusion coefficients—while only
localiza-tion of RasGEF is increased by the locally constrainedG
a, resulting in stronger persistent
RasGEF activation. Consequently, RasGAP activation cannot offset this, even under
spatially-uniform stimuli, thereby inducing imperfect adaptation (see section Imperfect adaptation inS1
textfor analysis).
Refractoriness induced by subtle temporal regulation of RasGEF and RasGAP activa-tion. Refractoriness, which is a characteristic of excitable systems, has been reported for Dicty
in [20]. When two brief large stimuli are applied to the same cell, the response to the second
stimulus depends on the interval between it and the first, as shown inFig 4(right), which
sug-gests the existence of a refractory period. We repeated this experiment computationally by
applying 1μMcAMP stimuli for 2 sec (The model exhibits a maximal response to this short
saturating stimuli, see Fig. A inS1 Text) separated by increasing intervals. As shown inFig 4
(left), refractoriness is observed and the decrease in the second response decreases as the sepa-ration time increases, consistent with the experimental observations. Moreover, the peak response with a 52s delay is still weaker than the first response, both in simulation and experi-mental measurements, probably due to the fact that Ras does not adapt perfectly.
As to the refractory period, note that under large stimuli large fractions of RasGEF and Ras-GAP are activated, and when the duration between the stimuli is too short, neither RasGEF nor RasGAP can return to prestimulus levels, as shown by comparison of the left and center panels ofFig 5. As a result, the peak ratio of activated RasGEF and RasGAP decreases for short
inter-stimulus intervals as compared with long intervals, as shown in the right panel ofFig 5. Note
that the ratio for a 12 sec interval inFig 5differs from the corresponding RBD ratio inFig 4
because there is a basal, unstimulated translocation of RBD to the membrane. This indicates
Fig 4. Refractoriness under uniform stimuli.Left: Simulation. The gray bar indicates the duration of the stimulus;Right: experimental results from [20]. The black bar indicates the first stimulus. The other bars are color-coded to show the delay. All values are normalized to the peak of the first response.
doi:10.1371/journal.pcbi.1004900.g004
Fig 5. The time courses ofRasGEF*andRasGAP*for a 12s delay (left), a 52s delay (center) andRasGEF*/RasGAP*ratio for both time intervals (right).Note that the ratio reaches a peak before the two factors reach their peaks.
that refractoriness is stimulus level dependent. The refractory periods for non-saturating
cAMP stimuli are reported inS1 Text(see Fig. B inS1 Text).
ga2-null and ric8-null cells. In wild type cells, most of the Gβγcomes fromGa2bgunder
cAMP stimulation, but Gβγcan also be released from other G proteins [19]. In the absence of
quantitative data on amounts and affinities of different G proteins, we simulated the wild type
cells assuming that all G proteins dissociate and reassociate at the same rate, and that Ga
2and
Gβγare produced in a 1-1 ratio. However, some Ras response is still observed in inga2-null
cells, and to simulate these we assume that Gβγis released fromGaxbgand that the total amount
ofGβγis the same as in WT cells. Of course the total amount ofGaxbgshould be less than in WT
cells if other forms are not overexpressed in Ga2-null cells, and therefore we also did
simula-tions in which the total amount of Gβγwas reduced 90% ingα2-null cells compared to WT
lev-els. In that case the peak activation of Ras is slightly weaker, but the overall Ras activity does not change much because it is controlled by the ratio of RasGEF to RasGAP.
More precisely, we assume that when cAMP binds to a receptor,Gaxbgdissociates at the
same rate as in WT cells, and that Ric8 regulates G
axhydrolysis through spontaneous
mem-brane localization and Gβγ-mediated activation. Gaxand Gaxonly affect G protein cycling and
no other components in the network. Specifically,⑦and⑬inTable 1are disabled inga2-null
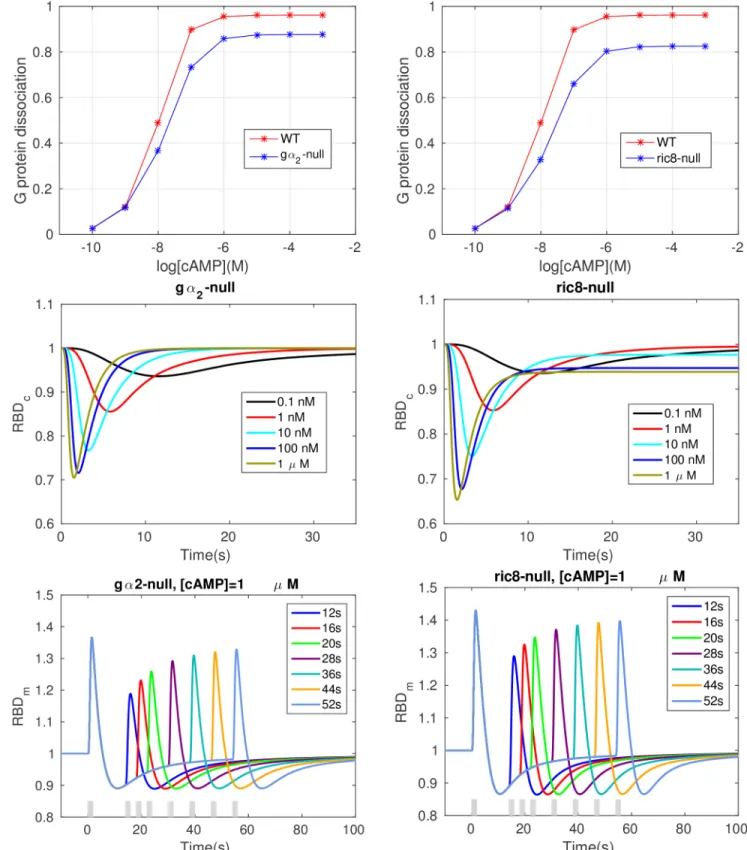
cells and⑥–⑩are disabled in ric8-null cells. As shown in thefirst row ofFig 6,Ga2bg
dissocia-tion decreases in bothga2-null cell and ric8-null cells. Note that since Ric8 translocation is not
enhanced inga2-null cells,Ga2is reactivated at a lower rateGa2in wild type cells. Consequently,
Gaxbgcycling dynamics is altered andGaxbgdissociation decreases. Similarly,ric8-null cells also
show decreased Ga2bgdissociation because there is no Ric8 binding to Gβγ.
The RBD responses are shown in the second row ofFig 6. Adaptation is perfect for any
physiologically-reasonable cAMP stimulus inga2-null cells, and the rate of Ras activation is
ini-tially the same as in WT cells, but the RBD response is less pronounced (cf.Fig 3). RasGEF
acti-vation is weaker inga2-null cells due to the absence of G
a2-promoted RasGEF recruitment, and
the incoherent feedforward circuit in the model guarantees that the activation of RasGEF and RasGAP are perfectly balanced. Hence perfect adaptation occurs and the maximum response is
reduced compared to that in WT cells, which agrees with the results in [31]. For ric8-null cells,
one sees thatric8-null cells still exhibit imperfect adaptation, sinceG
a2-promoted RasGEF
translocation still occurs, but the imperfectness is reduced due to the fact that there is no Ric8
available to reactivateGa2. Simulations show thatric8-null cells with a reducedG
a2-GTP
hydro-lysis rate approximately resemble the WT behaviors (not shown).
The bottom row shows that the refractory response is still observable in both mutant cells,
but the dependence on the time interval is less sensitive compared with WT cells. Forga2-null
cells, the change in the RBD response is less than 10% (from*1.11 to*1.2) when the
inter-val ranges from 12 to 52 seconds, compared with a 20% change (from*1.2 to*1.4) in WT
cells (Fig 4). There is less than a 10% difference in maximum response between a 12s interval
and a 52s interval (right panel, from*1.3 to*1.38) for ric8-null cells.
The response under a graded stimulus
Next we investigate how cells respond to a linear cAMP gradient along the x-axis, which we define as follows.
Cðx;y;zÞ ¼DC
Fig 6. Various cell responses in the simulatedga2-null cell and ric8-null cells.Top: Dose dependent dissociation at steady state.Middle:
whereC(x,y,z) is the cAMP concentration on the membrane atðx;y;zÞ 2S2
5(a sphere of
radius 5),ΔCCf−Cr, and subscriptsfandrdenote thepoints (5,0,0) (the‘front’) and (-5,0,0)
(the‘rear’).
Biphasic Ras activation in LatA-treated cells. It was shown in [19] that spatially-localized stimuli lead to three phases of Ras activation. In the first, which is transient, Ras isactivated on
the entire membrane, and this phase requires Gβγand exists inga2-null cells. The second phase
is symmetry breaking, in that Ras is only activated at the side of the cell facing the higher
cAMP concentration, and this phase requiresGa2. The third phase is confinement, wherein the
crescent of activated Ras at the front half of the cell localizes to a small area around the high
point of the gradient. Thefirst two phases are observed in LatA-treated cells, but the third
phase requires actin polymerization. Since the model is based on LatA- pretreated cells, we
only test whether it exhibits thefirst two phases of Ras activation.
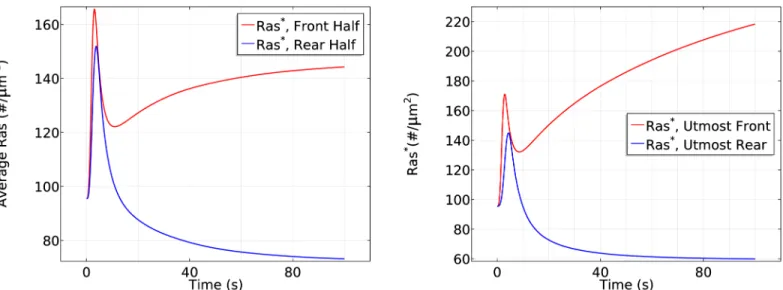
Fig 7(left) shows that the initial response is transient activation of Ras on the entire
bound-ary, which is completed in*10 s, followed by a pronounced asymmetric activation pattern.
Here and hereafter we display the average of various species at the front and rear halves of a cell because this is how experimental results are reported. In the second phase Ras is reactivated
exclusively at the front half of the cell, where the peak Rasactivation is roughly twice that at
the rear, which reflects the difference in receptor occupancy and G protein activation. Thus
symmetry breaking occurs in this phase, which is stabilized at aroundt= 100 s. The biphasic
behavior in a cAMP gradient is even more pronounced in a time plot ofRasat the antipodal
points of the gradient, as shown in the right panel ofFig 7.
The critical components that give rise to the biphasic response are several globally diffusing
molecules (Ga2bg, Gβγ,Ric8,RasGEFandRasGAP) and localized G
a2. The sequence of events
following application of the graded stimulus is as follows.
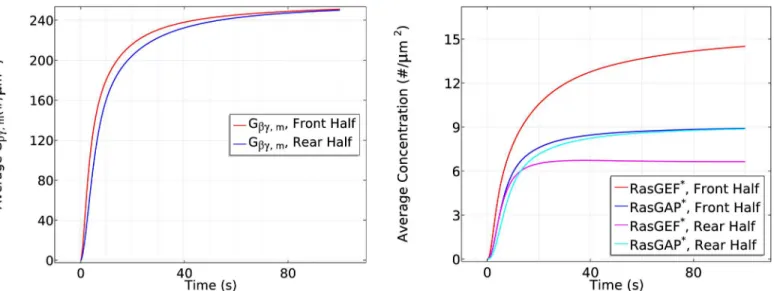
1. Ga2bgdissociation is higher at the front, resulting in more Gβγthere initially (Fig 8(left)),
but Gβγcan diffuse in the cytosol, which reduces the spatial difference. A similar difference
applies toGa2, but it remains membrane-bound.
Fig 7. The time course of averageRas*activity in a cAMP gradient defined byCf= 10 nM andCr= 1nM (left) and theRas*activity in the same gradient atxfandxr(right).
2. Gβγactivates RasGEF faster than RasGAP every where (Fig 8(right) for 0<t10s) which
favors the activation of Ras. Because the dissociation of Gαβγis higher at the front,Ras
increases faster there and induces a higher maximum.
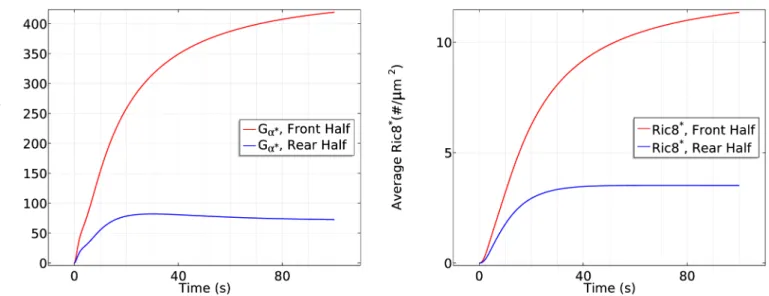
3. RasGAPactivation increases on a slower time scale, resulting in a decrease ofRas
every-where. However, the localization ofGa2at the membrane enhances translocation of RasGEF
from the cytosol to the membrane, and this is higher at the front than at the rear (Fig 9
(left)). This leads to higher RasGEF activation at the front (Fig 8(right)), which offsets the
Ras deactivation due toRasGAP, and reactivation of Ras occurs.
4. At the same time, the nonuniform distribution ofGa2on the membrane induces a
nonuni-form localization of Ric8. Although diffusion of Gβγtends to equalize Ric8 activation, this is
offset by the difference in the distribution ofGa2(Fig 9(right)). Consequently,Ga2is
reacti-vated at the front of the cell, which further promotes RasGEF localization at the front.
More-over, the asymmetricalGa2reactivation generates an asymmetricalGa2bgreassociation
profile—less reassociation at the front and more at the rear. As a result, diffusion ofGαβγ
that re-associated at the rear provides a source ofGαβγneeded at the front, which further
contributes to symmetry breaking.
5. Note that the cAMP gradient introduces a larger sink of Gαβγand a larger Gβγconcentration
at the front initially, but the diffusion of Gαβγguarantees the continuous supply at the
mem-brane as long as saturation is not reached. Moreover, the distribution of Gβγis essentially
uniform on the membrane and within the cytosol (Fig 8(left)) after*100s, as was reported
in [46]. This eventually leads to a uniform distribution ofRasGAPat the entire cell
bound-ary, butRasGEFis higher at the front due to the asymmetrical recruitment of RasGEF
from the cytosol. Ras activity at the rear of the cell decreases below the prestimulus level
because theRasGAPactivity offsets theRasGEFactivity there.
In summary, the fast time scale of Gβγ-mediated RasGEF and RasGAP activation induces
the first transient Ras activation on the entire membrane, while the slow time scale of overall
Fig 8. The time course of membrane Gβγ(left) andRasGEF*andRasGAP*(right) at the front and rear halves of the cell in the cAMP gradient
used inFig 7.
equilibration (redistributions due to diffusion and membrane localization) induces the delayed secondary response that produces the symmetry breaking.
The effects of diffusion. The results in the previous section suggest that diffusion plays an important role in inducing the biphasic response. To investigate this, we do simulations in
which the diffusion coefficients of Gβγ, RasGEF/GAP, Ga2bg, and Ric8, all of which are present
in the cytosol and diffuse, are individually set to 0.003μm2/s(10−5of the normal value) and
compare the Ras response with that in WT cells.
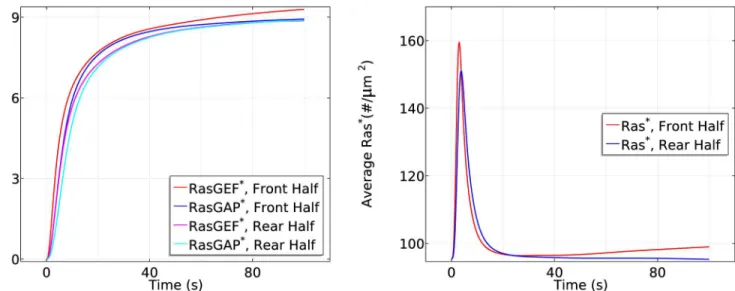
• Slow Gβγdiffusion
In the absence of apparent Gβγdiffusion after dissociation, localized Gβγleads to highly
polarized activation of RasGEF (Fig 10(left)). Correspondingly, in the transient activation
phase the peak value ofRasat the rear half is the same as in WT cells, but the peak at the
Fig 9. The time course of membraneG
a(left) andRic8*(right) at the front half andrear half in the cAMP gradient used inFig 7. doi:10.1371/journal.pcbi.1004900.g009
Fig 10. The time course ofRasGEF*andRasGAP*activity (left) andRas*activity (right) at the front and rear halves in the absence of apparent Gβγdiffusion in the same gradient as previously used.
front half increases from*165 #/μm2to*172 #μm2(cf. the right panel ofFig 10and the
left panel ofFig 7). Moreover, RasGAP activity is polarized (cf. the left panels of Figs10and
8), causing a strongerRasdeactivation at the front. Hence we observe a slightly reduced
steady state response (*140 #/μm2v.s.*143 #/μm2) in the front half during the symmetry
breaking phase of Ras activation. It is not surprising that the reduced Gβγdiffusion still
cap-tures the biphasic behavior in the sense thatGa2is still polarized and its downstream
path-ways are minimally affected. AlthoughRasGAPvaries along the cell perimeter, it is
counterbalanced by a stronger polarizedRasGEF(Note that bothRasGEFandRasGAPat
the front in the left panel ofFig 10are much larger than the ones in the right panel ofFig 8).
• Slow RasGEF diffusion: the necessity of‘activator’diffusion
The supply of RasGEF is localized on the membrane when RasGEF diffuses slowly, sinceGa2
can only attract very limited RasGEF from the cytosol very close to the membrane. Moreover,
diffusion of Gβγensures an almost uniform RasGAP and RasGEF activity at the front and the
rear at steady state. Consequently, we observe that both the front and rear half of the cell adapts to the cAMP gradient and there is no Ras reactivation at the front due to limited
avail-ability of RasGEF, as shown inFig 11. The front settles down at a slightly higher level ofRas
comparing to the rear due to a slightly stronger RasGEFactivity.
• Slow RasGAP diffusion:‘inhibitor’diffusion is not necessary
Although the supply of RasGAP is also primarily restricted to the membrane when RasGAP diffuses slowly, there is enough RasGAP on the membrane due to the relatively small mean cAMP concentration (5.5 nM) in the gradient used. As a result, the biphasic behavior is not
affected, as shown inFig 12.
In LEGI based models, the global diffusion of inhibitor is essential for inducing symmetry
breaking. It is proposed [28] that the inhibitor might be RasGAP, but our model predicts that
the diffusion of RasGAP is not a key component as long as there is sufficient amount of Ras-GAP on the membrane. Instead, a diffusible activator RasGEF becomes essential to induce symmetry breaking. In a LEGI scheme, the diffusion of inhibitor creates a uniform inhibitor distribution and the gradient induced nonuniform activator activity generates the symmetry breaking. In our model, the incoherent activation of both activator (RasGEF) and inhibitor
Fig 11. The time course of averageRasGEF*andRasGAP*activity (left) andRas*activity (right) at the front and rear halves in the absence of apparent RasGEFdiffusion in the same gradient as previously used.
(RasGAP) are induced through diffusing Gβγ. Hence the Ras activity induced by Gβγalone is
balanced along the cell. In other words, the cell can not develop a sensitive gradient sensing
from a diffusing Gβγ. Alternatively,Ga2facilitated pathways are the critical elements.
We also tested scenarios in which bothGa2bgand Ric8 diffuse slowly, and when both Gβγand
RasGEF diffuse slowly (see Fig. E–Fig. G inS1 Text). In summary, various Ras activity
pat-terns can be realized by controlling only the diffusion rates, thus revealing a potential role for diffusion in explaining the observed diverse sensitivities of genetically identical Dicty species
in response to cAMP [61].
The dependence of Ras activation on the magnitude of the gradient and the mean con-centration. To determine how the front-to-back gradient affects the activation of Ras, we
stimulate the cell using two gradients: a shallow one withcf= 6.5 nM andcr= 4.5 nM, and the
previously-used gradient withcf= 10 nM andcr= 1nM, both at the same mean cAMP
concen-tration of 5.5 nM. The cell responses are shown inFig 13. Ras activation is qualitatively similar
in both a shallow gradient and a steep gradient, but smaller in magnitude in both phases for a
shallow gradient. This is not surprising, since a steep gradient produces more Gβγlocally,
which accounts for the slightly higher initial response, and a steeperG
agradient that initiates
the second phase. Note that the front-rear difference in a steep gradient is around 70 #/μm2
while the front-rear difference in shallow gradient is around 17#/μm2, giving a ratio of*4,
which is roughly the ratio of the front-rear difference between the steep gradient (9 nM across the cell) and the shallow gradient (2 nM across the cell). Our model predicts results similar to
those reported in [19], where gradient-dependent activation of Ras is observed.
Next we test whether the cell responds differently in the same large gradient (5nM/μm) with
different mean concentrations. As shown inFig 14, in a steep gradient at a mean concentration
of 25 nM, the front and back halves respond differently in the first phase of Ras activation—the
front half reaches a maximum of 200#/μm2while the rear half only reaches a maximum of
170#/μm2. Ras is reactivated at the front when the averageRasdrops to 150#/μm2and
symme-try breaking is well established after 100 seconds of cAMP stimulation, resulting in a 3.5 fold
difference (120#/μm2) between the front half and rear halves. Surprisingly, we observe different
Fig 12. The time course of averageRasGEF*andRasGAP*activity (left) andRas*activity (right) at the front and rear halves in the absence of apparent RasGAPdiffusion in the same gradient as previously used.
response when the cell is exposed to the steep gradient at a higher mean concentration of 150 nM. In the first phase of Ras activation, the front and the rear responses almost exactly the
same—both increase to a maximum of*220#/μm2—which is followed by a decrease to
*120#/μm2. Then Ras is slowly reactivates at the front and the front-rear difference reaches
less than 20#/μm2after 100 seconds of stimulation.
It is tempting to say that symmetry breaking is strongly reduced when the mean concentra-tion increases to a saturaconcentra-tion level, but strong symmetry breaking appears and the steady state difference between front and rear halves reaches approximate 1.3 fold if we observe the cell for
a longer time, as shown inFig 15. This shows that a higher mean concentration induces a more
‘uniform’initial transient activation followed by much slower symmetry breaking.
Fig 13. The dependence of Ras activation on the magnitude of the gradient.Left: The time course of averageRas*at the front and rear halves usingcf= 6.5 nM andcr= 4.5 nM.Right: The time course usingcf= 10 nM andcr= 1 nM.
doi:10.1371/journal.pcbi.1004900.g013
Fig 14. The dependence of Ras activation on the mean concentration.Left: The time course ofRas*at the front and rear halves usingcf= 50
nM andcr= 0 nM.Right: The time course usingcf= 175 nM andcr= 125 nM.
To demonstrate the mean concentration dependence of Ras activation more clearly, we plot the Ras activation patterns in the two gradients for the first 50 seconds and the first 200
sec-onds separately inFig 16.
From the left panel ofFig 16, one sees that the reactivation of Ras starts at around 6 seconds
at a mean concentration 25nMand the front-back difference is well established att= 50s. In
contrast, Ras is barely reactivated at the front when the mean concentration is 150nMin the
first 50 seconds, but Ras is gradually reactivated at the front and the front-back difference
becomes significant att= 200s.
No symmetry breaking ingα2-null cells. It is reported [19] that ingα2-null cells, the
cAMP gradient induces a short transient uniform Ras activation but the specific upgradient
Ras reactivation never occurs. We test our model forgα2-null cells by blocking theGa2
Fig 15. It takes longer to develop significant symmetry breaking for a higher mean concentration.Left: The log scale time course of average Ras*at the front and rear halves usingcf= 175 nM andcr= 125 nM.Right: TheRas*activity in the same gradient atxfandxr.
doi:10.1371/journal.pcbi.1004900.g015
Fig 16. Mean concentration dependence of Ras activation.The solid lines correspond to a 5nM=μmgradient with mean concentration 25 nM and the dash-dot lines correspond to a 5nM=μmgradient with mean concentration 150 nM.Left: 0–50s.Right: 0–200s.
promoted RasGEF and Ric8 localization, and the simulation results are illustrated inFig 17for different gradients and same gradient with different mean concentrations. In all three gradients
we tested,gα2-null cells only exhibit the initial transient activation of Ras in consistent with the
experimentalfindings. The cell settles down at the same level ofRasat both the front and rear
of the cell, suggesting the failure of direction sensing. Both the experimental measurements
and computational simulation reveal the essential role ofG
a2in generation of direction
sensing.
No direction sensing when ric8-null cells are exposed to a shallow gradient or a steep gradient with high mean concentration. Recall that ric8-null cells have a decreased Ga2bg
dis-sociation at the steady state compared with WT cells in uniform stimulus, and here we test whether ric8-null cells are able to sense directions effectively in a cAMP gradient. Ras
activa-tion is illustrated inFig 18when ric8-nulls are exposed to gradients of the same mean
concen-trations with different steepness. Comparing with the plot in the left panel ofFig 13, the
average front-rear difference is reduced 8 fold for the shallow gradient (from*15#/μm2in
WT cells to*2#/μm2). Consistent with experimentalfindings [22], the almost identicalRas
Fig 17. The time course of averageRas*activity ingα2-null cells under various gradients.Left: The time course ofRas*at the front and rear halves usingcf= 10 nM andcr= 1 nM ingα2-null cells.Center: TheRas*activity usingcf= 50 nM andcr= 0 nM ingα2-null cells.Right:
TheRas*activity usingcf= 175 nM andcr= 125 nM ingα2-null cells.
doi:10.1371/journal.pcbi.1004900.g017
Fig 18. The time course of averageRas*activity in ric8-null cells under non-steep gradients.The time course of averageRas*at the front and rear halves in ric8-null cells.Left: The gradient set by usingcf= 6.5 nM andcr= 4.5 nM.Right: The gradient set by usingcf= 10 nM andcr= 1 nM.
activity at the front and rear suggests failure of direction sensing when ric8-null cells are exposed to a shallow gradient. The plot in the right panel suggests that the cell is still able to sense direction when the gradient is large enough, but the biphasic responses disappear.
It has been shown that ric8-null cells migrate with an efficiency similar to that of wild-type
cells when cells are exposed to a steep gradient of cAMP (>10nM/μm) [22]. We tested our
model with a gradient of 5nM/μmwith different mean concentrations, and the results are
shown inFig 19. As shown in the left figure, ric8-null cells still sense direction by creating an
asymmetrical distribution ofRas. However, the asymmetry is strongly reduced comparing to
WT cells (left panel ofFig 14). Moreover, ric8-null cells do not exhibit a biphasic response.
Instead, the front and rear half of the cell settle at different levels after initial transient activa-tion. Surprisingly, when the mean concentration is elevated to 150 nM, ric8-null cells lose the
ability to sense direction, as shown in the right panel ofFig 19(front rear difference is less that
5#/μm2). Hence our model predicts that Ric8 is essential for chemotaxis in both shallow
ents of cAMP and steep gradients with high mean concentration. In the range of cAMP gradi-ents where ric8-null cells can sense direction, our model predicts that there is no biphasic Ras activation and little amplification.
A solution to the back-of-the-wave problem
In the context of Dicty aggregation, the‘back-of-the-wave’problem refers to the fact that cells
do not turn to follow the cAMP gradient after the wave has passed, despite the fact that the
spa-tial gradient reverses as the wave passes over a cell [15,62]. This requires some level of
persis-tence of‘orientation’of a cell, but there is as yet no agreed-upon mechanistic solution for this
problem, since polarization and other factors may play a role [63]. Under uniform stimuli, cells
are said to show rectification if there is an asymmetry in the amplitude and evolution of the response to a step increase in cAMP compared with the response following removal of the
stim-ulus [21]. To test whether the proposed network exhibits rectification in this sense, we apply a
uniform stimulus of various concentrations for 60 seconds and then remove it, as was done
experimentally in fully aggregation-competent cells [21].Fig 20(left and center) show the
simu-lation and the experimental results, resp. In both cases the concentration of cAMP is increased
Fig 19. The time course of averageRas*activity in ric8-null cells under steep gradients.The time course of averageRas*at the front and rear halves in ric8-null cells in steep gradients.Left: The gradient set by usingcf= 50 nM andcr= 0 nM.Right: The gradient set by usingcf= 175 nM and
cr= 125 nM.
from 0 M to the concentrations indicated for 60 seconds (green shaded area), followed by a decrease to 0 M, and in both cases one sees a much larger and faster change in RBD following application of the stimulus than on removal. We also applied the same stimuli as used above to
gα-null cells and ric8-null cells. Results given in the Supporting Information show that Ric8
plays a significant role in the rectification, as will also be seen later in the traveling wave analysis. Some insight into this behavior can be gained from simple models of excitation and adapta-tion, such as the cartoon description defined by the system of equations
dy1
dt ¼
SðtÞ ðy1þy2Þ
te
; dy2
dt ¼
SðtÞ y2
ta
: ð1Þ
HereS(t) represents the signal and the magnitudes ofteandtareflect the time scale for excitation
and adaptation, resp., and one see thaty1adapts perfectly to a constant stimulus whereasy2
com-pensates for the stimulus. However, the temporal responses to increasing and decreasing stimuli are symmetric, and therefore such a simple model cannot explain the observed response.
Naka-jima et al. [21] suggest that a single-layered incoherent feedforward circuit with zero-order
ultra-sensitivity [64] is necessary to generate rectification, but our model does not include an
ultrasensitive circuit. Instead, rectification is induced solely by the balanced regulation of RasGEF
and RasGAP activity. The ratio ofRasGEFtoRasGAPincreases 2–4 fold very rapidly in
response to a step increase in the cAMP concentration, but when the stimulus is removed this
ratio does not drop significantly, as shown in the right panel ofFig 20. Thus Ras activation persists
because the ratio equilibrates rapidly while the absolute levels of the factors decrease more slowly. To study how cells would respond in wave-like spatially-graded stimuli, we first generate a
simple trianglular wave that approximates a natural cAMP wave. LetW(x,y,z,t) denote the
cAMP concentration at (x,y,z) of the cell at timet, and specify it as
Wðx;y;z;tÞ ¼
0; 0þ350kt xþ5
v þ350k
10 t xþ5
v 350k
; xþ5
v þ350k<t
xþ5
v þ100þ350k
10 t xþ5
v 350k
þ2000; xþ5
v þ100þ350k<t
xþ5
v þ200þ350k
0; xþ5
v þ200þ350k<t350ð1þkÞ
; 8 > > > > < > > > > :
wherevis the wave speed and−5x,y,z5,k= 0, 1, . This wave resembles a natural wave
when we choose the natural wave speedv= 5μm/s, as shown inFig 21. The wave length is
Fig 20. Rectification in WT cells.Left: The time course of membrane RBD under uniform stimuli of various concentrations.Center: experimental measurements extracted from [21].Right: The time course of the ratio ofRasGEF*toRasGAP*.
1000μm, and at the natural speed any point on a cell is subject to an increasing stimulus for
100 sec on the upstroke of the wave and a decreasing stimulus for 100 sec on the downstroke.
As shown inFig 22, Ras is activated everywhere as the wave passes, but Ras activation is
delayed about 1 sec in the rear half (Fig 22-right) for a wave traveling at the natural wave
speed. Ras activation is higher at the front of the cell than at the rear throughout passage of the wave, thereby providing persistent directionality in Ras activation and the potential for persis-tent orientation as the wave passes. It should be emphasized that we are simulating the rounded LatA-treated cells that have no intrinsic polarity, which suggests that polarity is not necessary for the persistence of direction sensing at the natural wave speed, even at the level of Ras
activ-ity. By comparing Figs20and22, one sees a similar pattern in Ras activation. In fact, due to the
rectification characteristic observed in uniform stimuli,Rasactivity does not drop
signifi-cantly in a wave, and therefore the front is able to maintain a higherRas. To determine
Fig 21. The simulated cAMP wave and a natural cAMP wave.Left: The triangle wave.Right: A natural wave—from [65] with permission. doi:10.1371/journal.pcbi.1004900.g021
Fig 22. The time course of averageRas*activity in a triangle wave at normal wave speedv= 5μm/s.
whether the cell is able to respond after the first wave passes, we applied the same wave for
three periods, and one sees inFig 23that the cell responses are almost identical for three
suc-cessive passages of a wave.
It is also known that wave speeds affect the spatial pattern of Ras activity over a cell [21], in
that Ras is activated uniformly for a fast wave, and activated at both the wavefront and
wave-back for slow waves. To test the effects of the wave speed, we apply a fast wave (50μm/s) and a
slow wave (0.5μm/s) to the rounded LatA-treated cells. The results are shown inFig 24. At a
wave speed of 50μm/s, Ras activation is uniform along the cell periphery, as is observed in the
experiments, but at 0.5μm/swe see a significant Ras reactivation at the rear of the cell and the
Rasdistribution reverses at the back of the wave.
Fig 23. Cell responses to consecutive waves.Left: The time course of the front and rear halves when three waves pass the WT cell atv= 5μm/s. Right: The time course ofRas*activity at the antipodal points.
doi:10.1371/journal.pcbi.1004900.g023
Fig 24. The time course of Ras activation at the front and rear halves for a wave speedv= 50μm/s(left), andv= 0.5μm/s(right).
In order to demonstrate the effect of wave speed on rectification more clearly, we plot the
time course of Ras activation at the front-most and rear-most points of the cell inFig 25. At a
wave speed of 0.1μm/s, Ras is reactivated at the rear of the cell when the back of the wave passes
over the rear. As the wave speed increases, the reactivation at the rear becomes weaker, and at
the normal wave speed of 5μm/spersistent directionality is well-preserved. Of course, when a
fast wave passes over the cell, Ras activation is almost spatially uniform.
As was pointed out earlier, Ric8 plays an essential role in rectification under uniform sti-muli, and to further emphasize that the back of the wave problem is closely connected with the
disparity in the response to increasingvs.decreasing stimuli, we applied the same wave used
previously to a ric8-null cell. TheRasactivity is shown inFig 26, where one sees that the
per-sistence of directional information is essentially lost. It is not surprising to see thatRasat the
front becomes smaller than the rear, which indicates a reversal in theRasdistribution, further
reinforcing the importance of the asymmetric response to increasingvsdecreasing stimuli in
solving the back of the wave problem.
Fig 25. The time course of Ras activation at the extreme front and rear points for different wave speeds.
The trade-off between persistence of directionality and the ability to
reorient
Clearly there is a trade-off between the persistence of directionality in Ras activation and the ability of cells to respond to new gradients. To investigate whether the Ric8-induced rectifica-tion has an adverse effect on reorientarectifica-tion in response to a reversed gradient, we subject cells in
a 0–100 nM gradient to reversals to increasingly weaker gradients. In each case we keep the
mean concentration experienced by the cell fixed to eliminate the mean concentration effect
(see.Fig 14). For an equally strong reverse gradient (100–0 nM), the directional persistence of
Rasis reversed within 100 seconds of gradient reversal, as shown inFig 27. The spatial profile
also indicates thatRasdistribution is strongly reversed after switching to equally strong
reversed gradients, (Fig 27–center and right). It is observed in Dicty that all cells (20/20)
reversed their direction of migration under this protocol [22]. For intermediate gradients (75–
25 nM),Rasis slightly reversed (Fig 28–left) in the same time window (0–200 s). The spatial
plot ofRasindicates spatial oscillations along the cell periphery at almost the end of the time
Fig 26. Cell responses to the triangle wave in ric8-null cells.Left: Time course of the front and rear half when the triangle wave passes the ric8-null cell atv= 5μm/s.Right: Time course of the pointRas*activity.
doi:10.1371/journal.pcbi.1004900.g026
Fig 27. The response to gradient reversal.A linear gradient of 10nM=μmwith mid point 50 nM (0–100 nM) is applied at t = 0 s and reversed at t = 100 s. The time course of averageRas*at the front and rear halves of WT cells (left) and the spatial profile ofRas*on three great circles on the sphere at t = 100 s (center) and at t = 200 s (right).
windowt= 180 s, (see Fig. M inS1 Text) suggesting spatio-temporal complexity inRas
redis-tribution. Consistently, experiments show that a fraction of the cells (5/17) did not reverse
their migration direction. For weak gradients (60–40 nM) a difference in Ras activation is still
maintained at the end of the time window (t= 200 s) (Fig 28(right)), consistent with the
obser-vation that that all cells continued moving in their original direction in this case [22]. These
simulations suggest that Ric8-induced rectification does not harm cells’reorientation in
response to large amplitude reversals of the gradient, but it delays the reorientation in a weak reversed gradient.
Variants of the model
Robustness of the Gα-Gβγ-Ric8 triangle. In the current signal transduction mechanism
Ric8 cycles between a cytosolic pool and the membrane, where it is activated by Gβγand it in
turn reactivates Gα. There is some evidence in other systems that Ric8 may not require an
acti-vation step on the membrane [66,67], and here we investigate the robustness of the Gα-Gβγ
-Ric8 triangle by considering other possibilities. For convenience in comparing schemes, we call
the current translocation-activationmechanismMode 1, and consider two alternative schemes.
• Mode 2: Translocation-only mechanism. Reaction⑧and⑩inTable 1are eliminated.⑨is
modified so thatRic8mreactivates Gαdirectly.
• Mode 3: Alternative translocation-only mechanism. We remove the activation steps as in
Mode 2, and Gαis assumed to be the membrane recruitment promoter in reaction⑦.
The simulations demonstrate thatMode 2still captures the basic characteristics of Ras
acti-vation, very similar to the results forMode 1, except that the magnitudes are slightly changed
(see Fig. I and Fig. J inS1 Text). This suggests that Gβγactivation (Reaction⑧inTable 1) is
not an essential step.
As forMode 3, it is shown that the cell is still able to sense direction and exhibit biphasic
responses under various cAMP gradients (see Fig. K and Fig. L inS1 Text). They differ from
the results inMode 1andMode 2in that the point Ras activity equilibrates more rapidly and
the magnitudes of the front-back differences are smaller.
Fig 28. The response when the reversed gradient is shallower.Left: 75–25 nM after 100 seconds.Right: 60–40 nM after 100 seconds.
whereXmis the mean value ofX.XfandXrare the concentrations ofCat the point on the cell
surface exposed to the highest and lowest concentration of stimulus, respectively. Ifσ>1,
Rasthe signal is amplified.
The amplification factors are summarized inTable 2. As one sees in the table, the signal is
amplified at the level of Ras in both Mode 1 and Mode 2, but the signal amplification indices for Mode 3 are smaller than 1, which indicates that the signal is not amplified.
There are two sources of amplification in the proposed network. Firstly, the higher
concen-tration ofG
a2on the membrane at the front of the cell induces a higher localization and
activa-tion of Ric8, which reactivatesGa2and further promotes RasGEF localization at the front.
Secondly, faster Ga2bgreassociation at the back due to higherG
a2hydrolysis induces a faster
Ga2bgcycling, providing more Ga2bgat the back. As a result, the faster reassociatedGαβγat the
back can provides a source ofGαβγneeded at the front by diffusion, which creates an
imbal-anced sequestration ofGαβγbetween the front and the back. These two positive feedback loops
are built into Mode 1 and Mode 2, but not into Mode 3.
In models based on LEGI, the local-excitation, global-inhibition mechanism provides no
signal amplification—other mechanisms have to be added [71,72]. In one speculative
mecha-nism for amplification an ultrasensitive transfer function is incorporated [21,73], but such
mechanisms are very sensitive to parameter choices [73]. LEGI and ultrasensitivity are not
bulit into our proposed network, and the positive feedback loops are responsible for the signal amplification at the level of Ras activation. Of course additional amplification can result at the
level of PIP3[61], which is activated by Ras, as will be shown in a model under investigation.
The effect of cell shape. Heretofore we have assumed that the cell is pretreated with LatA,
hence the cell is spherical with radiusr= 5μm. To investigate how cell shape may alter theRas
dynamics, we construct an ellipsoid with the same volume as that of the standard cell. By assuming that the ellipsoid is prolate, we have
a¼10mm;b¼c¼3:5mm:
To test the effect of this shape change, we applied a cAMP gradient of 1000pM/μmwith a 25
nM midpoint, and the resulting responses are shown inFig 29. The basic characteristics of Ras
activation are still maintained for an ellipsoidal cell: the cellfirst experiences a transient
Table 2. Amplification factors under various modes and gradients.
1–10 nM 0–50 nM 125–175 nM
Mode 1 1.3 1.7 2.7
Mode 2 1.6 2.0 1.6
Mode 3 0.6 0.7 0.7
activation both at the front and rear; then Ras is reactivation at the front and a clear symmetry breaking emerges.
Fig 29illustrates how cell shapes affect Ras activity. On one hand, the density of molecules is reduced when the cell is changed from a sphere to an ellipsoid with the same volume. Hence we see that the peak of first phase for an ellipsoid is smaller than for a sphere due to lower availabili-ties of molecules, although the endpoint cAMP sensed by a cell is increased from a 10 nM
differ-ence (20–30 nM) to a 20 nM (15–35 nM) difference. On the other hand, although the point
Rasat the frontal point for a ellipsoid cell is higher than a sphere cell (see right panels ofFig
29), the averageRasat the front half of the ellipsoid cell is still smaller than for the sphere cell,
suggesting that the larger gradident does not compensate for the smaller molecular densities.
Discussion
Chemotaxis is a dynamic spatio-temporal process that involves direction sensing, polarization, and cell movement, and direction sensing is the first essential step in this process, becuase it
Fig 29. Effects of cell shapes.Top: Ras activity for a ellipsoidal cell.Left: AverageRas*at front and rear half of WT cells;Right: The spatial profile ofRas*at t = 300s;Bottom: Ras activity for a sphere cell.Left: AverageRas*at front and rear half of WT cells;Right: The spatial profile of Ras*at t = 300s.
network determines Ras activation characteristics in wild type cells, how an altered network in
mutant cells changes Ras activation, and how the spatial profile and persistence of Ras
activa-tion can lead to direcactiva-tional persistence.
We proposed an experimentally-based kinetic model of Ga2bgsignaling in which the intact
Ga2bgand the Gβγsubunit can cycle between the membrane and the cytosol, while theGa2
sub-unit remains membrane-bound. Moreover,Ga2can be reactivated by the only known (to date)
GEF forGa2, Ric8. The regulation of Ric8 is not well-defined, but we assume that it is also cycles
between the cytosol and the membrane, and that its recruitment to the membrane is promoted
byG
a2. The model replicates the persistentGαβγdissociation in the presence of cAMP, and also
demonstrates that GβγandGa2are produced in a dose-dependent manner. Interestingly, the
model reveals thatGa2exhibits dose-dependent kinetic diversities. The variety ofGa2dynamics
revealed here may have important implications in direction sensing because in neutrophils
Ga2-GDP accumulates at the leading edge and is involved in regulating directionality [74],
although it has not been demonstrated that Ric8 is involved there.
Adaptation of Ras activity is controlled by a balance between RasGEF and RasGAP, both of which can cycle between the membrane and the cytosol. This component of the network involves incoherent feed-forward, and becuase both can cycle betweenmembrane and cytosol, can give rise to spatial asymmetry in Ras activation. Both RasGEF and RasGAP are activated at
the membrane by free Gβγ, but the translocation of RasGEF from the cytosol is enhanced byGa2.
The proposed translocation-activation topology is able to capture the dose-dependent Ras
acti-vation and various patterns such rectification and refractoriness under uniform stimuli. It also
predicts that imperfect adaptation is inevitable in wild type cells due to the asymmetrical
trans-location of RasGEF. Takedaet al.[28] proposed an incoherent feedforward activation model to
explain adaptation of Ras activity in which RasGEF is assumed to be confined to the membrane
and RasGAP diffuses in the cytosol. In our model, both RasGEF and RasGAP can diffuse in the
cytosol at equal rates, and both can be recruited to the membrane and activated by Gβγ.
Direction sensing, biphasic Ras activation and signal amplification are achieved by complex interactions between the modules. The incoherent-feedforward-activation by globally-diffusing
Gβγcontributes to a transient activation along the entire cell perimeter. The activation at the
front of the cell (facing the higher cAMP concentration) is initially faster and stronger due to the cAMP gradient, but it provides no symmetry breaking or signal amplification since
diffu-sion eliminates the initial Gβγconcentration gradient. This means that Gβγdoes not reflect the
external stimulus gradient and provides no basis for direction sensing in LatA-treated cells, although it is essential for RasGEF and RasGAP activation. It is the Ric8 regulated,
membrane-boundG
a2that determines the symmetry breaking and signal amplification.G
a2creates an
asymmetrical recruitment of RasGEF in a cAMP gradient, which in turn induces asymmetrical RasGEF activation, providing a basis for symmetry breaking. More importantly, Ric8
recruit-ment to the membrane is elevated byG
a2, while activated Ric8 reactivatesGa2, forming a