ACPD
7, 9687–9716, 2007Ice nucleation on surrogates of mineral
dust
C. Marcolli et al.
Title Page
Abstract Introduction
Conclusions References
Tables Figures
◭ ◮
◭ ◮
Back Close
Full Screen / Esc
Printer-friendly Version
Interactive Discussion
EGU
Atmos. Chem. Phys. Discuss., 7, 9687–9716, 2007 www.atmos-chem-phys-discuss.net/7/9687/2007/ © Author(s) 2007. This work is licensed
under a Creative Commons License.
Atmospheric Chemistry and Physics Discussions
E
ffi
ciency of immersion mode ice
nucleation on surrogates of mineral dust
C. Marcolli, S. Gedamke, T. Peter, and B. Zobrist
ACPD
7, 9687–9716, 2007Ice nucleation on surrogates of mineral
dust
C. Marcolli et al.
Title Page
Abstract Introduction
Conclusions References
Tables Figures
◭ ◮
◭ ◮
Back Close
Full Screen / Esc
Printer-friendly Version
Interactive Discussion
EGU
Abstract
A differential scanning calorimeter (DSC) was used to explore heterogeneous ice nu-cleation of emulsified aqueous suspensions of two Arizona test dust (ATD) samples with particle diameters of nominally 0–3 and 0–7µm, respectively. Aqueous suspen-sions with ATD concentrations of 0.01–20 wt% have been investigated. The DSC
ther-5
mograms exhibit a homogeneous and a heterogeneous freezing peak whose intensity ratios vary with the ATD concentration in the aqueous suspensions. Homogeneous freezing temperatures are in good agreement with recent measurements by other tech-niques. Depending on ATD concentration, heterogeneous ice nucleation occurred at temperatures as high as 256 K or down to the onset of homogeneous ice nucleation
10
(237 K). For ATD-induced ice formation Classical Nucleation Theory (CNT) offers a suitable framework to parameterize nucleation rates as a function of temperature, ex-perimentally determined ATD size, and emulsion droplet volume distributions. The lat-ter two quantities serve to estimate the total helat-terogeneous surface area present in a droplet, whereas the suitability of an individual heterogeneous site to trigger nucleation
15
is described by the compatibility function (or contact angle) in heterogeneous CNT. The intensity ratio of homogeneous to heterogeneous freezing peaks is in good agree-ment with the assumption that the ATD particles are randomly distributed amongst the emulsion droplets. The observed dependence of the heterogeneous freezing temper-atures on ATD concentrations cannot be described by assuming a constant contact
20
angle for all ATD particles, but requires the ice nucleation efficiency of ATD particles to be (log)normally distributed amongst the particles. Best quantitative agreement is reached when explicitly assuming that high-compatibility sites are rare and that there-fore larger particles have on average more and better active sites than smaller ones. This analysis suggests that a particle has to have a diameter of at least 0.1µm to
25
ACPD
7, 9687–9716, 2007Ice nucleation on surrogates of mineral
dust
C. Marcolli et al.
Title Page
Abstract Introduction
Conclusions References
Tables Figures
◭ ◮
◭ ◮
Back Close
Full Screen / Esc
Printer-friendly Version
Interactive Discussion
EGU
1 Introduction
Ice crystals in the atmosphere may form spontaneously by homogeneous nucleation of cloud droplets and aqueous aerosol particles or triggered by heterogeneous nucleation on surfaces of so-called ice nuclei (IN). Field measurements show that ice formation in cumuli- and stratiform clouds begins at temperatures much warmer than those
as-5
sociated with homogeneous ice nucleation in pure water (e.g., Hobbs and Rangno, 1985; Baker, 1997). Therefore, the partial glaciation of these clouds is ascribed to heterogeneous ice nucleation that may occur when insoluble particles come in contact with (contact freezing), are immersed in (immersion freezing) or act as cloud conden-sation nuclei for (condenconden-sation freezing) water droplets (Pruppacher and Klett, 1997).
10
Cloud droplet freezing on heterogeneous ice nuclei has been confirmed by the chemi-cal identification of aerosol particles found in the center of ice crystals. These particles are often composed of insoluble material such as fly ash, kaolinite, montmorillonite or further minerals (Kumai, 1961; Kumai and Francis, 1962; DeMott et al., 2003a), and may originate from large desert regions such as the Sahara (DeMott et al., 2003b;
15
Sassen et al., 2003).
Mineral surfaces are known to effectively initiate ice formation. Water droplets of kaolinite and montmorillonite suspensions were observed to freeze between –14◦and
–30◦C, and even higher temperatures are reported when the same nuclei induced
freezing in the contact mode (Pitter and Pruppacher, 1973). However, in these
mea-20
surements the concentration of the IN and consequently also the active surface was not quantified. Hung et al. (2003) found that the heterogeneous ice nucleation rates of am-monium sulfate solution droplets with a mineral dust core depend, beside temperature and ice supersaturation, on the size of the immersed mineral particle. Size-dependent ice nucleation efficiencies of different mineral dusts were also found when a
supersatu-25
pro-ACPD
7, 9687–9716, 2007Ice nucleation on surrogates of mineral
dust
C. Marcolli et al.
Title Page
Abstract Introduction
Conclusions References
Tables Figures
◭ ◮
◭ ◮
Back Close
Full Screen / Esc
Printer-friendly Version
Interactive Discussion
EGU
cess and by quantitatively explaining the thermograms in terms of an active-site-based model of heterogeneous nucleation.
In the derivation of a heterogeneous nucleation rate from an experimental dataset generally the stochastic hypothesis (Pruppacher and Klett, 1997; Vali, 1994; Martin, 2000) is applied, namely, that the ability to nucleate ice (its “activity”) per surface area
5
is the same for all IN, either because all IN have identical surface properties or because each aqueous droplet contains a sufficiently large number of IN so that differences in their quality even out. Under these conditions, the nucleation probability can be for-mulated analogously to the homogeneous case. In contrast, the singular hypothesis (Pruppacher and Klett, 1997; Vali, 1994; Martin, 2000) assumes that the activity of IN
10
varies and that their total number within water droplets is insufficient to ensure statistical homogeneity among the droplets. According to this hypothesis, the freezing tempera-ture of a droplet is determined by that particle in the droplet whose activity is highest. To reproduce cloud formation and precipitation, numerical models need to parameter-ize heterogeneous ice nucleation taking into account the relevant nucleation modes
15
and ice nuclei. Most models use empirical relations based on the singular hypothe-sis to parameterize the IN number concentration as functions of temperature and/or ice saturation (e.g. Cotton et al., 1986; Meyers et al., 1992, Diehl and Wurzler, 2004; Lohmann and Diehl, 2006). A further improvement of these models strongly relies on the availability of ice nucleation data that assess the spread of activation thresholds
20
within each single type of IN. To reach this aim, the freezing characteristics of droplets have to be related to the surface area of the immersed IN.
When water-oil emulsions are cooled a high number of water droplets nucleate in-dependently from each other and the freezing can be observed via the released latent heat using a differential scanning calorimeter (DSC). This technique has proven
suc-25
ACPD
7, 9687–9716, 2007Ice nucleation on surrogates of mineral
dust
C. Marcolli et al.
Title Page
Abstract Introduction
Conclusions References
Tables Figures
◭ ◮
◭ ◮
Back Close
Full Screen / Esc
Printer-friendly Version
Interactive Discussion
EGU
studies usually took the onset of the freezing peak as the ice nucleation temperature. In the present study, we attempt a full analysis of the shape of the freezing curve by taking into account the volume distribution of the water droplets in the emulsions as well as the surface of IN within the droplets and by parameterizing the results in terms of Classical Nucleation Theory (CNT, Pruppacher and Klett, 1997; Zobrist et al., 2007).
5
With such an analysis the spread of IN activity in a sample can be assessed.
We perform this analysis for two different size distributions of Arizona test dusts (ATD). ATD is composed of various mineral species and may serve as surrogate for natural mineral dust particles in the atmosphere, given its composition is similar to that of dusts originating from deserts (Krueger et al., 2005). It has also proven to be a
10
potent IN in the deposition mode (Knopf and Koop, 2006; M ¨ohler et al., 2006).
2 Experimental
2.1 Preparation of emulsions
The emulsions used in the DSC experiments consist of 80 wt% of a mixture of lanolin (Fluka Chemical) and mineral oil (Aldrich Chemical) and 20 wt% of water or an
aque-15
ous suspension of Arizona test dust (made with distilled and deionized water, 18.2 MΩ). The samples were emulsified by applying a rotor-stator homogenizer (Polytron PT 1300 D with a PT-DA 1307/2EC dispersing aggregate) for 40 s at 7000 RPM. For homogeneous freezing experiments, two droplet size distributions were investigated:
– “10-µm-droplet emulsions”: larger droplets with diameters in the range of 2–
20
20µm were obtained with 5 wt% lanolin in the lanolin/mineral oil mixture,
ACPD
7, 9687–9716, 2007Ice nucleation on surrogates of mineral
dust
C. Marcolli et al.
Title Page
Abstract Introduction
Conclusions References
Tables Figures
◭ ◮
◭ ◮
Back Close
Full Screen / Esc
Printer-friendly Version
Interactive Discussion
EGU
Approximately 30±5 mg of the emulsions was used for each DSC measurement. The
quality of the emulsions was checked in an optical microscope (Olympus BX 40).
2.2 Droplet volume distribution of emulsions
The volume distribution of water droplets in the emulsions was established by analyz-ing transmitted-light microscope images of emulsion samples prepared on an objective
5
slide. The volume distribution of the emulsion with the smaller water droplets was evaluated by counting the droplets with a bin size of 0.5µm starting from 1µm diam-eter droplets. The droplet volume distribution of the emulsions with the larger droplets was based on the evaluation of several emulsions with pure and ATD containing wa-ter droplets by counting the number of droplets with a bin size of 1µm starting from
10
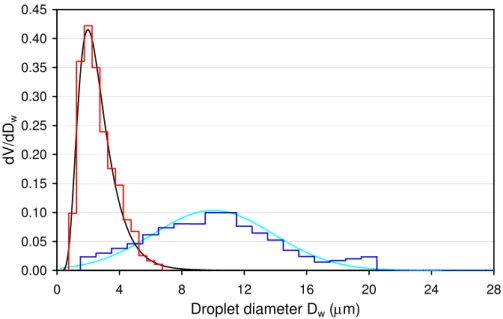
2µm diameter. The preparation procedure of the emulsions led to reproducible droplet volume distributions with no dependence on the ATD content. Therefore we used an averaged volume distribution for all emulsions prepared by the same procedure. Fig-ure 1 shows the volume distributions of the two types of emulsions. The emulsions with larger droplets were well fit by a normal distribution with median diameter and
15
variance of 10.0µm and 14.8, respectively, while the emulsions with smaller droplets corresponded better with a lognormal distribution with median diameter and geometric standard deviation of 2.40µm and 1.55, respectively. In the following, we will refer to the emulsions with smaller and larger water droplets as the 2.4-µm and the 10-µ m-droplet emulsions, respectively. For the heterogeneous freezing experiments in the
20
presence of ATD only experiments with the 10-µm-droplet emulsion were carried out.
2.3 Particle size distribution of ATD
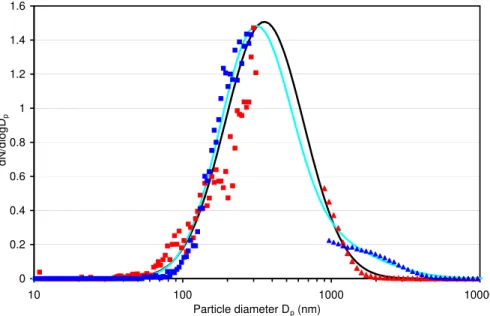
Two samples of commercially available ultra fine Arizona test dusts (ATD, Powder Tech-nology Inc.) were used in the experiments: one with nominal 0–3µm particle diameters and one with 0–7µm. In the following, we will refer to the one with 0–3µm particle
di-25
ACPD
7, 9687–9716, 2007Ice nucleation on surrogates of mineral
dust
C. Marcolli et al.
Title Page
Abstract Introduction
Conclusions References
Tables Figures
◭ ◮
◭ ◮
Back Close
Full Screen / Esc
Printer-friendly Version
Interactive Discussion
EGU
both products have the same chemical composition with SiO2and Al2O3as the main components. They have already been used to study heterogeneous ice nucleation by M ¨ohler et al. (2006; fine ATD) and by Knopf and Koop (2006; coarse ATD), who also detailed the elemental composition. The size distributions were measured with a scanning mobility particle sizer (DMA Model 3081 and CPC Model 3010, TSI) and an
5
aerodynamic particle spectrometer (APS, TSI). A bulk density of 2.6 g/cm3 was used to convert the aerodynamic diameter measured with the APS into a mobility-equivalent diameter for comparison with the SMPS data. Particles were dispersed in the air by a Fluidized Bed Generator (TSI, Model 3400A) for the APS and SMPS measurements. The measured size distribution of fine ATD has been approximated by a lognormal
10
function with a median diameter of 0.35µm and a geometric standard deviation of 1.84. For coarse ATD two superposed lognormal functions were used to fit the size distribution: 17% of one with 0.89µm median diameter and 2.2 geometric standard deviation, and 83% of one with 0.31µm median diameter and 1.73 geometric standard deviation. The measured size distributions together with the fitted ones are shown in
15
Fig. 2.
2.4 DSC measurements
Emulsion droplet freezing was studied with a differential scanning calorimeter (DSC; TA Instruments Q10) in which nucleation is detected by the latent heat released during freezing. The DSC temperature calibration was performed with the melting point of ice
20
and the ferroelectric phase transition of (NH4)2SO4at 223.1 K, leading to an accuracy of the reported freezing temperatures of ±0.5 K. The precision in temperature for a single emulsion is distinctly better than 0.2 K. In a typical DSC experiment, the first two freezing/melting cycles are run at a cooling rate of 10 Kmin−1 to check the stability of the emulsions. The third freezing cycle with a cooling rate of 1 Kmin−1 was used for
25
ACPD
7, 9687–9716, 2007Ice nucleation on surrogates of mineral
dust
C. Marcolli et al.
Title Page
Abstract Introduction
Conclusions References
Tables Figures
◭ ◮
◭ ◮
Back Close
Full Screen / Esc
Printer-friendly Version
Interactive Discussion
EGU
3 Modeling
3.1 Classical Nucleation Theory
Although far from being an accurate or ab initio description of nucleation processes, Classical Nucleation Theory (CNT) offers a suitable framework to parameterize
ho-mogeneous and heterogeneous nucleation rates as a function of temperature. It
5
expresses the homogeneous ice nucleation rate coefficient for supercooled water,
jhom(T)(Pruppacher and Klett, 1997), as
jhom(T)=
kT h exp
−∆Fdiff(T)
kT
×nvexp
−∆G(T)
kT
(1)
wherek andhare the Boltzmann and Planck constants, respectively,T is the absolute temperature,nv the number density of water molecules (typicallynv=3.1×1022cm
−3 ),
10
∆Fdiff(T) the diffusion activation energy of a water molecule to cross the water/ice
em-bryo interface, and ∆G(T) the Gibbs free energy for the formation of the critical ice embryo in the absence of a heterogeneous ice nucleus. The second term in Eq. (1) (behind the times sign) describes the concentration of critical (viable) ice embryos at the nucleus/water interface; the first term is the diffusive flux of water molecules to the
15
ice embryos during their nascency.
In CNT,∆G(T) is given by (Seinfeld and Pandis, 1998):
∆G(T)= 16π
3
υ2ice(T)σsl3 (T)
[kT lnS(T)]2 , (2)
where υice(T) is the volume of a H2O molecule in ice, σsl(T) the interfacial tension
between water and the ice embryo andS(T) the ice saturation ratio defined by
20
S(T)=pH2O(T) pice(T)
ACPD
7, 9687–9716, 2007Ice nucleation on surrogates of mineral
dust
C. Marcolli et al.
Title Page
Abstract Introduction
Conclusions References
Tables Figures
◭ ◮
◭ ◮
Back Close
Full Screen / Esc
Printer-friendly Version
Interactive Discussion
EGU
where pH2O and pi ce are the vapor pressures of supercooled liquid water and ice,
respectively. Most recent parameterizations forpH2O andpiceare given by Murphy and Koop (2005). Temperature dependent parameterization of∆Fdiff(T ),υice(T ) andσsl(T)
used here are the same as in Zobrist et al. (2007).
In a generalization of homogeneous nucleation the heterogeneous ice nucleation
5
rate coefficient has been expressed as (Pruppacher and Klett, 1997)
jhet(T)=
kT h exp
−∆Fdiff(T)
kT
×nsexp
−∆G(T) ×fhet
kT
, (4)
where ns (≈1015cm−2) is the number density of water molecules at the ice
nu-cleus/water interface and the compatibility function fhet (≤1) describes the reduction of the Gibbs energy barrier due to the presence of an ice nucleus. The compatibility
10
function may be expressed as (Seinfeld and Pandis, 1998)
fhet= 1
4(2+cosα) (1−cosα) 2.
(5)
Here, α formally represents the contact angle between the ice embryo and the ice
nucleus in an aqueous medium. The parameterαmay assume values between 0 and
180◦leading to values forfhetbetween 0 (perfect compatibility) and 1 (no compatibility), 15
respectively. Although Eq. (5) strictly applies only to plain surfaces, it is applicable here because ATD particles are much larger than the ice embryos as we will show below.
3.2 Modeling homogeneous emulsion freezing
The number of droplets freezing homogeneously in an emulsion in a time intervaltis given by
20
nhom(t)=nl(1−exp(−jhomV t)), (6)
ACPD
7, 9687–9716, 2007Ice nucleation on surrogates of mineral
dust
C. Marcolli et al.
Title Page
Abstract Introduction
Conclusions References
Tables Figures
◭ ◮
◭ ◮
Back Close
Full Screen / Esc
Printer-friendly Version
Interactive Discussion
EGU
decreased at a cooling rate of 1 Kmin−1and at each 1-s time step the fraction of frozen droplets for each droplet size class was evaluated based on Eq. (6). For the 2.4-µ m-droplet emulsion, m-droplet size bins from 0.3–7.8µm diameter with 0.3µm spacing and for the 10-µm-droplet emulsion, bins from 1–25µm diameter with 1µm spacing were calculated. The latent heat released by each droplet size class was weighted by its
5
volume fraction in the droplet volume distribution of the emulsion and then summed up. The DSC technique monitors the differential energy required to keep both a sample and a reference at the same temperature while the average temperature is changing at a constant rate. The DSC instrument is therefore sensitive to the latent heat release due to the nucleation events. When water freezes, the time dependence of latent
10
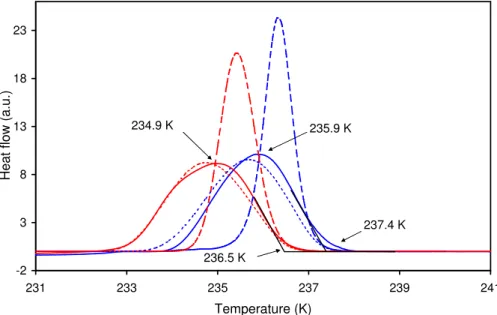
heat recorded by the DSC follows an exponential decay law (exp(−t /τ)) given by the involved heat capacities of the sample and the instrument itself. Therefore, the DSC still records a signal after the emulsion droplets are all frozen. For high enough cooling rates, the damping of the heat transfer may considerably broaden the freezing peak. Figure 3 shows that for a cooling rate of 1 Kmin−1the freezing curve returns to baseline
15
values at 232 K and 233 K for the 2.4-µm and 10-µm-droplet emulsions, respectively. When the emulsions are measured with a cooling rate of 10 Kmin−1 the heat signal peaks at 232 K and extends almost to 222 K. The comparison of freezing cycles run at these two different cooling rates allows to evaluate the time constant (τ ) of heat transfer. Whereas in the cycle run at 1 Kmin−1 nucleation is complete already above
20
232 K, the curve segment just above 230 K in the 10 Kmin−1 run is still affected by heat-induced retardation of nucleation (which we take explicitly into account), while the segment below 229 K is exclusively due to the instrumental time lag of heat transfer. We found that the latter follows indeed an exponential decay law and a fit to this curve segment results in a time constant for heat transfer ofτ=11 s.
25
ACPD
7, 9687–9716, 2007Ice nucleation on surrogates of mineral
dust
C. Marcolli et al.
Title Page
Abstract Introduction
Conclusions References
Tables Figures
◭ ◮
◭ ◮
Back Close
Full Screen / Esc
Printer-friendly Version
Interactive Discussion
EGU
the sample divided by the heat capacity of the emulsion. The latent heat released during water freezing depends on the freezing temperature (Speedy, 1987; Johari et al., 1994). At 0◦C the excess enthalpy of water,∆lsH, is 6.008 kJ mol
−1
while at –40◦C it is 4.06 kJ mol−1(Speedy, 1987). The DSC signal is therefore larger when a certain volume of water freezes at 0◦C than when it freezes at –40◦C. We account for this by
5
multiplying the freezing events with the heat release at the nucleation temperature. For convenience we fitted a fourth grade polynomial to the excess enthalpy data tabulated by Speedy (1987). The heat capacity of water increases from 75.93 J K−1mol−1at 0◦C to 116.55 J K−1mol−1 at –40◦C (Speedy, 1987). The heat capacity of mineral oil, as the main component of the emulsion, is 1.966 Jg−1K−1at room temperature (Godfrey
10
and Herguth, 1995). As a general trend, the heat capacities of hydrocarbons decrease with decreasing temperature. This decrease is∼30% for C10H22 – C20H42 hydrocar-bons over a temperature interval of 40 K (Perry and Green, 1997). The heat capacity of the emulsion should therefore be in the range of 2.0–2.5 JK−1g−1and not vary strongly with temperature. In addition, the sample pan may also accommodate a part of the
15
heat, thus increasing the effective heat capacity of the emulsion. We will therefore use the heat capacity as a fit parameter to reproduce the DSC signal in our model calcu-lations. Furthermore, we assume instantaneous heat release upon freezing using the temperature dependent excess freezing enthalpies by Speedy (1987) and removal of heat following an exponential decay law with a time constant ofτ=11 s.
20
During a high and sudden heat release, the effective cooling rate as recorded by the DSC deviates from the nominal one. For a cooling rate of 1 Kmin−1, homogeneous water freezing in an emulsion sample leads to a decrease of the effective cooling rate to∼0.6 Kmin−1 followed by an increase to∼1.7 Kmin−1 thus maintaining the nominal value of 1 Kmin−1averaged over the whole cooling ramp. In our model calculations, we
25
ACPD
7, 9687–9716, 2007Ice nucleation on surrogates of mineral
dust
C. Marcolli et al.
Title Page
Abstract Introduction
Conclusions References
Tables Figures
◭ ◮
◭ ◮
Back Close
Full Screen / Esc
Printer-friendly Version
Interactive Discussion
EGU
3.3 Modeling heterogeneous emulsion freezing
To model heterogeneous freezing of the investigated emulsions, the ATD surface area present in each droplet has to be known. This quantity can be determined from the ATD concentration in the emulsion and the size distribution of ATD particles if one as-sumes that ATD is randomly distributed between droplets. For this calculation, the
5
size distribution of ATD was divided into 80 logarithmic spaced size bins with particle diameters from 7 nm–20µm. Heterogeneous nucleation rate coefficients were deter-mined according to Eq. (4) for ATD containing droplets while homogeneous freezing was assumed for empty droplets. For heterogeneous nucleation, the number of freez-ing events in an emulsion per time intervaltis given by
10
nhet(t)=nl(1−exp(−jhetAdt)), (7)
whereAd is the ATD surface present in a droplet. Droplet freezing was evaluated for the 10-µm-droplet emulsion for bins from 1–25µm diameter at a cooling rate of 1 Kmin−1 and time steps of 1 s. For each droplet size class the freezing events for an ensemble of 1000 droplets loaded with randomly distributed ATD particles were calculated. As
15
above, the latent heat released by each droplet size class was weighted by its volume fraction in the droplet volume distribution of the emulsion and summed up over all size classes.
4 Results and discussion
4.1 Homogeneous nucleation
20
Observations
ACPD
7, 9687–9716, 2007Ice nucleation on surrogates of mineral
dust
C. Marcolli et al.
Title Page
Abstract Introduction
Conclusions References
Tables Figures
◭ ◮
◭ ◮
Back Close
Full Screen / Esc
Printer-friendly Version
Interactive Discussion
EGU
freezing curves of the 2.4-µm and 10-µm-droplet emulsions show the onset of freezing at 236.5 K and 237.4 K and peak at 234.9 K and 235.9 K, respectively. The observed freezing temperatures are in good agreement with recent literature data: Kr ¨amer et al. (1999) measured freezing temperatures between 236 and 237 K for water droplets in the 10–70µm diameter range in an electrodynamic balance and Benz et al. (2005)
5
observed in the AIDA chamber homogeneous freezing of cloud droplets with∼6µm di-ameters in the temperature range between 236 and 237.5 K. This good agreement sug-gests that nucleation rates of water-in-oil emulsions and of contact-free water droplets stem from the same nucleation mechanism, namely formation of critical embryos in the bulk of the water, and are likely not affected by the surfactant/droplet or vapor/droplet
10
interfaces. Our results are also in agreement with an older DSC study performed with water-in-oil emulsions with mean droplet diameters of 3µm and an observed freezing range from 232.65–235.65 K with the most probable freezing temperature at 234.15 K (Broto and Clausse, 1976). Furthermore, the Figure indicates that an increase of the mean droplet volume by a factor of (10/2.4)3=72 resulted in an increase of the ice
15
nucleation temperature by∼1 K, i.e. a slopedlog10(jhom)/dT ≈–1.8, which is in reason-able agreement with the slope –1.5 (±0.7) given by Koop et al. (2000).
Modeling
The dashed and dotted lines in Fig. 3 show the modeled DSC signals. The dashed lines were calculated based on the experimentally determined size distributions, a constant
20
cooling rate of 1 Kmin−1, nucleation rates parameterized with CNT and temperature de-pendent freezing enthalpy that is immediately released upon nucleation. Conversely, the dotted lines take sample heating caused by heat transfer limitation and deviation of the effective cooling rate from the nominal one into account. The dashed curves have their onsets at 236.3 and 237.1 K and peak at 235.4 and 236.3 K for the
2.4-25
ACPD
7, 9687–9716, 2007Ice nucleation on surrogates of mineral
dust
C. Marcolli et al.
Title Page
Abstract Introduction
Conclusions References
Tables Figures
◭ ◮
◭ ◮
Back Close
Full Screen / Esc
Printer-friendly Version
Interactive Discussion
EGU
taken into account, the modeled DSC signals considerably broaden and their maxima shift to 234.7 and 235.6 K for the 2.4-µm and 10-µm-droplet emulsions, respectively (dotted lines). This closely reproduces the measured curves. For this calculation, the increase of the emulsion temperature caused by heat transfer limitation was deter-mined as the difference between the latent heat released during water freezing and the
5
heat removed from the sample divided by the heat capacity of the emulsion. The heat release was described by a parameterization of experimental data (Speedy, 1987), and the heat removal by an exponential decay law with a time constantτ=11 s (see Sect. 3.2). Optimization of the heat capacity to reproduce the DSC signal yielded a value of 2.75 J K−1g−1. This value is 0.25–0.75 J K−1g−1higher than estimates based
10
on the heat capacities of water and mineral oil as the main components of the emulsion, indicating that the aluminum pan also contributes to the heat capacity of the sample. With this formulation, the emulsion temperature raises up to 1.5 K above the nominal value thus temporarily reducing the nucleation rate by up to three orders of magnitude. The effective cooling rate measured by the DSC was modeled by adding a term to the
15
nominal cooling rate that is proportional to the calculated heat signal. Optimization of the proportionality factor yielded satisfactory agreement between measured and mod-eled effective cooling rates: the observed cooling rate first decreases to a minimum value of∼0.6 Kmin−1 and then increases to ∼1.7 Kmin−1while the modeled one also
decreases first to∼0.6 Kmin−1but then increases to∼2.7 Kmin−1raising the DSC
tem-20
perature up to 0.9 K above the nominal value.
ACPD
7, 9687–9716, 2007Ice nucleation on surrogates of mineral
dust
C. Marcolli et al.
Title Page
Abstract Introduction
Conclusions References
Tables Figures
◭ ◮
◭ ◮
Back Close
Full Screen / Esc
Printer-friendly Version
Interactive Discussion
EGU
4.2 Heterogeneous ice nucleation with ATD
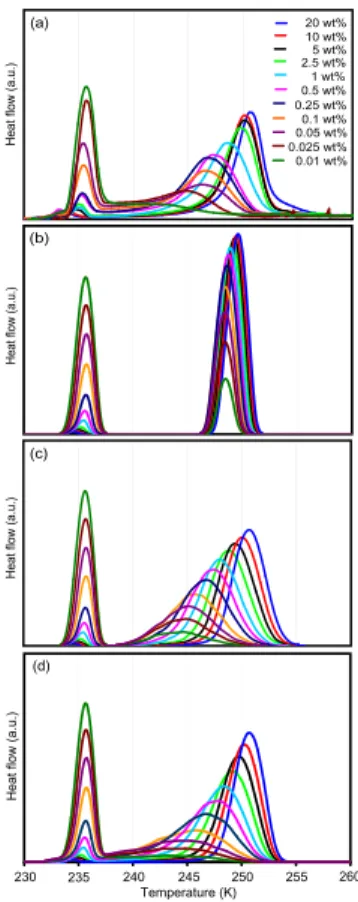
Observations
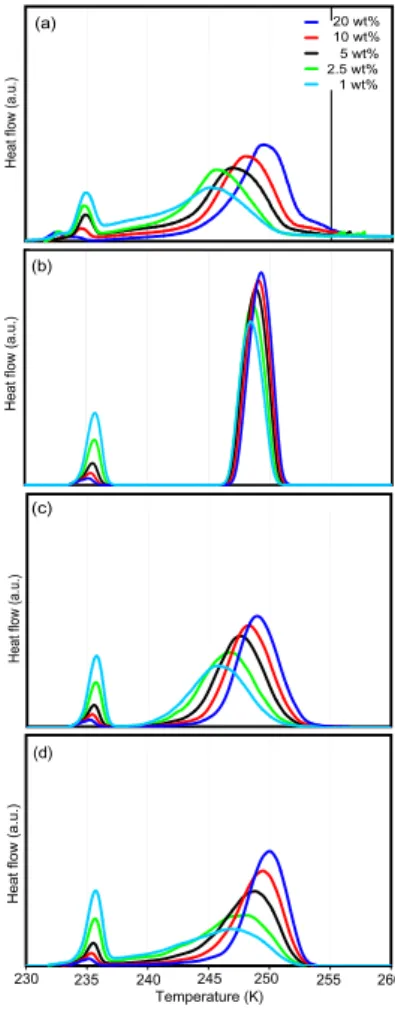
Heterogeneous ice nucleation was investigated for fine (0–3µm diameter) and coarse (0–7µm diameter) ATD. Figures 4a and 5a show the freezing of emulsified suspen-sions with ATD contents of the aqueous phase from 0.01–20 wt% and 1–20 wt% for fine
5
and coarse ATD, respectively. The presence of ATD in the emulsions leads to a sec-ond DSC peak caused by heterogeneous ice nucleation on the ATD surface at higher temperature than that of homogeneous ice nucleation. The heterogeneous freezing peaks are generally broader than the homogeneous ones, and they broaden further when the number of ATD particles per water droplet decreases. For the lowest
con-10
centrations, heterogeneous freezing extends all the way to the onset of homogeneous freezing (e.g., cyan line in Fig. 5a). The freezing peak maxima of the 1, 2.5, 5, 10, and 20 wt% suspensions are at 248.5, 249.7, 250.1, 250.2, and 250.6 K for fine ATD compared to 245.1, 245.6, 246.8, 248.0, and 249.5 K for coarse ATD. Moreover, for the same weight percent of ATD, the freezing curves of coarse ATD are broader than for
15
fine ATD. For the 20 wt% suspensions, the onset of the freezing peak is for fine and coarse ATD at 252.8 K with a weak tail extending up to 256 K. Knopf and Koop (2006) observed water droplet formation followed by freezing at 260 K when coarse ATD de-posited on a hydrophobic substrate was exposed to supersaturated water vapor. This is distinctly above the onset of freezing in our DSC experiment and indicates that for
20
this IN condensation freezing might be more efficient than immersion freezing.
For the highest ATD content almost only heterogeneous freezing occurs while emul-sions with low ATD content predominantly freeze homogeneously, since the occurrence of at least one ATD particle is a prerequisite for heterogeneous ice nucleation in an emulsion droplet. Whether this is the case strongly depends on the droplet size and
25
ACPD
7, 9687–9716, 2007Ice nucleation on surrogates of mineral
dust
C. Marcolli et al.
Title Page
Abstract Introduction
Conclusions References
Tables Figures
◭ ◮
◭ ◮
Back Close
Full Screen / Esc
Printer-friendly Version
Interactive Discussion
EGU
are predominantly empty, only 17% of the 10µm droplets contain an ATD particle and the prevailing number of droplets is only filled with 1 ATD particle. For the most concen-trated emulsion with 20 wt% fine ATD, only the smallest droplets with diameters lower than 2µm are predominantly empty. 5-µm-droplets are on average filled with 60,
10-µm-droplets with 480, and 15-µm- droplets with 1630 ATD particles. Given the same
5
mass fraction the average occupancy of water droplets is lower for the coarse ATD than for the fine one. For 1 wt% ATD suspensions, droplets are predominantly empty for diameters up to 6µm and 3µm for coarse and fine ATD, respectively.
Stochastic hypothesis
In panels b-d Figs. 4 and 5 show modeled thermograms for the emulsified suspensions
10
taking internal sample heating and limited heat conductivity into account, which leads to a considerable broadening of the large freezing peaks, while the small ones remain almost unchanged. In Figures 4b and 5b the modeled freezing curves are shown, as-suming that the ATD particles are randomly distributed in emulsion droplets and that all particles have an equal efficiency to nucleate ice described by a contact angle of
15
65◦, reproducing the measured freezing temperatures best. A change of the contact angle by 10◦results in a shift of the freezing peak position by∼5 K. Note, that changes of contact angle hardly affect the width of the freezing curves. The modeled curves represent the ratio between homogeneous to heterogeneous freezing reasonably well, thus confirming the ATD particle size and emulsion droplet volume distributions as well
20
as the assumption of random distribution of ATD between the droplets. The modeled heterogeneous freezing curves shift to slightly higher temperatures with increasing ATD content owing to the increase in heterogeneous surface. The calculated freezing peak maxima of fine ATD are 0.3 K higher than for coarse ATD, because of the larger sur-face present in the fine ATD for the same ATD mass fraction. While the widths of the
25
ACPD
7, 9687–9716, 2007Ice nucleation on surrogates of mineral
dust
C. Marcolli et al.
Title Page
Abstract Introduction
Conclusions References
Tables Figures
◭ ◮
◭ ◮
Back Close
Full Screen / Esc
Printer-friendly Version
Interactive Discussion
EGU
particles, the decrease of heterogeneous surface with decreasing ATD content alone is clearly not able to explain the strong shift to lower freezing temperatures and the concomitant broadening of the freezing curves.
Singular hypothesis: contact angle distribution
Given the above, we are forced to assume that the ability to nucleate ice differs between
5
ATD particles. The contact angle, a proxy for the IN ability of a dust particle, was there-fore allowed to vary between particles, while each individual dust particle was assumed to be characterized by only one contact angle. To describe the occurrence probability of contact angles, several probability functions were tested including linear, quadratic, cubic, box, triangle, exponential, normal and lognormal ones. Each ATD particle was
10
assigned stochastically a contact angle weighted with the occurrence probability func-tion. A water droplet containing several ATD particles will now preferentially nucleate ice on the particle with the highest IN activity, i.e. the lowest contact angle. The occur-rence probability function was optimized so that the modeled DSC curves match the measured ones best. Among the investigated functions, lognormal and normal
distri-15
butions were found to yield similarly good agreement while other functions generated DSC curves that were in clear discrepancy with measurements. Figures 4c and 5c show the modeled freezing curves for a lognormal distribution with a median contact angle of 76◦ and a geometric standard deviation of 1.083. This model is indeed ca-pable of describing the strong broadening of the freezing curve with decreasing ATD
20
content: for low ATD concentrations, the wide range of diverse IN qualities of the few particles present in an emulsion droplet produces a broad freezing curve, while for high concentrations the range of IN present in the droplets evens out. To some extent, this model is also able to explain the broader freezing peaks of coarse compared to fine ATD, although no particle size dependence of the contact angle is parameterized.
25
ACPD
7, 9687–9716, 2007Ice nucleation on surrogates of mineral
dust
C. Marcolli et al.
Title Page
Abstract Introduction
Conclusions References
Tables Figures
◭ ◮
◭ ◮
Back Close
Full Screen / Esc
Printer-friendly Version
Interactive Discussion
EGU
the onset of homogeneous nucleation. Nevertheless, the main features of the freezing curves of fine and coarse ATD can be described by the same model parameters, in-dicating that the observed differences in freezing temperatures are a consequence of the size distribution rather than differences in IN quality between coarse and fine ATD surfaces.
5
Singular hypothesis: active site distribution
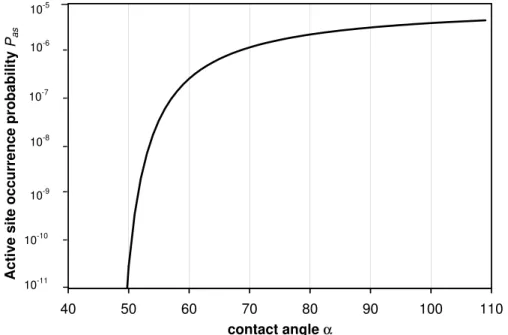
Since the assumption of contact angles varying between particles and being constant for the whole surface of a particle might not be realistic for a material like ATD, we performed a third calculation assuming that ice nucleation occurs on active sites with varying IN quality (Fletcher, 1969; Han et al., 2002). An active site area ofAas=10 nm2
10
was employed for all active sites. According to CNT this area corresponds to that covered by a critical embryo at 244 K. (We used this value at all temperatures although the critical radius varies from 1.2–3.1 nm in the temperature range from 235–255 K.) It was assumed that active sites with different ice nucleation abilities may be present
on each individual ATD particle. Again we use a contact angle α as proxy for the
15
nucleation ability of an active site. The occurrence probability (Pas) of an active site depends then on its contact angle, i.e.Pas(α). By means of this probability function, the active area of each particle can be calculated in the following way: forAas<Ap·Pas(α),
the particle’s active area with a certainα is calculated as Ap·Pas(α), where Ap is the particle’s surface area. ForAas>Ap·Pas(α), an active site is assigned to the particle,
20
if for a randomly chosen numbernr ∈[0,1] the conditionnr·Aas<Ap·Pas(α) is fulfilled;
otherwise the particle is assumed not to act as IN with contact angleα. The contact angles are inserted into Eq. (5) and the active site areas are inserted into Eq. (7) to calculate the nucleation rates.
It was found that the observed freezing curves are reproduced best when the
occur-25
ACPD
7, 9687–9716, 2007Ice nucleation on surrogates of mineral
dust
C. Marcolli et al.
Title Page
Abstract Introduction
Conclusions References
Tables Figures
◭ ◮
◭ ◮
Back Close
Full Screen / Esc
Printer-friendly Version
Interactive Discussion
EGU
function that matched the measurements best:
Pas(α)=10−5exp −51◦/(α−46◦)
(8)
This function is shown in Fig. 6. According to this probability function, only a minor part of the ATD surface acts as IN: a surface fraction of 8.2×10⁻⁷ exhibits contact angles of 60◦ or better, a fraction of 8.3×10⁻⁶ contact angles of 70◦ or better, and a fraction
5
of 1.3×10⁻⁴ contact angles of 110◦ or better. This means that particles with diame-ters of 0.16µm have on average one active site of 110◦ or better, while only particles with diameters of 0.62 and 2.0µm contain on average an active site of at least 70◦ and 60◦, respectively. In contrast to the assumption of a contact angle distribution, larger particles are now on average better IN than smaller ones because they contain
10
more and also better active sites. The low number of active sites provides ATD parti-cles with the wide range of IN activities that is needed to reproduce the large spread of freezing temperatures observed for ATD suspensions with low concentrations. The active site model is therefore able to reproduce the strong broadening of the freezing curve with decreasing ATD content including the tail extending to the onset of
homoge-15
neous nucleation. It shows a very good agreement for fine ATD. It also describes the peak broadening of coarse ATD but underestimates the shift of peak maxima to lower temperatures with decreasing ATD content.
Neither the contact angle nor the active site distribution allows to fully explain the tail to higher freezing temperatures that is visible especially in the measurements of
20
the 20 wt% suspensions. However, we did not try to further improve these models because these discrepancies might also be due to inaccuracies in droplet volume and ATD size distributions.
5 Conclusions
DSC freezing experiments with emulsified aqueous suspensions of ATD showed that
25
ACPD
7, 9687–9716, 2007Ice nucleation on surrogates of mineral
dust
C. Marcolli et al.
Title Page
Abstract Introduction
Conclusions References
Tables Figures
◭ ◮
◭ ◮
Back Close
Full Screen / Esc
Printer-friendly Version
Interactive Discussion
EGU
a homogeneous and a heterogeneous freezing peak whose intensity ratios vary with the concentration of ATD in the aqueous suspension, such that larger ATD concen-trations lead to a larger heterogeneous peak. Heterogeneous ice nucleation strongly depends on ATD concentration with freezing temperatures up to 256 K and down to the onset of homogeneous ice nucleation.
5
To model the DSC freezing curves with CNT, the ATD size and water droplet volume distributions were determined. The intensity ratio of the homogeneous to the hetero-geneous freezing peaks is consistent with the assumption of random distribution of ATD within the emulsion droplets. Excellent agreement with the measured homoge-neous freezing curves is obtained when sample heating and the deviation from the
10
nominal cooling rate due to latent heat release during freezing are taken into account. In addition, the strong dependence of heterogeneous freezing temperatures on the ATD concentration in the suspension can only be modeled by using a distribution of contact angles instead of one constant value, indicating that not all ATD particles are equal IN and reinforcing the singular hypothesis. The measured DSC curves are in
15
good agreement with the assumption that the ability of ATD particles to nucleate ice is (log)normally distributed with some particles being very good and others being poor IN. Such distributions can be realized when ice nucleation occurs on few active sites of varying quality instead of the whole ATD surface. If the occurrence probability of active sites is a function of surface area, the number and quality of active sites on a
parti-20
cle increases with particle size, making larger particles better IN than smaller ones, although the ATD surface of all particles can be described by the same nucleation pa-rameters. The active site model that yielded best agreement with the measured DSC curves implies that only a very minor fraction of the ATD surface is indeed effective as IN.
25
ACPD
7, 9687–9716, 2007Ice nucleation on surrogates of mineral
dust
C. Marcolli et al.
Title Page
Abstract Introduction
Conclusions References
Tables Figures
◭ ◮
◭ ◮
Back Close
Full Screen / Esc
Printer-friendly Version
Interactive Discussion
EGU
curves obtained for the lowest ATD concentrations might be more realistic than hetero-geneous nucleation bursts similar to the homohetero-geneous one. Parameterization within CNT offers the possibility to characterize an IN such as ATD by an occurrence probabil-ity function of contact angles that can be used to predict freezing for other suspension concentrations or in the case of the active site model, also other ATD size distributions.
5
A large IN activity range is in agreement with a recent study of ice nucleation on ATD particles in the deposition mode by Knopf and Koop (2006), who observed nucleation occurring over a broad relative humidity range. On the other hand, M ¨ohler et al. (2006) showed that significant number fractions of ATD particles are active deposition IN at very low ice supersaturations and that this fraction increases exponentially with
de-10
creasing temperature. Assuming an exponential increase of active IN with increasing contact angle leads to modeled freezing curves that are in clear contrast to the DSC signals that we observed for ice nucleation in the immersion mode. However, this discrepancy might be due to different nucleation modes and temperatures in the two studies. It highlights the importance of a detailed characterization of the parameters
15
involved in heterogeneous ice nucleation. We therefore think that further experiments and theoretical descriptions are needed to address the full activity range of these IN.
Acknowledgements. We are grateful for support by the Swiss National Fund in various projects
and by the European Commission through the integrated project SCOUT-O3.
References
20
Archuleta, C. M., DeMott, P. J., and Kreidenweis, S. M.: Ice nucleation by surrogates for atmo-spheric mineral dust and mineral dust/sulfate particles at cirrus temperatures, Atmos. Chem. Phys., 5, 2617–2634, 2005,
http://www.atmos-chem-phys.net/5/2617/2005/.
Baker, M. B.: Cloud microphysics and climate, Science, 276, 1072–1078, 1997.
25
ACPD
7, 9687–9716, 2007Ice nucleation on surrogates of mineral
dust
C. Marcolli et al.
Title Page
Abstract Introduction
Conclusions References
Tables Figures
◭ ◮
◭ ◮
Back Close
Full Screen / Esc
Printer-friendly Version
Interactive Discussion
EGU
Bertram, A. K., Koop, T., Molina, L. T., and Molina, M. J.: Ice formation in (NH4)2SO4-H2O particles, J. Phys. Chem. A, 104, 584–588, 2000.
Broto, F. and Clausse D.: A study of the freezing of supercooled water dispersed within emul-sions by differential scanning calorimetry, J. Phys. C: Solid State Phys., 9, 4251–4257, 1976. Clausse, D., Bouabdillah, D., Cochet, N., Luquet M. P., and Pulvin, S.: Ice crystallization
in-5
duced by silver iodide and bacteria in microsize droplets dispersed within emulsions, Pure Appl. Chem., 63, 1491–1494, 1991.
Clausse, D., Gomez, F., Pezron, I., Komunjer, L., and Dalmazzone, C.: Morphology charac-terization of emulsions by differential scanning calorimetry, Adv. Colloid Interface Sci., 117, 59–74, 2005.
10
Cotton, W. R., Tripoli, G. J., Rauber, R. M., and Mulvihill E. A.: Numerical simulation of the ef-fects of varying ice crystal nucleation rates and aggregation processes on orographic snow-fall, J. Climate Appl. Meteorol., 25, 1658–1680, 1986.
DeMott, P. J., Cziczo, D. J., Prenni, A. J., Murphy, D. M., Kreidenweis, S. M., Thomson, D. S., Borys, R., and Rogers, D. C.: Measurements of the concentration and composition of nuclei
15
for cirrus formation, Proc. Natl. Acad. Sci. USA, 100, 14 655–14 660, 2003a.
DeMott, P. J., Sassen, K., Poellot, M. R., Baumgardner, D., Rogers, D. C., Brooks, S. D., Prenni, A. J., and Kreidenweis S. M.: African dust aerosols as atmospheric ice nuclei, Geophys. Res. Lett., 30(14), 1732, doi:10.1029/2003GL017410, 2003b.
Diehl K. and Wurzler, S.: Heterogeneous drop freezing in the immersion mode: Model
calcula-20
tions considering soluble and insoluble particles in the drops, J. Atmos. Sci., 61, 2063–2072, 2004.
Fletcher, N. H.: Active sites and ice crystal nucleation, J. Atmos. Sci., 26, 1266–1271, 1969. Godfrey D. and Herguth, W. R.: Physical and chemical properties of industrial mineral oils
affecting lubrication, Part 2, Lubrication Engineering, 51, 493–496, 1995.
25
Han, J. H., Hung, H. M., and Martin S. T.: Size effect of hematite and corundum inclusions on the efflorescence relative humidities of aqueous ammonium nitrate particles, J. Geophys. Res., 107(D10), 4086, doi:10.1029/2001JD001054, 2002.
Hobbs P. V. and Rangno, A. L.: Ice particle concentrations in clouds, J. Atmos. Sci., 42, 2523– 2549, 1985.
30
ACPD
7, 9687–9716, 2007Ice nucleation on surrogates of mineral
dust
C. Marcolli et al.
Title Page
Abstract Introduction
Conclusions References
Tables Figures
◭ ◮
◭ ◮
Back Close
Full Screen / Esc
Printer-friendly Version
Interactive Discussion
EGU
Johari, G. P., Fleissner, G., Hallbrucker, A., and Mayer, E.: Thermodynamic continuity between glassy and normal water, J. Phys. Chem., 98, 4719–4725, 1994.
Knopf, D. A. and Koop T.: Heterogeneous nucleation of ice on surrogates of mineral dust, J. Geophys. Res., 111, D12201, doi:10.1029/2005JD006894, 2006.
Koop, T., Bertram, A. K., Molina, L. T., and Molina M. J.: Phase transitions in aqueous NH4HSO4
5
solutions, J. Phys. Chem. A, 103, 9042–9048, 1999.
Koop, T., Luo, B. P., Tsias, A., and Peter, T.: Water activity as the determinant for homogeneous ice nucleation in aqueous solutions, Nature, 406, 611–614, 2000.
Kr ¨amer, B., H ¨ubner, O., Vortisch, H., W ¨oste, L., Leisner, T., Schwell, M., R ¨uhl, E., and Baumg ¨artel, H.: Homogeneous nucleation rates of supercooled water measured in single
10
levitated microdroplets, J. Chem. Phys., 111, 6521–6527, 1999.
Krueger, B. J., Grassian, V. H., Cowin, J. P., and Laskin, A.: Erratum to ”Heterogeneous chem-istry of individual mineral dust particles from different dust source regions: The importance of particle mineralogy”, Atmos. Environ., 39, 395, 2005.
Kumai, M.: Snow crystals and the identification of the nuclei in the northern United States of
15
America, J. Meteorol., 18, 139–150, 1961.
Kumai M. and Francis, K. E.: Nuclei in snow and ice crystals on the Greenland Ice Cap under natural and artificially stimulated conditions, J. Atmos. Sci., 19, 474–481, 1962.
Lohmann, U. and Diehl, K.: Sensitivity studies of the importance of dust ice nuclei for the indirect aerosol effect on stratiform mixed-phase clouds, J. Atmos. Sci., 63, 968–982, 2006.
20
Martin, S. T.: Phase transitions of aqueous atmospheric particles, Chem. Rev., 100, 3403– 3453, 2000.
Meyers, M. P., DeMott, P. J., and Cotton, W. R.: New primary ice-nucleation parameterizations in an explicit cloud model, J. Appl. Meteorol., 31, 708–721, 1992.
M ¨ohler, O., Field, P. R., Connolly, P., Benz, S., Saathoff, H., Schnaiter, M., Wagner, R., Cotton,
25
R., Kr ¨amer, M., Mangold, A., and Heymsfield, A. J.: Efficiency of the deposition mode ice nucleation on mineral dust particles, Atmos. Chem. Phys., 6, 3007–3021, 2006,
http://www.atmos-chem-phys.net/6/3007/2006/.
Murphy, D. M. and Koop, T.: Review of the vapour pressures of ice and supercooled water for atmospheric applications, Quart. J. R. Met. Soc., 131, 1539–1565, 2005.
30
Perry, R. H. and Green, D. W. (Eds.): Perry’s chemical engineers’ handbook, 7th ed., McGraw-Hill, New York, 2-94–2-98, 1997.
ACPD
7, 9687–9716, 2007Ice nucleation on surrogates of mineral
dust
C. Marcolli et al.
Title Page
Abstract Introduction
Conclusions References
Tables Figures
◭ ◮
◭ ◮
Back Close
Full Screen / Esc
Printer-friendly Version
Interactive Discussion
EGU
falling at terminal velocity in air, Quart. J. R. Met. Soc., 99, 540–550, 1973.
Pruppacher, H. R. and Klett, J. D.: Microphysics of clouds and precipitation, Kluwer, Dordrecht, 1997, pp. 191–209 and 309–355.
Rasmussen, D. H. and MacKenzie, A. P.: Effect of solute on ice-solution interfacial free energy; calculation from measured homogeneous nucleation temperatures, in: Water structure at
5
the water polymer interface, edited by: Jellinek, H. H. G., 126–145, Plenum Press, New York (1972).
Sassen, K., DeMott, P. J., Prospero, J. M., and Poellot M. R.: Saharan dust storms and indi-rect aerosol effects on clouds: CRYSTAL-FACE results, Geophys. Res. Lett., 30(12), 1633, doi:10.1029/2003GL017371, 2003.
10
Seinfeld, J. H. and Pandis, S. N.: Atmospheric Chemistry and Physics, Wiley, New York, 545– 595, 1998.
Speedy, R. J.: Thermodynamic properties of supercooled water at 1 atm, J. Phys. Chem., 91, 3354–3358, 1987.
Vali, G.: Freezing rate due to heterogeneous nucleation, J. Atmos. Sci., 51, 1843–1856, 1994.
15
Zobrist, B., Weers, U., and Koop T.: Ice nucleation in aqueous solutions of poly[ethylene glycol] with different molar mass, J. Chem. Phys., 118, 10 254–10 261, 2003.
Zobrist, B., Marcolli, C., Koop, T., Luo, B. P., Murphy, D. M., Lohmann, U., Zardini, A. A., Krieger, U. K., Corti, T., Cziczo, D. J., Fueglistaler, S., Hudson, P. K., Thomson, D. S., and Peter T.: Oxalic acid as a heterogeneous ice nucleus in the upper troposphere and its indirect aerosol
20
effect, Atmos. Chem. Phys., 6, 3115–3129, 2006,
http://www.atmos-chem-phys.net/6/3115/2006/.
Zobrist, B., Koop, T., Luo, B. P., Marcolli, C., and Peter, T.: Heterogeneous ice nucleation rate coefficient of water droplets coated by a nonadecanol monolayer, J. Phys. Chem. C, 111, 2149–2155, 2007.
25
ACPD
7, 9687–9716, 2007Ice nucleation on surrogates of mineral
dust
C. Marcolli et al.
Title Page
Abstract Introduction
Conclusions References
Tables Figures
◭ ◮
◭ ◮
Back Close
Full Screen / Esc
Printer-friendly Version
Interactive Discussion
EGU 0.00
0.05 0.10 0.15 0.20 0.25 0.30 0.35 0.40 0.45
0 4 8 12 16 20 24 28
Droplet diameter Dw (μm)
dV/dD
w
Fig. 1. Normalized volume distribution of water-in-oil emulsions: microscopically determined
ACPD
7, 9687–9716, 2007Ice nucleation on surrogates of mineral
dust
C. Marcolli et al.
Title Page
Abstract Introduction
Conclusions References
Tables Figures
◭ ◮
◭ ◮
Back Close
Full Screen / Esc
Printer-friendly Version
Interactive Discussion
EGU
0 0.2 0.4 0.6 0.8 1 1.2 1.4 1.6
10 100 1000 10000
Particle diameter Dp (nm)
dN
/dlogD
p
Fig. 2.Normalized number distributions of Arizona test dust (ATD): measured size distributions
ACPD
7, 9687–9716, 2007Ice nucleation on surrogates of mineral
dust
C. Marcolli et al.
Title Page
Abstract Introduction
Conclusions References
Tables Figures
◭ ◮
◭ ◮
Back Close
Full Screen / Esc
Printer-friendly Version
Interactive Discussion
EGU
-2 3 8 13 18 23
231 233 235 237 239 241
Temperature (K)
Heat flow (a.u.)
237.4 K
236.5 K
235.9 K 234.9 K
Fig. 3. Freezing experiment of water-in-oil emulsions with the 2.4-µm (red) and 10-µm (blue)
ACPD
7, 9687–9716, 2007Ice nucleation on surrogates of mineral
dust
C. Marcolli et al.
Title Page
Abstract Introduction
Conclusions References
Tables Figures
◭ ◮
◭ ◮
Back Close
Full Screen / Esc
Printer-friendly Version
Interactive Discussion
EGU
Temperature (K)
Heat flow (a.u.)
(d)
230 235 240 245 250 255 260
H
e
a
t
flo
w
(
a
.u
.)
(c)
Heat
flow
(a.u.)
(b)
Heat flow (a.u.)
20 wt% 10 wt% 5 wt% 2.5 wt% 1 wt% 0.5 wt% 0.25 wt% 0.1 wt% 0.05 wt% 0.025 wt% 0.01 wt%
(a)
Fig. 4. Ice nucleation of fine ATD.(a)DSC thermograms of freezing experiments with nominal
cooling rate of 1 Kmin−1 of emulsified aqueous suspensions of fine ATD with concentrations from 0.01–20 wt%. Right group of freezing peaks: heterogeneous nucleation; left peaks: re-maining homogeneous nucleation. (b) Modeled thermograms including heat-release-induced deviations from the nominal cooling rate and assuming a constant contact angle of 65◦. (c)
Modeled thermograms as in (b), but assuming a lognormal size distribution of contact angles.
ACPD
7, 9687–9716, 2007Ice nucleation on surrogates of mineral
dust
C. Marcolli et al.
Title Page
Abstract Introduction
Conclusions References
Tables Figures
◭ ◮
◭ ◮
Back Close
Full Screen / Esc
Printer-friendly Version
Interactive Discussion
EGU
Temperature (K)
Heat flow (a.u.)
(d)
230 235 240 245 250 255 260
Heat
flow
(a.u.)
(c)
H
e
a
t
fl
o
w
(
a
.u
.)
(b)
Heat
flow
(a.u.)
20 wt% 10 wt% 5 wt% 2.5 wt% 1 wt%
(a)
Fig. 5. Ice nucleation of coarse ATD.(a)DSC freezing experiment of emulsified aqueous
sus-pensions of coarse ATD with concentrations from 1–20 wt%.(b)Modeled freezing curve with a constant contact angle of 65◦
ACPD
7, 9687–9716, 2007Ice nucleation on surrogates of mineral
dust
C. Marcolli et al.
Title Page
Abstract Introduction
Conclusions References
Tables Figures
◭ ◮
◭ ◮
Back Close
Full Screen / Esc
Printer-friendly Version
Interactive Discussion
EGU
40 50 60 70 80 90 100 110
contact angle α
Active site occurrence probability
Pas
10-11 10-10 10-9 10-8 10-6
10-7 10-5
Fig. 6. Occurrence probability of active sites as a function of contact angle α. This function