Research Article
Investigations to Model and Analyse the OHC Strength of Hybrid Composites
K. Mohamed Kaleemulla1,*, B. Siddeswarappa2, K. G. Satish2
1Department of Mechanical Engineering, University B.D.T. College of Engineering, Davangere 577004, India. 2Department of Industrial and Production Engineering, University B.D.T. College of Engineering, Davangere 577004, India.
Received 7 May 2009; Revised 19 July 2009; Accepted 22 August 2009
Abstract
In recent years, the utilization of hybrid polymer matrix composite materials in many engineering ields has increased
tremendously. The present investigation is devoted on fabric-reinforced hybrid composite laminates with different volume fractions of the constituent materials; epoxy resin, plain-woven glass fabric, and textile satin fabric. Fracture toughness of a material has immense importance in the determination of the resistance of the material to crack propagation. Hence this
article explores the indings of the experimentation on the compressive strength and fracture toughness of fabric-reinforced
laminates with 0/90O
& ± 45O orientation with ive notch conigurations. The fracture toughness has been found to increase continuously with increased volumes of glass fabric and it is less dependent on notch size upto certain limit. Data collected during experimentations are validated using analysis of variance (ANOVA) technique. Percentage contribution of each
pa-rameter was evaluated using ANOVA technique with iber content, orientation and notch size as input papa-rameters, while the
output parameter being the OHC strength of the laminate.
Keywords: Open hole compression, fracture toughness; woven hybrid composite; glass fabric; textile satin fabric.
Journal of Engineering Science and Technology Review 2 (1) (2009) 91-98
Technology Review
www.jestr.org
The most common method of assembling composite structure is by the use of mechanical fasteners, even though bolted joints are
rela-tively ineficient. The stress concentration due to the hole will cause
substantial reduction in strength and stability of notched compos-ite laminates. The magnitude of this reduction varies considerably with a multitude of factors. All composite materials that exhibit a linear elastic stress-strain relationship to failure will be very sensi-tive to notches. Unlike metallic materials, the effects of the notch on strength will vary with the size of the notch but are relatively independent of notch geometry (Ref 1).
Under compression, distribution of stresses occurs around the geometrical constraints like holes, reduced cross section, disconti-nuities, etc. The peak stress reaches a much larger magnitude than the average stress over the section. The stress is affected by the geo-metrical shape of the irregularities as well as by the dimensions of the irregularities. The presence of a hole in a specimen under load
introduces three effects; irst, there is an increase or concentration of
stress at the root of the notch. Second, Stress gradient is set up from root of the notch toward the centre of the specimen and the third, a triaxial state of stress is produced at the notch root (Ref 2).
The hardness of the specimen as well as the geometrical shape and dimensions of notch affect the stress concentration factor. The factor of the material with higher hardness is larger than that of the
material with low hardness (Ref 3, 4). The notch root radius governs the relative elastic stress distribution near the notch root predomi-nantly only. Both the maximum elastic stress and the notch root radius determine the yielded zone size near the notch root (Ref 5). The severity of stress concentration initiates propagation of cracks, causing the fracture of material. Fracture in all materials, brittle or ductile, homogeneous or composites, is governed more or less by discontinuities and imperfections, such as cracks, notches, inclu-sions or dispersed phases (Ref 6, 7).
Material strength may be correlated with its fracture energy, elastic modulus, and the size of the crack initiating the fracture. In this domain, the fracture toughness of the material has a major role in the determination of the fracture behaviour and resistance of the
material to crack propagation under the inluence of an external
load. The material cannot be used without analysing the fracture be-haviour or ultimate strength of structure. In assessing the strength of a structural element, fracture mechanics provides a greater insight when a crack-like defect is explicitly taken into account. Central to the process is the determination of stress intensity factor, which is a function of the geometry of the structure and the character of the load. The advent of fracture mechanics (Ref 8-10) has accelerated the methods for determination of crack growth rate and maximum allowable damage at limit load conditions.
Hence, the degradation of strength of composite materials in presence of central holes must be understood precisely under any
situation for the wider application. Hybrid composites are inding * E-mail address: [email protected]
ISSN: 1791-2377 © 2009 Kavala Institute of Technology. All rights reserved.
as well as other cladding situations, and more particularly fabric-re-inforced composites are used in case of thin-walled structures. Thus the understanding of the fracture behaviour and prediction of frac-ture toughness of composite materials have assumed greater impor-tance. One of the accepted methods of analysing fracture behaviour is the application of Linear Elastic Fracture Mechanics (LEFM) (Ref 10), where the attention is focused on exploring the fracture
mechanism at the crack tip of the ibre composites. A number of
methods, both experimental and analytical, have been suggested by researchers (Ref 11-13) for the assessment of fracture strength as well as life prediction of composite materials.
Estimating the fracture load of notched plates has more or less
been established and the inluence of related parameters like width
and thickness of specimen, notch geometry, notch angle, notch root radius, and notch depth have widely been studied (Ref 14-16). Thus, the determination of the stress intensity factor has become manda-tory for solving the problems like residual strength analysis, fatigue crack growth rate and stress corrosion mechanism.
In this context, an extensive experimental investigation of open
hole compression tests for different hole sizes, ibre orientations and ibre content has been carried out on fabric reinforced composite
materials. In this article, the effects of selected parameters on frac-ture toughness (KI) have been determined.
2. Methodology
LEFM assumes that a linear elastic test specimen with an intro-duced crack will fracture under stress, and describes the energy changes that occur during the advance and growth of the origi-nal crack. Polymeric composite materials are described as hav-ing visco-elastic properties, accordhav-ing to which the parameter of
paramount signiicance is the KI, fractural toughness, the material’s
ability to withstand propagation of inherent defects (Ref 6, 17). The determination of the stress intensity factor has acquired con-siderable importance in the analysis of residual strength, fatigue crack growth rate and stress corrosion of composite materials, and thereby in determination of strength of the material. The stress
in-tensity factor may be deined in terms of amplitude or strength of
the stress singularity and is dependent on the state of stress at the crack tip. The stress intensity factor is therefore, obviously found to be dependent on radius of crack-tip, angle of crack and the dis-tribution of the stresses for each mode, mentioned earlier. Thus, the applied load and size of the crack determines the stress intensity factor on the specimen (Ref 18).
In the case of lat compressive fractures, the forward mode as
well as the parallel mode, crack surface displacements are found to be generally absent and therefore, the stress intensity factors in the opening mode may only be considered.
3. Experimental 3.1 Materials
The present investigation has been carried out on three materials; epoxy resin, plain-woven glass fabric, and textile satin fabric. The matrix material was Araldite Epoxy Resin LY556 and hardener
curing cycle of 48 hours duration. Properties of the cured neat epoxy are listed in Table 1.
In order to produce hybrid composite laminates, Plain weave
E-glass fabric was used as the irst reinforcement material. The
candidate material has areal density range between 110-122gsm,
with 4 mil fabric and the ibers in wrap and ill directions being
60 X 58 respectively per inch length. The composition of the E– glass fabric is presented in Table 2 and the important properties are shown in Table 3.
The second reinforced fabric is cotton satin (sateen). The composition of the typical satin cloth selected for the investigation is 70% mercerized cotton and 30% polyester. The areal density of the satin fabric range between 230-254 gsm with at least 100 yarns per inch in the warp direction and at least 85 yarns per inch
in the ill direction. The plain weave satin is preferred because it
is a weave that already possesses good strength and can be rein-forced to give a light weight highly serviceable fabric. The im-portant properties of the satin fabric selected towards the second reinforcement material are presented in Table 4.
Density, Kg/m3 Tensile Strength, MPa Tensile Modulus, GPa Elongation, % Flexural Strength, Mpa
1200-1250 83-93 31-33 4.2-5.6 115-125
Table 1. Properties of the cured epoxy with neat formulation
Constituent Percentage
SiO2 52-56
Al2O3 12-16
CaO 16-25
MgO 0-5
B2O3 8-13
K2O 0-1.5
Na2O 0-1.5
Fe2O3 0.05-0.4
TiO2 0-.8
F2 0-0.5
Table 2. Composition
Property Value
Density, Kg/m3 2500-2550
Tensile Strength, MPa 3400-3600
Tensile Modulus, GPa 72-75
Elongation, % 4.2-4.8
Table 3. Properties of E-glass
Density, Kg/m3 Tensile Strength, MPa Tensile Modulus, GPa Elongation, %
920-1050 750-900 30-35 2.2-3.8
3.2 Specimen Preparation
Bi-directional symmetric hybrid composite laminates with fab-ric reinforcement were fabfab-ricated at laboratory temperature in the shape of a rectangular plate by hand lay-up technique. Proper care was taken during fabrication of laminates to ensure uniform thickness, minimize voids in the material and maintain homoge-neity. The laminates fabrication is by placing the fabric layers one over the other in the mold with matrix in between the layers, hand roller was used to distribute resin uniformly, compact plies, and to remove entrapped air. The surfaces of the mold were covered
with a release ilm to prevent the lay up from bonding to the mold
surface. The laminates were cured in room temperature (250C and
Relative Humidity 55%), under constant pressure and left in the mold for 48 hours for complete curing. The laminates were cut to suit ASTM dimensions by a band saw cutter and the edges were trimmed.
Specimen preparation includes selection of different volume fractions for constituents; matrix material 40% for all samples, the volume fraction of glass fabric was between 15–45% in steps of 15% and the corresponding volume of satin fabric was estimated. The specimen preparation is in accordance with ASTM D6484 dimensions, with a notch centrally located in the form of drilled
hole. Specimen coniguration also includes selection of two ibre
orientations i.e. 0/90O
and ±45O, for each type of the specimen ive
notch diameters, 2, 4, 6, 8 and 10 mm were drilled centrally.
3.3 Instrumentation
The open hole compression test specimen with various notch sizes were loaded on a computer controlled Universal Testing Machine. The specimens were clamped in pin-loaded grips and subjected to displacement rate of 1.27 mm/min. The tests were closely moni-tored and conducted at room temperature. The load at which the complete fracture of the specimen occurred has been accepted as the critical load (Ref 19). The fracture toughness has been calcu-lated by using the critical load for each specimen.
4. Results and discussion
The industries demand the database for information and further to develop testing and design standards. Therefore, the primary pur-pose of any material characterization is to investigate its behav-iour under different mechanical loads. Experimentations have been carried out to characterize the candidate composite material under
different loading conditions and with various specimen conigura
-tions, the analysis of the results and the inluence of various param -eters on the properties are summarized in the following sections.
4.1 Physical properties
ASTM D792 standards were used for density tests, rectangular samples of size 10mm X 10mm X 55mm were used with thick-ness and width variations of ±0.15mm and ±0.15mm, respective-ly. Distilled water at room temperature was used as the
immer-sion luid and the mass was measured using digital balance with
a 10-4 g resolution. To obtain the mean value of density of each
group, a total of thirty specimens such that a minimum of three specimens from each group were tested. As expected, the hybrid
composites had no signiicant difference in density with respect to iber orientation, this is attributed to the approximately same warp and ill count. However, the experiments show that the density
of the laminates ranges from 1239.6 kg/m3 to 1649.4 kg/m3 for
laminates with increase in glass content from 15% to 45%, this is true because glass being the denser constituent among the selected materials and hence increases the sample density
ASTM D2734 standard was used to analyze the void percent-age in composite laminate. Normally upto one percent of voids
indicate a good composite, but practical dificulties increase the
percentages of voids. The void content of a composite may
sig-niicantly affect the mechanical properties. Higher percentages of
voids usually mean lower fatigue resistance, greater susceptibil-ity to water penetration and weathering and increased variation in strength properties. Knowing the densities of the constituents, the
volume fractions of iber, resin, and void were calculated based on two assumptions. The irst assumption was that the mass of iber in the composite was known (i.e., there is no iber loss during
manufacture). The second assumption is that the gas in any voids has the density of air, 1.29 x 10⁻³ g/cm3. The results show that void
content varies between 2.6 to 4.8 % for laminates with different percentages of reinforcement.
The iber content in the composite laminates was analyzed
by using ASTM D3171 standard, this method consists of dissolv-ing the resin portion of a weighed composite specimen in a hot
di-gestion medium, i.e., Nitric acid. The residue is iltered, dried, and
weighed. The weight percent of iber can be converted to a vol
-ume percent of by using the iber and resin densities. Since in this
study two types of reinforcements were used, to validate the above method a second method was also used to compare the results. In
the second method iber volume fraction of composite specimen
was determined using standard method by burning small piece of hybrid composite of known weight and weighing the residue in
the form of glass ibers. Comparing the results of both the tests, the deviation in volume fraction of ive specimens in each case is
between 0.5% to 1.1%.
4.2 Compressive Behaviour of Hybrid Composite Laminates
The rectangular specimens with 6mm thickness were cut to suit ASTM D3410 standards from the polymeric composite laminate. The Rectangular specimens were tested in a universal testing machine at a constant cross-speed and at room temperature. To minimize the effect of stress concentration, tabs with tapered ends were bonded on each side of the specimen. Normally for compos-ites, the compression tests are designed to produce compressive
property data for the material speciications, research and devel -opment (Ref 20). These data can be used to study the relationship among textile preform architecture, type of matrix, mechanical properties and failure modes (Ref 21). The presence of local
de-fects, which are often dificult to characterize, also inluences the
It is quite evident from the Fig. 1 that the compressive strength is superior for 0/90o bidirectional iber orientation, which is due to the basic reason that the longitudinal ibers directly absorb, trans -fer and distribute the load uniformly throughout the cross-section. Whereas the compressive strength in the other orientation is com-paratively less, this difference is largely due to the fact that the
ibers start slipping as they are subjected to the compressive load and hence the iber to matrix load transfer is not uniform. Also the
trends indicate that as glass fabric increases, compressive strength will also increase and it is true upto 30% of glass content. The change in compressive strength is almost negligible from 30-45% of glass content; this may be due to that as glass percentage in-creases specimen start behaving as brittle material.
4.3 Open Hole Compression Test
Open hole compression (OHC) strength is a good measure of consolidation quality, matrix properties and interface strength. Compression failure may occur in several modes ranging from buckling of the whole composite specimen to actual material compression at the microstructural level depending on material properties and loading scheme. Open hole compression test of the composite specimen is carried in accordance with ASTM D6484 standards, with a notch centrally located in the form of drilled
eters ranging between 2mm to 10mm in steps of 2mm were drilled
on different specimens. The OHC test specimen with two iber
orientations (0/90o and ±45o) and various notch sizes were loaded
on a computer controlled Universal Testing Machine. The experi-mental setup and testing conditions were same as that of the usual compression test. The results of the investigation are discussed in the following sections;
4.3.1 Effect Fiber Volume Content and Orientation
In this section the basic comparison is made between OHC strength of laminates for different percentages of glass, orientations and hole diameters, the results of the experimentation is plotted in Fig. 2. Trends straight away indicate that more the percentage of glass, superior will be the OHC strength and at the same time the greater the hole diameter, lesser will be OHC strength. This behaviour is
true irrespective of iber orientation, but OHC strength is less in
case of ±45o orientation specimens compared to 0/90o orientation
specimens. The highest OHC strength obtained is 85 MPa and 106 MPa respectively for ±45o and 0/90o orientations, both in case of
laminates with 45% glass content. For both the types of orienta-tions, the severity increases as hole diameter crosses 4 mm, this is probably due to increased stress concentration and smaller cross sectional area of resisting material.
Figure 1. Inluence of Fiber Content and Orientation on the Compressive
Strength of Hybrid Laminates for (a) 0/90° Orientation and (b) ±45° Orientation.
4.3.2 Finite width correction factor
OHC strength of all the laminates is plotted against width cor-rection factor (W/d). Fig. 3 shows the plots for various samples with different glass contents and orientations. From the graphs,
the signiicance of width factor can be observed, the laminates
sustain higher compressive loads for width factor greater than
ive. This is attributed to the fact that as width factor reduces, the
load bearing material reduces and hence smaller OHC strength.
For width factors smaller than ive, the load carrying material is
less than 25% resulting in lesser OHC strengths. The laminates show approximately nonlinear relation upto W/d=5 and thereaf-ter its approximately linear, this behaviour of the laminates reveal the fact that composites with load bearing material less than 25% exhibit higher stress concentration. The failure of these laminates is not only due to reduced load bearing area but also due to the
difference in the Poisson’s ratio of the matrix and iber materi
-als. Longitudinal compressive loading produces transverse tensile stresses within the matrix. These transverse tensile stresses can
re-sult in longitudinal cracks developing parallel to the ibers within
a weak matrix. In addition, a weak interface can also fail under these transverse tensile stresses. Voids within the matrix or at the interface will act as stress raisers and increase the chance of longi-tudinal cracking. Upon further loading, these cracks will grow and result in transverse rupture of the composite.
4.3.3 Effect of Glass Fiber Content on Fracture Toughness
The OHC tests are used to evaluate the fracture toughness of com-posite laminates under compression, the results are shown in Fig. 4. Again as expected, superior fracture toughness for laminates
with higher percentages of glass content is true irrespective of i -ber orientation. The effect of hole diameter on fracture toughness
is quite signiicant, it can be observed that there is a reduction in
toughness as hole diameter increases from 4mm for laminates with 15% glass content in 0/90o orientation. Same trend is observed in
case of specimen with 30% glass, but the margin of reduction is quite small. However, for laminates with 45% glass content the fracture toughness has never reduced, such a type of behaviour is mainly due to that glass is more tougher than the other two con-stituent materials. In case of ±45o oriented laminates the toughness
has started declining for samples with hole diameter greater than 6mm, though the fracture toughness values are increasing but still these values are less than 0/90o specimen for a given notch size
and glass percentage. This behaviour may be due to off-axis
load-ing, which results in shorter iber length and reduced interface.
During longitudinal compressive loading, the ibers desire to
buckle is resisted by the surrounding matrix; either the matrix must deform and/or the interface fail to allow buckling. Failure in strong
glass-iber reinforced composites initiates by micro-buckling of i -bers that have the least lateral support due to free boundaries, voids, stress concentrations, or locally weak matrix. Micro buckling may progress into many different failure modes depending on the matrix and interface properties. The matrix and interface may be strong enough to withstand the Poisson’s ratio induced transverse tensile
Figure 3. Width Correction Factor of OHC Laminates with different Glass Percentages for (a) 0/90° Orientation and (b) ±45° Orientation.
ated at the interface. The interfaces may begin to fail in shear and lead to ultimate composite failure. Two modes of failure were vis-ible in the tested specimens. Diagonal cracks in case of ±45o
Orien-tation and transverse cracks for 0/90o oriented laminates. On close
observation there was no evidence of longitudinal cracks, but there exists damage in the form of delamination. The extent of delami-nation on laminates is not that severe, because the delamidelami-nation is not propagated largely. The fractured specimen show cracks both transverse and diagonal pass through the drilled hole with angles
approximately equal to the iber orientation angles.
4.4 Modeling of Compressive Strength
For modeling of compressive strength, Multilevel Factorial Design was chosen, with three factors and 36 runs. The factors selected to study the response of Compression strength are glass volume
frac-tion, iber orientation and open hole diameter. Table 5 indicates
the factors and their levels used in general linear model having 36 runs in multilevel factorial design. The compressive strength re-sponse was studied with the objective as larger is the better and the compressive test results were subject to the analysis of variance.
The ANOVA technique was carried out for a level of signiicance of 5% that is the level of conidence is 95%. For determining the signiicant effect of the parameters on the quality characteristics,
F-test is used. Table 6 shows the results of ANOVA analysis for compressive strength.
SS = Sum of squares, DF = Degree of freedom, MS = Mean Square, Fcal= F-test calculated, F0.05= F-value at 5% signiicance level and P = Percentage of contribution.
sive strength of laminates. The last column of the table shows the percentage contribution of each factor on the total variation
indi-cating the inluence on the result. It can be observed from the re -sults that the interaction between the above factors does not have
signiicant variation on the compressive strength of the composite
laminates. It is clear from the ANOVA table that the glass volume fraction (p= 21.54 %), Fiber orientation (p=7.66 %) and hole
di-ameter (p=67.39 %) have signiicant inluence on the compressive
strength. The effect of the volume fraction and orientation is
com-paratively less, which indicates that hole diameter signiicantly
controls the compressive strength of the composite laminate. How-ever, the interaction between the factors is quite marginal and can be neglected and also the error associated in the ANOVA table was almost negligible because it is about 0.29 %. The Regression
coef-icient (R2) indicates that the predicted model explains 98.98 % of
variability in the compressive strength. R2 value, which is very
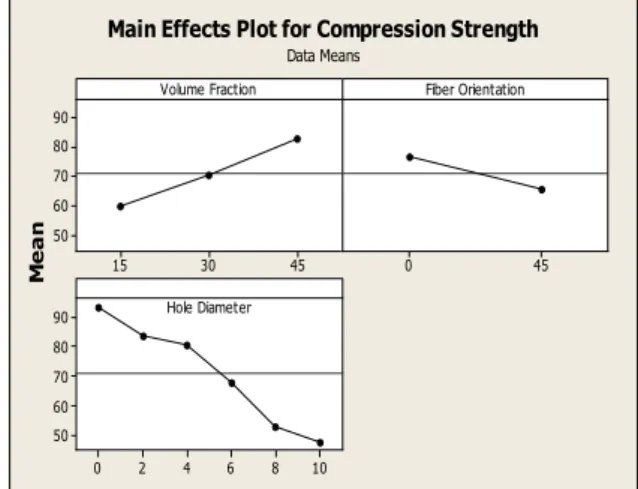
closer to unity, shows that the relationship between the compres-sive strength and other factors are fairly represented by the DOE model considered for design. The effect of the factors on compres-sive strength can be analyzed from the Fig. 5, it is clear that the
hole diameter has signiicant inluence on compressive strength
compared to other factors. For laminates without any drilled hole the compressive strength was higher and at the same time for laminates with increased hole sizes, the compressive strength has decreased. Therefore higher compressive strength can be obtained with laminates having smaller hole diameters. This relation can be explained as hole diameter increases the stress concentration will increase and also the cross sectional area of the material reduce, resulting in failure of laminates at small loads.
The above plot generalize the trends for the analysis pur-pose, to examine individual factor with all of its levels, the de-tailed interaction plot for compression strength is given in Fig. 6. The variation in compressive strength due to variations of factors is better understood by using contour and surface plots, hence to represent the effect of each of the factors at different levels of variation these plots are shown in Fig. 7. The contour plots indi-cate that the highest compressive strength is obtained when glass levels are high and hole diameter levels are low. This area appears at the lower right corner of the plot. The surface plot also show the same response, in addition it is possible to get a general idea of compressive strength at various levels of the factors.
General Linear Model: Compression Strength Versus Volume Fraction, Orientation, Hole Diameter
Factor Type Levels Values
Volume Fraction, % Fixed 3 15, 30, 45
Fiber Orientation,
deg Fixed 2 0, 45
Hole Diameter, mm Fixed 6 0, 2, 4, 6, 8, 10
Table 5. Process parameters for Compression Response
Source of
Variation DF SS MS FCal F0.05 P, % Signii
-cance
Volume
Frac-tion (VF) 2 3156.85 1578.43 368.48 4.10 21.54
Signiicant
at 95% CL Fiber
Orienta-tion (FO) 1 1123.37 1123.37 262.25 4.96 7.66
Signiicant
at 95% CL Hole Diameter
(HD) 5 9876.23 1975.25 461.12 3.33 67.39
Signiicant
at 95% CL
VF*FO 2 228.29 114.15 26.65 4.10 1.56 Signiicant at 95% CL
VF*HD 10 75.57 7.56 1.76 2.98 0.52 Insigniicant at 95% CL
FO*HD 5 153.07 30.61 7.15 3.33 1.04 Signiicant at 95% CL
Error 10 42.84 4.28 0.29
Total 35 14656.22 100
Table 6. Analysis of Variance Results for Compression Test
Residual plots that can be used to examine the goodness of
model it, Minitab has generated four types of residual plots as
shown in Fig. 8. The Histogram shows two long tails indicating a
skewed distribution and these points may be outliers. The standard error from the model obtained is S=2.206969, this is a measure
of model it and it is measured in the units of the response vari -able and represents the standard distance data values fall from the regression line, or the standard deviation of the residuals. In this study, the standard error obtained is not that high which indicates
model adequacy, hence the outlier points have little signiicance.
The points in the normal probability plot have approximated a straight line, indicating normal distribution of residuals. Since there is no curvature at the tails, it can be said that the data used
for the analysis is suficient and goodness-of-it is obtained. The verses it show a random pattern of residuals on both sides of zero.
Only two or three points lie far from the majority of points, in-dicating outliers. The points on either side of the zero line the residual density is approximately same, it is an indication that the predominance of positive residuals is same as that of the predomi-nance of negative residuals. The residual verses plot shows ran-dom patterns on both sides of zero line, such patterns indicate the relation between the predictor and variables, otherwise indicating incorrect functional form of the model.
5. Conclusions
The experimental investigations have shown that, as the glass
vol-ume increases, the OHC strength will also increase but it is signii -cantly dependent on the notch diameter. Upto hole 4mm hole di-ameter, the reduction is marginal and thereafter the OHC strength reduces quite severely. Similar behaviour for fracture toughness
(KI) was also observed for both the orientations. The inite width
correction factor have also shown that the critical hole diameter is 4 mm, indicating a minimum of 75% material requirement to
with stand compressive loads and provide local iber stabilities. ANOVA technique suggests that the hole diameter is signiicantly
controls the OHC strength with a percentage contribution of about
67%, while the less signiicant parameter being the orientation
with approximately 7% contribution.
Figure 6. Interaction plot for Compressive Strength
Figure 7. Contour and Surface plots for Compressive Strength
1. “Composite Materials Handbook: Volume 1. Polymer Matrix Composites Guidelines for Characterization of Structural Materials”, Department of Defense Handbook, MIL-HDBK-17-1F, 1, 2002, Chapter 7.
2. “Engineered materials hand book”, Composites, ASM International, 1, 1987.
3. K. Taniuchi, The experimental analysis of yield stress at bottom of notch roots, Applied Stress Analysis, 1, 1990, pp. 234–242.
4. J.M. Whitney and R.J. Nuismer, Stress fracture criteria for laminated composites containing stress concentration, Journal of Computational Mathematics, 8(3), 1974, p.253.
5. H. Hyakutake and T. Hagio, The severity near the notch root of notched bars, Applied Stress Analysis, 1, 1990, pp. 243–249.
6. J. Lyons, Temperature Effects on Fractural Toughness of Polymeric Com-posites, Pittsburg State University-Kansas Technology Center, Pittsburg KS, 2003, p.27.
7. K.L. Reifsnider, K. Liao, M. McCormic and A. Tiwari, Fibre fracture in
continuous ibre ceramic composites: concepts and observations, Journal
of Engineering for Gas Turbine and Power, ASME, 119(1), 1997, p.205. 8. G.G Chell, Developments in Fracture Mechanics–1, Applied Science
Publication Ltd., London, 1979.
9. D. Broke, Elementary Engineering Fracture Mechanics, 4th ed., Martinus Nijhoff Publishers, The Netherlands, 1987.
10. H. Hyakutake, H. Nisitani and T. Hagio, Fracture criterion of notched plates of FRP, Journal of Japan Society of Mechanical Engineers, Series I, 32(2), 1989, p.300.
11. H.J. Konish and T.A. Cruse, Determination of fracture strength in ortho-tropic graphite/epoxy laminates, Composite Reliability, ASTM STP 580, 1975, p.490.
12. F.A. McClintock and G.R. Irwin, Plasticity Aspects of Fracture Mechan-ics in Fracture Toughness Testing and it’s Applications, ASTM STP 381, USA, 1984, p.84.
13. T.K. O’Brien, N.J. Johnson, D.H. Morris and R.A. Simonds, A simple test for the interlaminar fracture toughness of composites, SAMPE Journal, San Diego, 18(4), 1982, pp. 8–15.
14. J. Awerbach, and M.S. Madhukar, Notched strength of composite lami-nates: predictions and experiments – a review, Journal of Reinforced Plas-tics and Composites, 4, 1985, p.105.
15. R.B. Pipes, R.C. Wetherhold and J.W. Gillespie Jr., Notched strength of composite materials, Journal of Composite Materials, 12, 1979, p.148. 16. Y. Weixing, On the notched strength of composite laminates, Journal of
Composite Science and Technology, 45, 1992, p.105.
17. D.H. Morris and H.T. Hahn, Fracture of graphite/epoxy composites and composite materials: testing and design, Proceedings of the Conference of ASTM STP 617, USA, 1977, p.317.
18. H.J. Konish, J.L. Swedlow and T.A. Cruse, Experimental investigation of fracture in an advance composite, Journal of Composite Materials, 6(1), 1972, p.114.
19. W.F. Brown and J.E. Srawly, Plane strain crack toughness testing of high strength metallic materials, ASTM STP 410, 1966, p.292.
20. A. Dasgupta and R.K. Agarwal, Orthotropic Thermal Conductivity of Plain-weave Fabric Composite Using a Homogenization Technique, Jour-nal of Composite Materials, 26(18), 1992, pp. 2736-2758.
21. S.Th. Georgopoulos, P.A. Tarantili, E. Avgerinos, A.G. Andreopoulos and