S. Boljanović et alii, Frattura ed Integrità Strutturale, 35 (2016) 313-321; DOI: 10.3221/IGF-ESIS.35.36
313
Focussed on Crack Paths
Fatigue failure analysis of pin-loaded lugs
Slobodanka Boljanovi
ć
Mathematical Institute-The Serbian Academy of Sciences and Arts, Kneza Mihaila 36, Belgrade, Serbia [email protected]
Stevan Maksimovi
ć
VTI-Aeronautical Department, Ratka Resanovića 1, Belgrade, Serbia [email protected]
ABSTRACT. In the present paper, mathematical models are proposed in order to analyze the strength of pin-loaded lugs with semi-elliptical crack and through-the-thickness crack. The crack growth investigation of considered crack configurations tackles the fatigue life evaluation and the crack path simulation of semi-elliptical crack. The residual strength is estimated by applying the two-parameter driving force model. The numerical and analytical approaches are employed for the stress intensity factor calculation. Experimental fatigue crack growth data are used in order to verify efficiency of the developed models. A good correlation between fatigue crack growth estimations and experimental observations is obtained.
KEYWORDS. Cyclic loading; Strength estimation; Crack path; Semi-elliptical crack at a hole; FEM.
INTRODUCTION
erospace systems can realize their stationary and moving operational duties through the load transfer assembly known as lug-type joint. In such linkage under cyclic loading, the high stress concentration, contact pressure and fretting can lead to the crack initiation, crack growth and even catastrophic failure. Consequently, for safety design and exploitation of the fracture critical pin-loaded lug is significantly important the development of reliable computational models.
Fatigue and fracture strength estimations related to the damaged lug demand accurate evaluation of both, the stress state field around the crack tip and the stress intensity factor. In the literature, a variety of methods have been employed to calculate the stress intensity factor either of planar crack or through-the-thickness crack configurations. Thus, the propagation process of such crack situations can be theoretically investigated by applying the following approaches: approximate analytical methods [1, 2], weight function [3, 4], finite element method [5, 6], finite element alternating method [7, 8].
Within the context of fracture mechanics, the failure analysis under cyclic loading can be realized through appropriate crack growth laws. Paris and Erdogan [9] experimentally investigated the propagation process, and found that the crack growth is depended on the applied stress intensity range. Then, Forman [10] suggested that the stress ratio and the fracture toughness together with the stress intensity factor range can be used to describe the crack propagation under cyclic loading. Weertman [11] recognized that the crack growth can be consider if the maximum stress intensity factor are include together with the facture toughness and the stress intensity factor range. Further, Elber [12] suggested that the
S. Boljanović et alii, Frattura ed Integrità Strutturale, 35 (2016) 313-321; DOI: 10.3221/IGF-ESIS.35.36
314
stress ratio can be taken into account by the effective stress intensity factor range instead of the stress intensity range and developed the crack closure model. Based on observations related to the crack propagation under cyclic loading, Walker [13] proposed his stress-ratio dependence crack growth model. Kujawski [14] found that the crack growth propagation under cyclic loading can be simulated if the maximum stress intensity factor is involved, and introduced the two-parameter driving force model. Noroozi et al [15] took into account the combination of the maximum stress intensity factor and the stress intensity factor range together with the elastic-plastic crack tip stress-strain field and proposed a unified two-parameter crack growth model.
In the present paper, computational models are formulated for the strength estimation of the damaged lug. The propagation of semi-elliptical crack emanating from the lug hole is investigated through the following issues: the stress analysis, the fatigue life evaluation and the crack path simulation. The two-parameter driving force crack growth model is applied for the failure analysis of lug under cyclic loading. The stress intensity factor is calculated by applying the finite element method and/or analytical approach. The predictive capability of proposed models is verified through the comparison between the calculations and experimental data.
FATIGUE LIFE ESTIMATION
uring exploitation of cyclically loaded structural components, complex fatigue process could often lead to the unexpected failure. The crack propagation can be theoretically investigated through the cyclic rate of crack growth either in one direction (through-the-thickness crack) or in two directions (surface crack).
In the present paper, the two-parameter driving force model proposed by Kujawski [14] is employed in order to simulate the propagation process under cyclic loading. Since the semi-elliptical crack is considered, the variation of crack shape can be evaluated from the crack growth rates at two positions on the crack front: the crack growth rate da/dN at the deepest point A (crack depth), and crack growth rate db/dN at point B on the lug surface (crack length), as follows:
*
mAA A
da
C K
dN ;
0.5 *
max
A IA A
K K K
(1a)
* mBB B
db
C K
dN ;
0.5 *
max
B IB B
K K K
(1b)
where: KA KIA
and KB KIB
for R0, and if R0, KA KIAmax
and KB KIBmax
.
Then, the number of loading cycles up to failure for both directions can be calculated if above relationships related to the crack growth rate are integrated i.e.:
0 * f A a ma A A
da dN C K
(2a)
0 * f B b mb B B
db dN C K
(2b)where CA, CB, mA and mB are material constants experimentally obtained, N denotes the number of loading cycles up to
failure, R is the stress ration, KIA, KIB, and KIA max, KIB max represent the stress intensity factor ranges and maximum
stress intensity factor under mode I loading conditions for depth and surface directions, respectively, a0, b0, and af, bf
denote initial and final crack length in depth and surface directions, respectively.
Since awkward functions exist in Eqs. (2a) and (2b), the residual life for appropriate incremental crack lengths in depth and surface direction can be estimated if the numerical integration is employed, and for that purpose the present authors developed the software programme based on Euler’s algorithm.
S. Boljanović et alii, Frattura ed Integrità Strutturale, 35 (2016) 313-321; DOI: 10.3221/IGF-ESIS.35.36
315
STRESS INTENSITY FACTOR CALCULATION
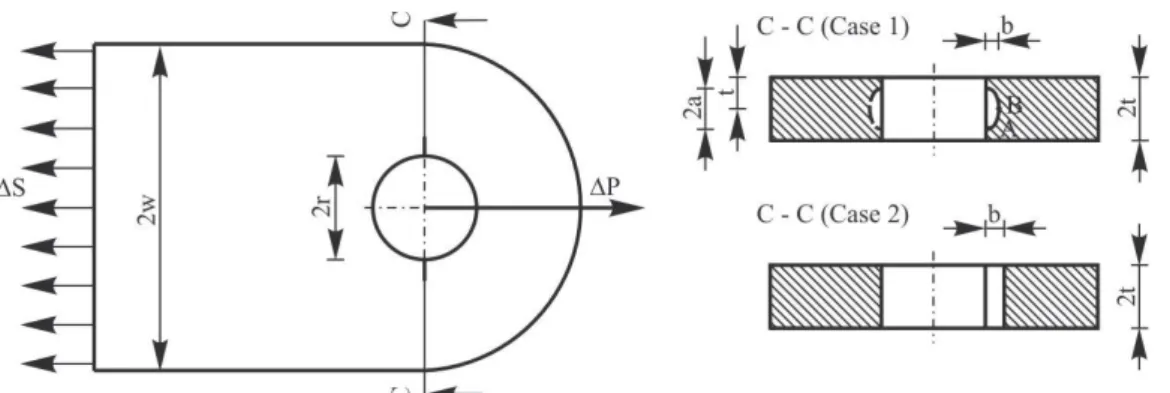
n order to estimate the fracture strength and fatigue lives of engineering components, significantly important parameter is the stress intensity factor due to the fact that it includes the geometry, material and loading conditions. As the pin-loaded lug with semi-elliptical crack emanating from a hole [Fig.1, case 1] is investigated, the relationship for stress intensity can be expressed as follows [16]:
2 2 , , , , ,
I sh
a a a r r b
K S G F
Q b t t w w
(3)
where KI2represents the stress intensity factor range for two-symmetric cracks initiated at a hole and Sis the applied stress range.
The function Q, as the shape factor for an ellipse, can be written on the following way:
1.65
1 1.464 b
Q
a
; 1
a b
(4)
where a and b are the crack length in depth direction and surface direction, respectively.
The influence of various boundaries can be expressed by the boundary correction factor, as follows:
2 4
1 2 3 1 2 3 2
sh w
a a
F M M M g g g f f
t t
(5)
where M1, M2, M3, g1, g2, g3 represent functions related to crack configuration and loading, and they are given by:
1 b M a (6) 2 3 2 0.05 0.11 M a b (7) 3 3 2 0.29 0.23 M a b (8) 1 4 2 1 2.6 2 1 cos 1 4 a a t t g a b (9)
2 3 4
2 2
1 0.358 1.425 1.578 2.156 1 0.08
g
(10)
S. Boljanović et alii, Frattura ed Integrità Strutturale, 35 (2016) 313-321; DOI: 10.3221/IGF-ESIS.35.36
316
1 1 bcos 0.9
r
(11)
2 103 1 0.1 1 cos 1
a g
t
(12)
where is angle location, t denotes a half of the thickness, r and w present radius of the hole and half-width of the lug, respectively.
The propagation process of single crack emanating from a hole can be theoretically investigated by employing the relationship [1] expressed on the following way:
1 2
4 2 4
I I
ab tr
K K
ab tr
(13)
where KI1 is the stress intensity factor range for single crack situation.
Furthermore, the engineering maintenance inspections and controls show that the strength of lug under cyclic loading often can be threatened by through-the-thickness crack(s) initiated on the hole. The fatigue failure of such crack configuration can be analyzed through the stress intensity factor [17] expressed on the following way:
1 1 1 1
1 cos
2
IT w
K S b f f G
r w
(14)
An angular function f, the Bowie correction factor f1 related to single semi-elliptical crack configuration, the pin-loaded
correction factors G1, G2 and the finite-width correction factors fw1,fw2 for single and two-symmetric cracks, respectively,
are discussed in Ref. [16, 18].
Then, the finite element method is used in order to evaluate the stress field around the crack tip, i.e. the stress distribution and the stress intensity factor. The propagation process of the semi-elliptical crack is numerically simulated by applying quarter-point (Q-P) singular finite elements [19], integrated in the software package MSC/NASTRAN [20]. All the computed results using both analytical and numerical methods are presented in next Section,
S. Boljanović et alii, Frattura ed Integrità Strutturale, 35 (2016) 313-321; DOI: 10.3221/IGF-ESIS.35.36
317
NUMERICAL RESULTS
o illustrate the efficiency of the computational model for the fatigue failure analysis of lug with either semi-elliptical crack or through-the-thickness crack, a few numerical examples are presented in this Section. The strength of lug is here investigated through the stress analysis, the residual life estimation and the crack path simulation.
The fatigue life calculation of through-the-thickness crack
In the first Section, the residual strength of the pin-loaded lug with through-the-thickness crack (Fig.1, case 2) is examined. The lug, subjected to axial cyclic loading with constant amplitude (a far-field maximum stress Smax= 41.38
MPa), has diameter of a hole 2r =38.1 mm and initial crack length b0 = 0.635 mm [21]. Geometry sizes and relevant stress
ratios are shown in Tab. 1. The cracked lug is made of 7075 T6 Al Alloy, and the following material characteristics are assumed: CB= 2.5510-10, mB= 3.06 [22].
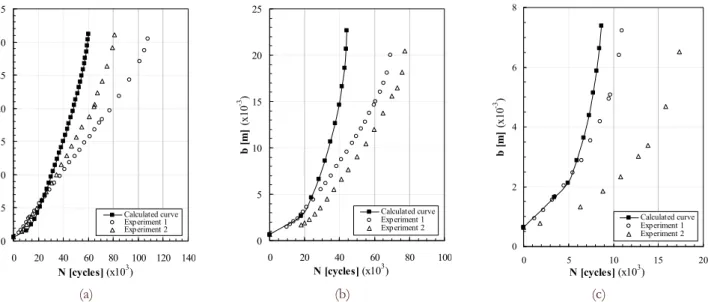
Using the above geometry sizes, fatigue data and loading conditions, the stress intensity factor for the lug with through-the-thickness crack is calculated by applying Eq.(14) and appropriate relationships discussed in Ref. [16, 18], then thanks to Eqs.(2a) and (2b), the number of loading cycles up to failure is evaluated. Figs. 2a, 2b and 2c show the computed results for lug configuration with through-the-thickness crack. In the same Figures, the estimations are compared with available experimental results [21]. It can be deducted from Fig.2 that the calculations and experimental data are in a good correlation.
0 5 10 15 20 25 30 35
0 20 40 60 80 100 120 140
N [cycles] (x103)
b [
m
]
(x10
-3)
Calculated curve Experiment 1 Experiment 2
0 5 10 15 20 25
0 20 40 60 80 100
N [cycles] (x103)
b
[m]
(x10
-3 )
Calculated curve Experiment 1 Experiment 2
0 2 4 6 8
0 5 10 15 20
N [cycles] (x103)
b
[m]
(x10
-3 )
Calculated curve Experiment 1 Experiment 2
(a) (b) (c)
Figure 2: Crack length versus number of loading cycles for the pin-loaded lug with through-the-thickness crack emanating from a hole:
(a) Experiment 1-ABPLC84, Experiment 2-ABPLC91; (b) Experiment 1-ABPLC47, Experiment 2-ABPLC94; (c) Experiment
1-ABPLC63, Experiment 2-ABPLC62. Experimental results for through-the-thickness crack configuration from Ref. [21].
Lug ID 2w 10-3 (m) 2t 10-3 (m) R
ABPLC84 ABPLC91
114.3 12.7 0.5
ABPLC47 ABPLC94
85.72 12.7 0.5
ABPLC63 ABPLC62
57.15 12.7 0.1
Table 1: Geometry sizes of the lug and external loading conditions [21].
S. Boljanović et alii, Frattura ed Integrità Strutturale, 35 (2016) 313-321; DOI: 10.3221/IGF-ESIS.35.36
318
The stress analysis
In this Section, both, the stress distribution and the stress intensity factor for damaged lug are tackled. Under cyclic loading with constant amplitude (a far-field maximum stress Smax= 62.575 MPa), the semi-elliptical crack is initiated along
the hole of lug (a= b= 9.2 mm). The lug, whose geometry characteristics are: 2w = 50 mm, 2r = 16 mm and 2t = 32 mm, is made of 7075 T6 Al Alloy (E = 70.2 GPa, =0.33).
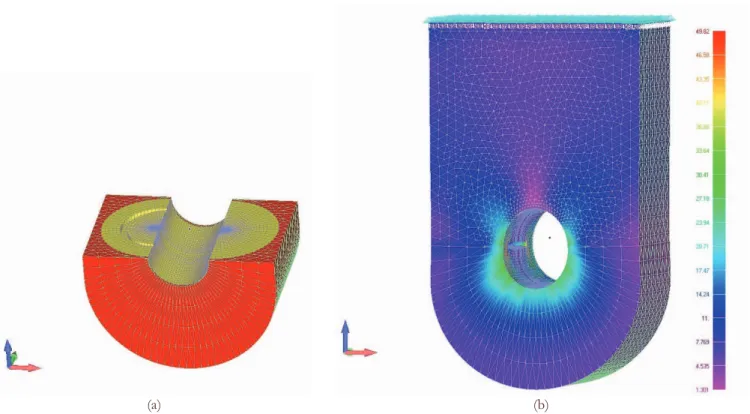
The stress field of the lug with semi-elliptical crack emanating from a hole is here theoretically investigated by employing the finite element method. Thanks to quarter-point (Q-P) singular finite elements implemented in MSC/NASTRAN [19, 20], the numerical approach is developed for the stress analysis of pin-loaded lug. Actually, by applying super elements around the crack tip [20], the crack growth process is simulated step-by-step for each increment of crack length, and different meshes are modeled. A representation of the finite element mesh and the stress distribution are shown in Fig.3a and Fig.3b.
Two-symmetric cracks One crack
a=b=9.2 mm Analytical FEM Analytical FEM
KA(MPa m0.5) 20.550 21.199 17.360 19.922 KB(MPa m0.5) 11.891 12.723 10.044 11.447
Table 2: Stress intensity factor calculations by applying analytical and numerical approaches.
Then, both, developed numerical approach by applying Q-P finite elements, as well as Eq. (3)-(13) are employed in order to calculate the stress intensity factor. In Tab. 2, the calculated values of the stress intensity factor for one crack and two symmetric cracks lug configurations are presented.
(a) (b)
Figure 3: Finite element analysis of the pin-loaded lug with semi-elliptical crack(s) emanating from a hole: (a) Modeled finite element mesh; (b) The stress distribution of single crack situation.
The strength estimation of lug with semi-elliptical crack emanating from a hole
S. Boljanović et alii, Frattura ed Integrità Strutturale, 35 (2016) 313-321; DOI: 10.3221/IGF-ESIS.35.36
319
2w=85.725 mm, 2t = 18 mm and 2r = 57.15 mm [23]. The initial crack lengths are: a0 = 5.303 mm and b0 = 3.573 mm, for
depth and surface directions, respectively. The lug, made of PMMA, is subjected to an external force with constant amplitude (a far field maximum force Pmax= 2300 N), and the following material parameters are assumed: CA=2.29411403210-6, mA=5.598311.
0 2 4 6 8 10
0 2 4 6 8 10
N [cycles] (x103)
b
[m
]
(x
10
-3 )
Calculated curve Experiment
0 2 4 6 8 10
0 2 4 6 8 10
N [cycles] (x103)
a
[m
]
(x
10
-3 )
Calculated curve Experiment
(a) (b)
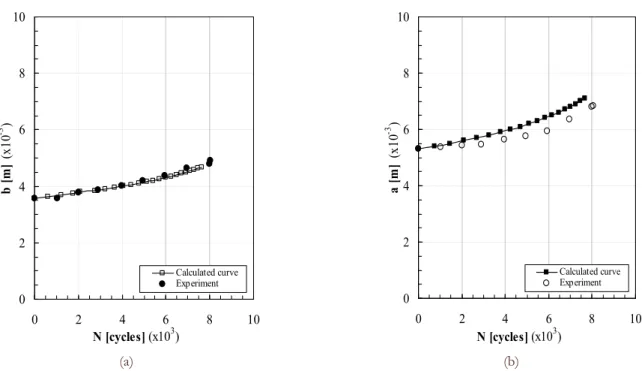
Figure 4: Crack length versus number of loading cycles for the pin-loaded lug with semi-elliptical crack emanating from a hole: (a) a versus N, (b) b versus N. Initial crack length: a0 = 5.303 mm, b0 = 3.573 mm. Experimental results from Ref. [23].
0 4 8 12 16
0 2 4 6 8 10
b [m] (x10-3)
a
[m
]
(x
10
-3 )
a=5.553 mm a=5.803 mm a=6.053 mm a=6.303 mm a=6.553 mm Initial crack
0 4 8 12 16 20
0 2 4 6 8 10
b [m] (x10-3)
a
[m
]
(x10
-3 )
a=6.803 mm a=7.053 mm a=7.303 mm a=7.553 mm a=7.803 mm Initial crack
(a) (b)
Figure 5: The crack path modeling of semi-elliptical crack emanating from a hole. Initial crack length: a0 = 5.303 mm, b0 = 3.573 mm.
S. Boljanović et alii, Frattura ed Integrità Strutturale, 35 (2016) 313-321; DOI: 10.3221/IGF-ESIS.35.36
320
Fig.4b, respectively. The evaluated number of loading cycles for the pin-loaded lug is compared with experimental results [23]. Figs. 4a and 4b show that the calculations related to the lug configuration with semi-elliptical crack emanating from a hole, are in a good agreement with experimental observations.
Now, for the same lug the crack growth path is simulated employing, step-by-step, the computed stress intensity factor for different crack increments. It should be noted that in every step, the crack length in surface direction is calculated thanks to the crack length in dept direction and the stress intensity factors from the preceding step. For the calculation of the stress intensity factor as well as crack lengths in surface direction, Eqs. (3)-(13) and (1a) and (1b) are used. The modeled crack growth paths for different crack lengths in depth direction are presented in Fig.4a and Fig.4b, respectively. Note that direction of x and y axels correlate with surface of the lug and the lug hole, respectively.
CONCLUSIONS
computational model for crack growth analysis of the pin-loaded lug under cyclic loading is developed. The crack propagation process of either semi-elliptical crack or through-the-thickness crack emanating from a hole of the lug is investigated through the stress analysis and the residual life estimation. Further, the crack path is simulated for semi-elliptical crack configuration. For the stress analysis analytical and/or numerical approaches are employed. The stress field of the lug with semi-elliptical crack is evaluated by applying quarter-point (Q-P) singular finite element. Then, the two-parameter driving force crack growth model is employed in order to calculate the strength of lug. The comparison between the calculations and experimental results point out that developed mathematical model can be applied for reliable residual life estimation of the lug with semi-elliptical crack and through-the-thickness crack.
ACKNOWLEDGEMENTS
he authors would like to thank the Mathematical Institute of the Serbian Academy of Sciences and Arts and the Ministry of Science and Technological Development, Serbia for providing financial support of this research under Grant No. OI 174001.
REFERENCES
[1] Shah, R.C., Stress intensity factors for through and part-through originating at fastener holes, In: Mechanics of crack growth, ASTM STP 590 (1976) 429-459.
[2] Schijve, J., Hoeymakers, S.H.M., Fatigue crack growth in lugs, Fatigue Eng. Mater. Struct., 1 (1979) 185-201.
[3] Impellizeri, L.F., Rich, D.L., Spectrum fatigue crack growth in lugs. In: Fatigue crack growth under spectrum loads, ASTM STP 595 (1976) 320-336.
[4] Vainshok, V.A., Varfolomeyev, I.V., Stress intensity factor analysis for part-elliptical cracks in structures, Int. J. Fracture, 46 (1990) 1-24.
[5] Sih, G.C., Chen, C., Non-self similar crack growth in elastic-plastic finite thickness plate, Theor. Appl. Fract. Mech., 3 (1985) 125-139.
[6] Raju, I.S., Newman, Jr. J.C., Stress intensity factor for two symmetric corner cracks. In: Smith C.W., editor. Fracture mechanics, ASTM STR (1979) 411-430.
[7] Smith, C.W., Jolls, M., Peters, W.H., Stress intensities for cracks emanating from pin-loaded holes. In: Flaw growth and fracture, ASTM STP 631 (1977) 190-201.
[8] Grandt, Jr. A.F., Kullgren, T.E., Stress intensity factors for corner cracked holes under general loading conditions, J. Eng. Mater. Technol., 103 (1981) 171-176.
[9] Paris, P.C., Erdogan, F.A., A critical analysis of crack propagation laws, J. Basic Eng. Trans. SME, Series D, 55 (1963) 528-534.
[10]Forman, R.G., Study of fatigue crack initiation from flaws using fracture mechanic theory, Eng. Fract. Mech., 4 (1972) 333-345.
[11]Weertman, J., Rate of growth of fatigue cracks calculated from the theory of indefinitesimal dislocations distributed on a plane, Int. J. Fract. Mech., 2 (1966) 460-467.
A
S. Boljanović et alii, Frattura ed Integrità Strutturale, 35 (2016) 313-321; DOI: 10.3221/IGF-ESIS.35.36
321
[12]Elber, W., The significance of fatigue crack closure. In: Damage tolerance in aircraft structure, ASTM STR 486 (1971) 230-242.
[13]Walker, E.K., The effect of stress ratio during crack propagation and fatigue for 2024-T3 and 7075-T5 aluminum. In: Effect of environment and complex load history on fatigue life, ASTM STR 462 (1970) 1-14.
[14]Kujawski, D., A new (K+K
max)0.5 driving force parameter for crack growth in aluminum alloy, Int. J. Fatigue, 23
(2001) 733-740.
[15]Noroozi, A.H., Glinka, G., Lambert, S., A two parameter driving force for fatigue crack growth analysis, Int. J. Fatigue, 27 (2005) 1277-1296.
[16]Newman, Jr. J.C., Raju, I.S., Stress-intensity factor equations for cracks in three-dimensional finite bodies, In: Lewis J.C. and Sines G. Eds. Fracture mechanics – Volume I: Theory and Analysis, ASTM STP 791 (1983) I-238-I-265. [17]Newman, Jr. J.C., Fracture analysis of surface and through-cracked sheets and plates, Eng. Fract. Mech., 5 (1973)
667-689.
[18]Boljanović, S., Maksimović, S., Fatigue crack growth modeling of attachment lugs, Int. J. Fatigue, 58 (2014) 66-74. [19]Barsoum, R.S., Triangular quarter-point elements as elastic and perfectly plastic crack tip elements, Int. J. Numer.
Meth. Eng., 11 (1977) 85-98.
[20]http://www.mscsoftware.com/product/msc-nastran, (2013).
[21]Kathiresan, K., Brussat, T.R., Advanced life analysis methods, AFWAL-TR-84-3080, OH, (1984).
[22]Flech, W.G., Anderson, R.B., A mechanical model of fatigue crack propagation: In: Pratt P.L., editor. Proc of the second international conference on fracture. Brighton, London: Chapman & Hall: (1969).