Estimating mass-wasting processes in active earth slides – earth
flows with time-series of High-Resolution DEMs from
photogrammetry and airborne LiDAR
A. Corsini1, L. Borgatti2, F. Cervi1, A. Dahne1, F. Ronchetti1, and P. Sterzai3
1Department of Earth Sciences, Modena and Reggio Emilia University, Modena, Italy
2Department of Structural, Transport, Hydraulic, Survey and Territorial Engineering – DISTART, Bologna University, Bologna, Italy
3National Institute of Oceanography and Experimental Geophysics – OGS, Trieste, Italy
Received: 1 December 2008 – Revised: 6 March 2009 – Accepted: 9 March 2009 – Published: 19 March 2009
Abstract. This paper deals with the use of time-series of High-Resolution Digital Elevation Models (HR DEMs) ob-tained from photogrammetry and airborne LiDAR coupled with aerial photos, to analyse the magnitude of recently re-activated large scale earth slides – earth flows located in the northern Apennines of Italy. The landslides underwent com-plete reactivation between 2001 and 2006, causing civil pro-tection emergencies. With the final aim to support hazard assessment and the planning of mitigation measures, high-resolution DEMs are used to identify, quantify and visualize depletion and accumulation in the slope resulting from the re-activation of the mass movements. This information allows to quantify mass wasting, i.e. the amount of landslide mate-rial that is wasted during reactivation events due to stream erosion along the slope and at its bottom, resulting in sed-iment discharge into the local fluvial system, and to assess the total volumetric magnitude of the events. By quantifying and visualising elevation changes at the slope scale, results are also a valuable support for the comprehension of geo-morphological processes acting behind the evolution of the analysed landslides.
Correspondence to:A. Corsini ([email protected])
1 Introduction
High-Resolution Digital Elevation Models (HR DEMs) have proved to be useful in the analysis of landslide processes from different perspectives and at different spatial scales, in-cluding improvement of landslide inventories, susceptibility assessment and appraisal of landslide surface features (Van Westen and Lulie Getahun, 2003; McKean and Roering, 2004; Casson et al., 2005; Metternicht et al., 2005; Glenn et al., 2006; Jaboyedoff et al., 2007).
In this work, the analysis of recent reactivation events of large scale earth slides – earth flows in the northern Apen-nines of Italy was carried out by means of HR DEMs, ob-tained with photogrammetry and airborne LiDAR.
The final objective was to gain new pieces of knowledge to be used for hazard assessment and planning of mitigation measures in these case studies. Specific aims were: interpret-ing and quantifyinterpret-ing processes of depletion and accumulation at the slope scale, quantifying mass wasting at the slope scale (i.e. the amount of landslide material that is wasted during re-activation events due to stream erosion along the slope and at its bottom and that results in sediment discharge into the local fluvial system) and assessing the total volumetric magnitude of the events.
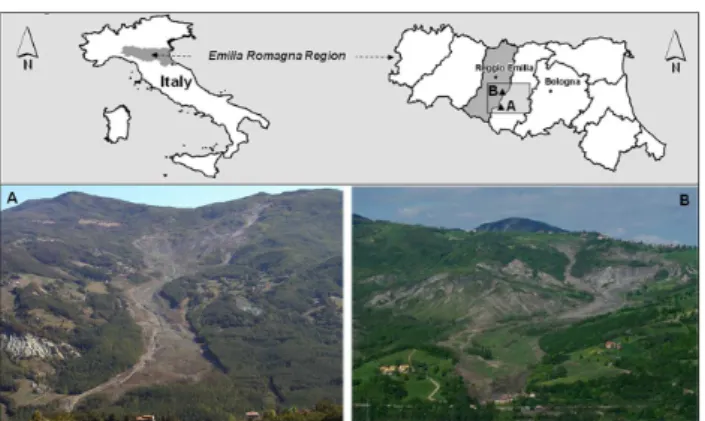
2 Test sites
434 A. Corsini et al.: Estimating mass-wasting in earth slides with HR-DEMs
Fig. 1.Panoramic view of the test sites.(A)Valoria landslide;(B) Ca’ Lita landslide.
a length of about 3 km, involve areas of about 1 km2, and move at depths ranging from 10 m to 30–40 m. Total land-slide volume of each phenomenon exceeds 25 million m3 (Borgatti et al., 2007; Ronchetti et al., 2007).
The Valoria landslide was reactivated in 2001 (Fig. 1a). The 2001 reactivation affected about 70% of the slope recog-nised, on the basis of geomorphologic interpretation, as be-ing part of a pre-historic landslide, radiocarbon dated to 7800–7580 cal. yr BP (Bertolini, 2007). Historic records collected by Regione Emilia-Romagna (2008) indicate that events of a much smaller magnitude of that of 2001, oc-curred in the years 1950 and 1984. In these cases, only a limited portion of the landslide was remobilised (Manzi et al., 2004). During 2001 reactivation, part of the earth flow invaded the riverbed and the ancient landslide toe was remo-bilised in bulk.
A second total reactivation event occurred in winter 2005– 2006. In this case, the earth flow lobe didn’t reach the valley floor (Ronchetti et al., 2007). During this reactivation, maxi-mum velocities were in the order of 10–20 m/day. Today the landslide is still active, with movements affecting the source area, the transit zone, the toe.
The Ca’ Lita landslide (Fig. 1b) was reactivated in 2002 and again in 2004 (Borgatti et al., 2006). The 2002 and 2004 reactivations affected about 60% of the slope recognised, on the basis of geomorphologic interpretation, as being part of a pre-historic landslide complex. Unlike Valoria, no radiocar-bon date is available to frame in time the origin of the mass movement. However, several reactivations of a much smaller magnitude of that of 2002 and 2004 have occurred in period 1950 to 1985 (Regione Emilia-Romagna, 2008). During the 2004 reactivation, the landslide toe advanced for about 400 m into a previously unaffected valley floor, and buried it com-pletely (Borgatti et al., 2006). During reactivation, maximum velocities were in the order of 10 m/day. Today the landslide is inactive (suspended to dormant), thanks also to the heavy countermeasure works carried out in the slope (Corsini et al., 2006; Borgatti et al., 2008).
Fig. 2.Time series of DEMs put in relation to subsequent reactiva-tion events of the Valoria and Ca’ Lita landslides.
3 DEMs time series
The time series of DEMs available for Valoria and Ca’ Lita landslides are summarised in Fig. 2.
The 1973 DEMs for both sites were generated by digiti-sation of official 1:5000 topographic maps (created by su-pervised photogrammetry). The 2003 and 2004 DEMs were also created by supervised photogrammetry at 1:2000 refer-ence scale. They’re based on ad hoc aero-photographic sur-veys carried out by public authorities soon after the reactiva-tion events. In all these cases, DEMs were calculated using a 2 m grid cell size by interpolating contours with the Borge-fors distance transform function available in software ILWIS (Gorte and Koolhoven, 1990).
Fig. 3.Differential DEMs for the Valoria landslide.(A)differential DEM 2003–1973;(B)differential DEM 2006–2003.
in the order of meters, biases between DEMs had a limited negative effect on the interpretation of landslide processes. Moreover, by calculating depleted and accumulated volumes in a supervised manner, and only in mostly non vegetated landslide areas, the negative effect of bias is to be considered reasonably low also on the quantitative assessment of mass transfer along the slope.
4 Differential DEMs
4.1 Valoria landslide
A first differential DEM product was created by subtraction of the 1973 and 2003 DEMs. This time interval brackets the 2001 reactivation event (Fig. 3a). It must be specified that the subdivision of the landslide in source, track and toe zones, as indicated in Fig. 3, is based on geomorphologic ob-servation and mapping during field surveys and photo inter-pretation and, therefore, does not result from any algorithm related to DEMs. The differential DEM product evidenced significant distributed depletion in the source zone and in the transit zone of the landslide (down to−20 m). Significant ac-cumulation (up to +15 to +20 m) occurred in the lower part of the slope, at the border between transit zone and the left side of the ancient toe zone. Part of this earth flow, derived by the depletion of the transit zone, reached the riverbed, where it
Fig. 4.Aerial views of the Valoria landslide toe.(A)view from top to down;(B)detail of the earth flow that reached the river bed in 2001 causing mass wasting.
436 A. Corsini et al.: Estimating mass-wasting in earth slides with HR-DEMs
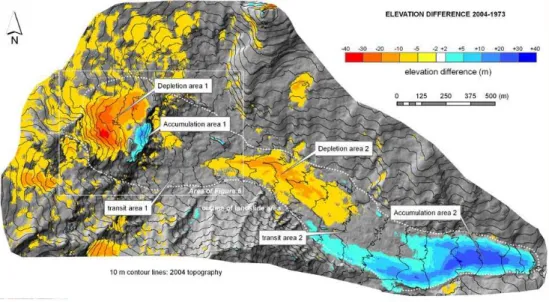
Fig. 5.Differential DEM 2004–1973 for Ca’ Lita landslide (modified after Borgatti et al., 2006).
A second differential DEM product was created by sub-traction of the 2003 and 2006 DEMs, so to bracket the 2005– 2006 reactivation event (Fig. 3b). To do so, the 2006 Li-DAR DEM, originally at 0.5 m cell size, was resampled at 2 m cell size in order to average values in adjacent pixels, and to smooth the bias that could have eventually affected the differential DEMs using different cell size. Further de-pletion was evidenced in the upper portion of the source zone (down to−10 m), that was coupled with accumulation at some locations in the intermediate and lower part of the source zone itself (up to +10 m). Quite interesting is the sig-nificant accumulation in the transit zone (up to +15 m), that completely compensated the depletion created by the previ-ous 2001 event. Some accumulation – or better uplift – in the order of +3 m is visible in part of the toe zone. This is interpreted as a bulging of the toe caused by the compressive stress caused by the earth flow front filling the transit zone and loading the toe zone that, actually, was reactivated “in bulk”. On the basis of GPS benchmarks measurements this process caused a displacement estimated in the order of 2 m (Ronchetti et al., 2007). During this event, limited erosion was operated by the river on the landslide toe, so sediment flux was basically null.
4.2 Ca’ Lita landslide
The Ca’ Lita landslide can be more precisely classified as a rotational rock and earth slide – earth flow (Borgatti et al., 2006). This is due to the fact that, whereas down slope the landslide evolves as an earth slide – earth flow, in the up-per slope the landslide evolves as a roto-traslational slide af-fecting weak rocks down to the depth of−42 m, as it was possible to determine by analysis of borehole cores and by inclinometer monitoring (Corsini et al., 2006).
A first differential DEM product was created by subtrac-tion of the 1973 and 2004 DEMs so to bracket the 2002 and 2004 reactivation events (Fig. 5). It evidenced a significant depletion of about 15 to 20 m in the upper landslide part, that is interpreted as the result of deep-seated roto-traslational sliding (depletion area 1 in Fig. 5). This was partly compen-sated by an apparent accumulation to its front (accumulation area 1), that is actually the result of the local rotation and advancement of the front of the roto-traslational rock slide. This dynamic did also result in the displacement of loose clayey material toward the lower part of the slope (transit area 1), without significant elevation changes before and af-ter. A second depletion area is clearly visible in the upper part of the earth flow lobe (depletion area 2). This is compen-sated by the huge accumulation area that formed at the land-slide toe (accumulation area 2). Basically, during the 2004 event, the landslide advanced about 400 m into a previously unaffected valley, that was consequently filled by landslide deposits.
Fig. 6.Differential DEMs of the upper part of Ca’ Lita landslide.(A)differential DEM 2005–2004;(B)differential DEM 2006–2005;(C) shaded relief of DEM 2004;(D)shaded relief of DEM 2005.
2004 and 2005 edge lines indicated in Fig. 6c and d were obtained by visual interpretation of the shaded reliefs and on the basis of field survey and mapping.
A third differential DEMs product was created by subtrac-tion of the 2006 and 2005 LiDAR DEMs (Fig. 6b). This evi-denced local collapses of the main scarp during winter 2005– 2006. A depletion of more than 10 m, and a deposition of ma-terial at the foot of the scarp is clearly visible. At the same time, this differential DEM product shows that deep-seated roto-traslational movements, active until summer 2005, were suspended during winter 2005–2006. This is to be ascribed to the positive effect of the deep drainage systems built in the slope during summer 2005.
4.3 Analysis of mass wasting
The differential DEMs of Figs. 3 and 5 are bracketing main reactivation events (i.e., Valoria 2001 and 2005–2006 and Ca’ Lita 2002–2004). These products were further analysed in order to calculate cumulated depletion (D) and accumula-tion (A) and, ultimately, to assess mass wasting (defined as X=−D+A).
Since the existing bias between DEMs could have affected the results derived from an automated sum of positive and negative elevation differences over the entire dataset, total accumulated and depleted volumes were computed only in-side the landslide outline (defined on the basis geomorphic
survey) and by considering only subareas in which the differ-ential DEMs showed clearly that depletion or accumulation had occurred.
Furthermore, the total volume of material involved in each reactivation event was estimated by coupling the depletion, accumulation and mass waste data, with information about mass displacement, that is the part of the landslide that moves without causing evidence of elevation changes. This volume was assessed on the basis of underground exploration and monitoring data, and of field surveyed maps of the affected areas. The approach adopted is represented in Fig. 7.
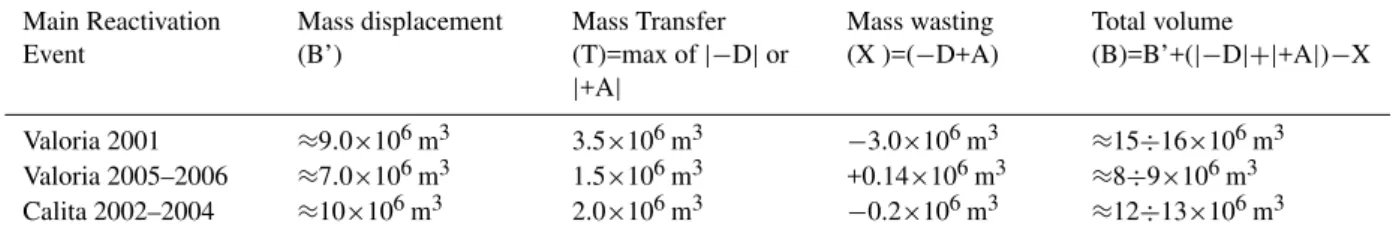
The results of calculation are summarised in Table 1. In practice, only the Valoria 2001 reactivation event produced significant mass wasting (about 3 million m3). In all other cases, the mass balance between depletion and accumula-tion, i.e. mass wasting, is close to “zero”. These figures, coupled with mass displacement information, allow assess-ing the total volumetric magnitude of the events. They were of about 15 million m3and about 9 million m3for the Valoria 2001 and 2006 events respectively, and of about 9 million m3 for the Ca’ Lita events occurred between 2002 and 2004.
5 Conclusions
438 A. Corsini et al.: Estimating mass-wasting in earth slides with HR-DEMs
Table 1.Quantification of the different components of the volumetric magnitude of main reactivation events considered in Valoria and Ca’ Lita.
Main Reactivation Event
Mass displacement (B’)
Mass Transfer (T)=max of|−D|or |+A|
Mass wasting (X )=(−D+A)
Total volume
(B)=B’+(|−D|+|+A|)−X
Valoria 2001 ≈9.0×10⁶m3 3.5×10⁶m3 −3.0×10⁶m3 ≈15÷16×106m3 Valoria 2005–2006 ≈7.0×10⁶m3 1.5×10⁶m3 +0.14×10⁶m3 ≈8÷9×10⁶m3 Calita 2002–2004 ≈10×106m3 2.0×10⁶m3 −0.2×10⁶m3 ≈12÷13×106m3
Fig. 7.Schematic drawing explaining the approach adopted for the quantification of the different components of the volumetric magni-tude of reactivation events.
al., 2005) and on the other hand to perform geomorphometric studies on distinctive landslide features (McKean and Roer-ing, 2004; Glenn et al., 2006; Wills, 2006).
The possibility of using time series of DEMs for evaluat-ing volumetric magnitude of reactivation events has been ex-ploited in this study. The usage of photogrammetric DEMs derived by existing topographic maps created some problems related to the elevation bias between the DEMs in stable ar-eas (up to more than 1 m). On the other hand, the bias be-tween LiDAR DEMs was limited (maximum about 25 cm), so that the quantification was more precise. Nevertheless, by using supervised procedures, it was still possible to evaluate, quantify and map depletion and accumulation zones at the landslide scale with DEMs of different source.
It must also be considered that the assessment of the total volume involved in a reactivation event was considered also mass displacement, that is not reflected in elevation changes (see Fig. 7). In landslides that are more than 3 km long and hundreds of metres wide, the assessment of mass displace-ment relies on data regarding the extent of the overall af-fected area (obtainable by field survey) and the extent and shape of the basal sliding surface (obtainable by interpola-tion of data from boreholes and geophysics). Therefore the
assessment of the total volume of the event is only possible with an uncertainty of one or more million m3, that is much larger than that of the assessment of depletion and accumu-lation in the slope.
Nevertheless, the comparison of HR-DEMs provided an interesting insight on landslide mechanisms. Remarkable changes in topography caused by reactivation events were delimited and quantified in all the case study analysed. Dis-regard possible uncertainties, this piece of information is of great help in depicting possible future event scenarios. More-over, considering that earth slides – earth flows moving at a rate up to 10 m/day are difficult to be monitored with field in-strumentation, the results suggest that LiDAR systems could also be used, under certain organizational conditions (tempo-ral resolution of the survey, cost, post-processing effort etc.), as a near-real time monitoring system during reactivation events as they provide a quick collection of topographical data and allow the representation of large surfaces with dense spatial sampling from which deformations of the ground sur-face of the landslide can be computed. In this way, the ten-sional state can be evaluated, together with a series of param-eters useful for stability analyses.
Acknowledgements. The paper is part of project PRIN 2007 (Inte-grated Airborne and Wireless Sensor Network systems for landslide monitoring – WiseLand; local responsible: A. Corsini) and Marie-Curie Project “Mountain Risks” (MRTN-CT-2006-035798).
The editor (Marc-Henri Derron) and the reviewers (Graziella Devoli and Anonymous) are acknowledged for the useful suggestions that allowed improving the manuscript.
Distinct collaboration: A. Corsini, L. Borgatti and F. Ronchetti prepared the paper and the figures. F. Cervi and A. Daehne contributed to the collection and elaboration of field data and DEMs. P. Sterzai was responsible of the acquisition and processing of LiDAR data.
Edited by: M.-H. Derron
puto, G., and Puglisi, C.: Large reactivated landslides in weak rock masses: a case study from the Northern Apennines (Italy), Landslides, 3(2), 115–124, 2006.
Borgatti, L., Cervi, F., Corsini, A., Ronchetti, F., and Pellegrini, M.: Hydro-mechanical mechanisms of landslide reactivation in het-erogeneous rock masses of the northern Apennines (Italy), AEG Special Publication, 23, 749–758, 2007.
Borgatti, L., Corsini, A., Marcato, G., Ronchetti, F., and Zabuski, L.: Appraise the structural mitigation of landslide risk via numer-ical modelling: a case study from the northern Apennines (Italy), Georisk: Assessment and Management of Risk for Engineered Systems and Geohazards, 2(3), 141–160, 2008.
Casson, B., Delacourt, C., and Allemand, P.: Contribution of multi-temporal remote sensing images to characterize landslide slip surface? Application to the La Clapi`ere landslide (France), Nat. Hazards Earth Syst. Sci., 5, 425–437, 2005,
http://www.nat-hazards-earth-syst-sci.net/5/425/2005/.
Corsini, A., Borgatti, L., Coren, F., and Vellico, M.: Use of mul-titemporal airborne LiDAR surveys to analyse post-failure be-haviour of earthslides, Canadian J. Remote Sens., 33(2), 116– 120, 2007.
Corsini, A., Borgatti, L., Caputo, G., De Simone, N., Sartini, G., and Truffelli, G.: Investigation and monitoring in support of the structural mitigation of large slow moving landslides: an exam-ple from Ca’ Lita (Northern Apennines, Reggio Emilia, Italy), Nat. Hazards Earth Syst. Sci., 6, 55–61, 2006,
http://www.nat-hazards-earth-syst-sci.net/6/55/2006/.
Gorte, B. G. H. and Koolhoven, W.: Interpolation between iso-lines based on the Borgefors distance transform, ITC Journal, Enschede, 3, 245–247, 1990.
Glenn, N. F., Streutker, D. R., Chadwick, D. J., Thackray, G. D., and Dorsch, S. J.: Analysis of LiDAR-derived topographic informa-tion for characterizing and differentiating landslide morphology and activity, Geomorphology, 73(1–2), 131–148, 2006. Guibas, L. and Stolfi, J.: Primitives for the Manipulation of General
Subdivisions and the Computation of Voronoi Diagrams, ACM Transactions on Graphics, 4(2), 74–123, 1985.
Francis, London, 61–68, 2007.
Manzi, V., Leuratti, E., Lucente, C. C., Medda, E., Guerra, M., and Corsini, A.: Hystorical and recent hydrogeological instability in the Monte Modino area: Valoria, Tolara and Lezza Nuova land-slide reactivations (Dolo – Dragone valleys, Modena Apennines, Italy), GeoActa, 3, 1–13, 2004.
McKean, J. and Roering, J.: Objective landslide detection and sur-face morphology mapping using high-resolution airborne laser altimetry, Geomorphology, 57, 331–351, 2004.
Metternicht, G., Hurni, L., and Gogu, R: Remote sensing of land-slides: An analysis of the potential contribution to geo-spatial systems for hazard assessment in mountainous environments, Remote Sens. Environ., 98, 284–303, 2005.
Regione Emilia-Romagna, Servizio Geologico Sismico e dei Suoli: Historical archive of landslide events, http://www.regione. emilia-romagna.it/wcm/geologia en/Sections/Hydrogeological risk/Landslides ER/10 historical archive landslide.htm, 2008. Ronchetti, F., Borgatti, L., Cervi, F., Lucente, C. C., Veneziano, M.,
and Corsini, A.: The Valoria landslide reactivation in 2005–2006 (Northern Apennines, Italy), Landslides, 4(2), 189–195, 2007. Terrasolid: TerraScan “software for processing airborne and mobile
laser data and images”, http://www.terrasolid.fi/en/products/4, 2005.
Van Den Eeckhaut, M., Poesen, J., Verstraeten, G., Vanacker, V., Moeyersons, J., Nyssen, J., and van Beek, L. P. H.: The ef-fectiveness of hillshade maps and expert knowledge in mapping old deep-seated landslides, Geomorphology, 67(3–4), 351–363, 2005.
Van Westen, C. J. and Lulie Getahun, F.: Analyzing the evolution of the Tessina landslide using aerial photographs and digital ele-vation models, Geomorphology, 54, 77–89, 2003.