WORLDWIDE GEOGRAPHICAL DISTRIBUTION OF
BLACK SIGATOKA FOR BANANA: PREDICTIONS BASED
ON CLIMATE CHANGE MODELS
Waldir Cintra de Jesus Júnior
1*; Ranolfo Valadares Júnior
1; Roberto Avelino Cecílio
1; Willian
Bucker Moraes
1; Francisco Xavier Ribeiro do Vale
2; Fábio Ramos Alves
1; Pierce Anderson
Paul
31
UFES/CCA Depto. de Produção Vegetal Lab. de Fitopatologia, Alto Universitário, s/n. C.P. 16 29500000 Alegre, ES - Brasil.
2
UFV/CCA - Depto. de Fitopatologia - 36570-000 - Viçosa, MG - Brasil. 3
Ohio State University, Dept. of Plant Pathology - Wooster, Ohio - USA. *Corresponding author <wcintra@yahoo.com>
ABSTRACT: Global climatic changes will potentially influence plant diseases and the efficacy of their
management options. One of the most likely impacts of climate change will be felt by the geographical
distribution of plant diseases. Black Sigatoka is considered the most damaging and costly disease of
banana. The socio-economic impact of this disease has continued to increase as the pathogen reaches
new areas and the disease becomes more difficult to be controled. The objectives of this research were
to compare the global geographical distribution of the disease based on maps elaborated using
weather data representing: i) current and future periods (2020, 2050 and 2080), ii) Intergovernmental
Panel on Climate Change scenarios A2 and B2, iii) predictions based on six different climate change
models and the “multimodel ensemble” and, iv) individual months. The “multimodel ensemble” lead to
a reduction in the variability of the simulations when compared to the results obtained using the
individual models separately. The predictions suggested that, in the future, areas favorable for the
development of the Black Sigatoka disease will decrease. This reduction will occur gradually and will
be higher for the A2 than for the B2 scenario. Changes in the geographical distribution of the disease
will occur from one month to another, with unfavorable areas becoming favorable and vice-versa.
However, in spite of these changes, extensive areas will still continue to be favorable for the occurrence
of Black Sigatoka.
Key words:
Mycosphaerella fijiensis
,
Musa
spp., global climate change
DISTRIBUIÇÃO GEOGRÁFICA DA SIGATOKA
NEGRA DA BANANEIRA ESTIMADA POR MODELOS
DE MUDANÇAS CLIMÁTICAS GLOBAIS
RESUMO: As mudanças climáticas poderão alterar as doenças de plantas e afetar a eficácia das
medidas de manejo. Um dos prováveis impactos será na distribuição geográfica das doenças. A
Sigatoka Negra é considerada a principal doença da cultura da banana em decorrência dos danos
causados e aumento do custo de manejo. O impacto sócio-econômico da doença continua
aumentando, uma vez que a doença tem atingido novas áreas de plantio, tornando o manejo mais
difícil. Este trabalho tem por objetivos comparar a distribuição geográfica da doença por meio da
elaboração de mapas nas seguintes situações: a) clima atual e futuro (2020, 2050 e 2080), b) cenários
A2 e B2 do Painel Intergovernamental de Mudanças Climáticas, c) predito por seis diferentes
modelos de mudanças climáticas e pela média dos mesmos e, d) entre meses. Haverá redução das
áreas favoráveis à doença no futuro, sendo que tal redução será mais acentuada no cenário A2 do
que no B2 e gradativa para as décadas de 2020, 2050 e 2080. Predições efetuadas com o uso da média
dos dados estimados pelos modelos permitiram redução na variabilidade da simulação em
comparação com a predição gerada por cada modelo individualmente. Alterações na distribuição
geográfica da doença ocorrerão entre meses, de modo que áreas consideradas desfavoráveis
tornar-se-ão favoráveis e vice-versa. Apesar disso, extensas áreas continuarão favoráveis ao
desenvolvimento da Sigatoka Negra.
INTRODUCTION
Global climate change (GCC) is a major topic
of discussion within both scientific and political
fo-rums. The Intergovernmental Panel on Climate Change
(IPCC) is responsible for assessing information
rel-evant to climate change and summarizing this
infor-mation for policymakers and the public. GCC
predic-tions are based on four scenarios (A1, A2, B1 and B2)
that describe greenhouse gas emissions from
poten-tial resource using patterns, technological innovations,
and demographics (IPCC, 2001).
Projections of future climate are made by
com-puter models called Climate Change Models
consider-ing future greenhouse gas emissions simulated by each
one of the four scenarios (A1, A2, B1 and B2). These
models simulate climatic processes at different
tem-poral and spatial scales to predict future changes at
climate variables like air temperature, rainfall and
rela-tive humidity, among others.
A2 scenario describes a very heterogeneous
world. The underlying theme is self-reliance and
pres-ervation of local identities. Fertility patterns across
re-gions converge very slowly, which results in
continu-ously increasing global population. Economic
develop-ment is primarily regionally oriented and per capita
eco-nomic growth and technological changes are more
frag-mented and slower than in other storylines (IPCC,
2001). The B2 scenario describes a world in which
em-phasis is put on local solutions for economic, social,
and environmental sustainability. It is a world with
con-tinuously increasing global population at a rate lower than
A2, intermediate levels of economic development, and
less rapid and more diverse technological change than
in the B1 and A1 storylines. While the scenario is also
oriented toward environmental protection and social
eq-uity, it focuses on local and regional levels (IPCC, 2001).
The nature and magnitude of GCC will
poten-tially influence plant diseases and the efficacy of their
management options, impacting the productivity and
sustainability of agricultural systems (Chakraborty et
al., 1998). According to Chakraborty et al. (2000) one
of the most likely impacts of climate change will be
felt in the geographical distribution of plant diseases,
with possible changes in the relative importance and
spectrum of diseases and the emergence of new
dis-ease complexes. Modeling studies are essential to
pre-dict these alterations (Bergot et al., 2004; Scherm,
2004; Bourgeois et al., 2004), however methodology
to use GCC models data on the prediction of global
warming impacts on plant diseases has not yet been
fully developed and still presents some lacks, like the
use of the “multimodel emsemble”, as it will be shown
latter in this report.
Many studies were performed focusing plant
diseases and global change. Carter et al. (1996)
simu-lated climate changes in Finland concluding that
in-crease in temperature will extend cereal cultivation
ar-eas in 2050. Moreover, the incrar-ease in the CO
2level
probably will generate higher yield which will alter the
geographical distribution of nematodes, extending to
the north of the country with a higher number of
nema-tode generation per year. In another study, the risk to
the late blight of potato (
Phytophthora infestans)
was
estimated to be higher over all areas at Finland.
Simi-lar results were observed in Europe for the nematodes
Xiphinema
spp. and
Longidorus
spp. (Boag et al.,
1991) and for
Phytophthora cinnamomi
(Brasier &
Scott, 1994; Brasier et al., 1996). On other hand, these
studies have focused on extratropical pathosystems,
indicating a strong need for such studies on tropical
areas.
Black Sigatoka (BS) (
Mycosphaerella fijiensis
Morelet) is considered one of the most damaging and
costly diseases of banana (Marín et al., 2003). The
socio-economic impact of BS continues to increase as
the pathogen reaches new areas. As bananas are
cul-tivated in more than 100 countries throughout the
world and the impact of BS has also increased as it
becomes more difficult to be controled (Marín et al.,
2003), therefore the ability to assess worldwide
geo-graphical distribution of the worse disease of banana
under climate change has practical implications on
cli-matic zoning of the crop, establishment of agricultural
government politics and adequate disease management.
The main objective of this research was to
compare the monthly worldwide geographical
distri-bution of BS at the current time and in the future
(2020, 2050 and 2080 decades) using current climate
data and six different GCC model predictions. A
sec-ondary objective was to compare the geographical
dis-tribution predicted by the use of each one of the six
different climate change models with the one made by
the use of “multimodel ensemble”.
MATERIAL AND METHODS
Current climate data, average air temperature
and air relative humidity, were used to elaborate maps
of the geographical distribution of BS. Current climatic
conditions were characterized based on information for
the period between 1961 to 1990, available in a
ma-trix format with cells of 10’ on latitude ´ 10’ on
longi-tude (New et al., 2002).
predicted temperature variations obtained by six
dif-ferent climate change models: HadCM3 (Hadley
Cen-tre Coupled Model version 3), CSIROMk2
(Common-wealth Scientific and Industrial Research Organization
GCM mark 2), CCSR/NIES (Centre for Climate
Re-search Studies Model), ECHAM4 (European Centre
Hamburg Model version 4), CGCM2 (Canadian
Glo-bal Coupled Model version 2) and GFDL-R30
(Geo-physical Fluid Dynamics Laboratory, R-30 resolution
model) (IPCC, 2007). Only the HadCM3 model
con-sidered future variations in relative humidity, the other
models assumed that relative humidity would remain
constant or would only vary slightly in the future.
The chosen future scenarios were A2 and B2,
with focus on the decades (or time slices) of 2020
(which comprises the periods of 2010 to 2039), 2050
(periods between 2040 and 2069) and 2080 (periods
between 2070 and 2099) (IPCC, 2001). A1 and B1
scenarios were not used due to the fact that some
cli-mate change models don’t use them to predict future
variations on climate.
Predicted variations made by each model had
a different spatial resolution (HadCM3: 3.75º
×
2.5º,
CSIRO-Mk2b: 5.625º
×
3.214º, CCSR/NIES: 5.625º
×
5.625º, ECHAM4: 2.8125º
×
2.8125º, CGCM2: 3.75º
×
3.75º and GFDL-R30: 3.7º
×
2.2º), so that climate
variation data were resampled using the geographic
in-formation system (GIS) Idrisi 32
®to generate maps
with final spatial resolution of 10’ on latitude
×
10’ on
longitude. For each month, these maps were summed
using Idrisi 32
®(arithmetical operation), with the maps
of current temperature and relative humidity to obtain
future projections of these climatic variables.
There is no definitive consensus regarding
which model is most appropriate for calculating
val-ues of the climatic variable for future scenarios (IPCC,
2007). So, maps of spatial distribution of BS were
elaborated using the current climate and the following
situations: i) Future air temperature estimated by each
of the six climate change models and future relative
humidity obtained from the HadCM3 model; ii) Future
air temperature as the arithmetical mean of
tempera-tures estimated using the six individual models and
fu-ture relative humidity obtained from the HadCM3
model (“multimodel ensemble”). The methodology of
map producing used was adapted of that one proposed
by Hamada et al. (2006).
Based on the overlapping of maps of monthly
average temperature and relative humidity,
consider-ing current and future period (2020, 2050 and 2080)
for both scenarios (A2 and B2), new maps of disease
distribution were elaborated using classes defined
based on available epidemiological data on the effects
of air temperature and relative humidity on the
devel-opment of Black Sigatoka on banana (Table 1)
(Meredith et al., 1973; Stover, 1983; Jacome et al.,
1991; Jacome & Schuh, 1992; Mouliom-Pefoura et al.,
1996; Romero & Sutton, 1997).
RESULTS AND DISCUSSION
From the total of 516 maps elaborated using
monthly projections for current and future decades
(2020, 2050 and 2080) in scenarios A2 and B2, only
the results for the “multimodel ensemble” model are
here shown (Figures 1 to 7). Complete results for
simulations based on the six different climate change
models and the “multimodel ensemble” are presented
in Tables 2 to 4.
The intervals used in this study to
character-ize classes of favorability to BS were adequate because
the obtained maps considering the current climate
(Fig-ure 1) were in agreement with data available in the
lit-erature (Mourichon et al., 1997; Carlier et al., 2000;
Ghini et al., 2007). The pathogen produces conidia and
ascospores and both play roles in the spread of the
disease. Conidia are formed under conditions of high
humidity, especially if there is a film of free water on
the leaves. Ascospore release requires the presence of
a rain or dew film of water that the pseudothecia
im-bibe and which results in the forcible ejection of the
ascospores through the leaf boundary layer, from
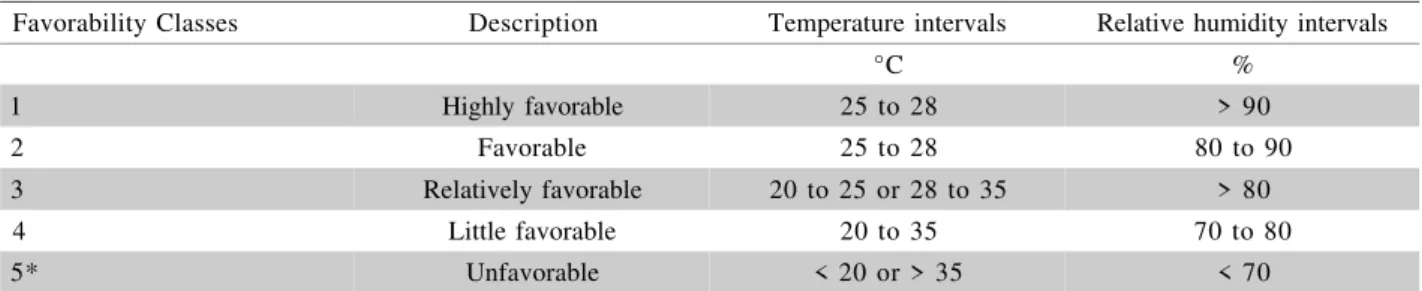
Favorability Classes
Description
Temperature intervals
Relative humidity intervals
°C
%
1
Highly favorable
25 to 28
> 90
2
Favorable
25 to 28
80 to 90
3
Relatively favorable
20 to 25 or 28 to 35
> 80
4
Little favorable
20 to 35
70 to 80
5*
Unfavorable
< 20 or > 35
< 70
*Favorability class 5 is defined if when any interval (temperature or relative humidity) occurs. For example: if temperature is between 20–35oC and relative humidity is less than 70% the area is classified at class 5.
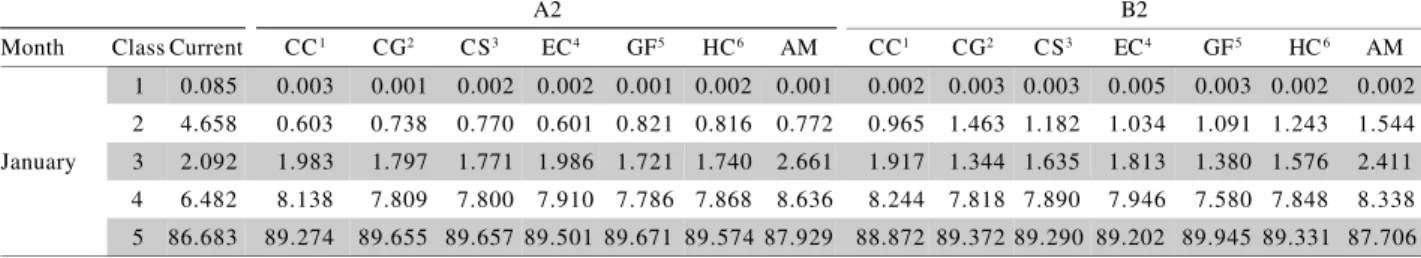
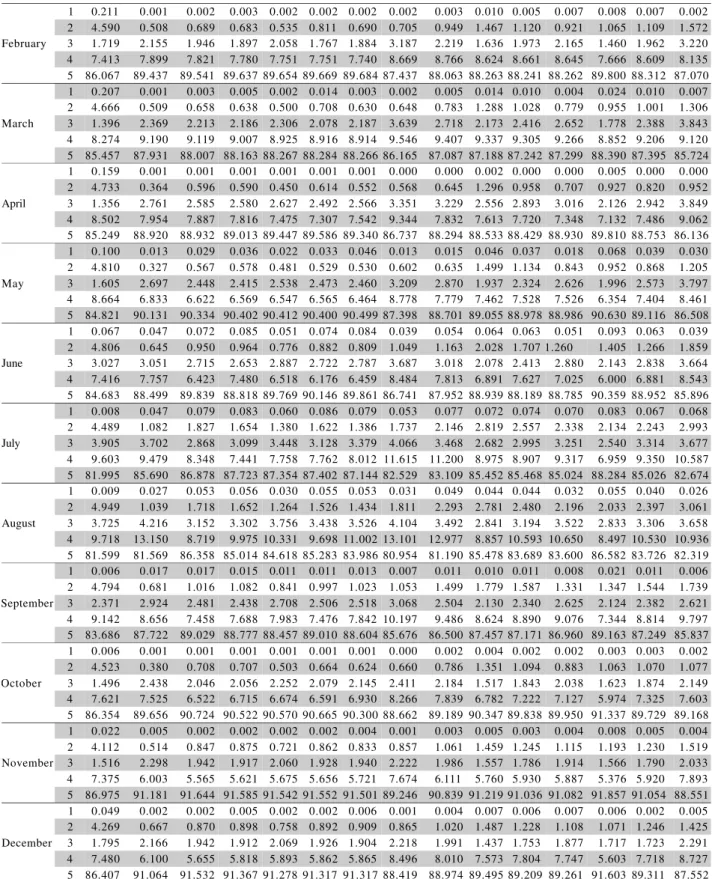
Table 2- World area (%) occupied by the classes of favorability for Black Sigatoka for each month at current date and 2020
(A2 and B2 scenarios) situations predicted by six climate change models and the multimodel ensemble.
A2 B2
Month Class Current CC1 CG2 CS3 EC4 GF5 HC6 AM CC1 CG2 CS3 EC4 GF5 HC6 AM 1 0.085 0.003 0.003 0.003 0.003 0.003 0.003 0.003 0.004 0.004 0.004 0.004 0.004 0.004 0.004 2 4.658 3.715 3.665 3.744 3.606 3.687 3.414 3.740 4.211 4.280 4.294 3.855 4.237 4.025 4.283 January 3 2.092 1.216 1.238 1.145 1.294 1.201 1.482 1.156 1.349 1.255 1.234 1.683 1.286 1.504 1.249 4 6.482 7.692 7.607 7.645 7.677 7.502 7.650 7.614 7.411 7.340 7.370 7.412 7.359 7.349 7.370 5 86.683 87.374 87.487 87.463 87.421 87.608 87.451 87.488 87.025 87.121 87.098 87.046 87.115 87.119 87.095 1 0.211 0.007 0.007 0.007 0.007 0.007 0.007 0.007 0.009 0.009 0.009 0.009 0.009 0.009 0.009 2 4.590 4.412 4.384 4.472 4.291 4.369 4.291 4.430 4.359 4.371 4.362 4.061 4.276 4.194 4.357 February 3 1.719 1.137 1.152 1.046 1.240 1.168 1.226 1.101 1.209 1.168 1.170 1.488 1.261 1.343 1.187 4 7.413 8.128 8.125 8.099 8.117 8.081 8.050 8.112 7.828 7.820 7.818 7.826 7.767 7.761 7.809 5 86.067 86.316 86.332 86.376 86.344 86.375 86.426 86.350 86.594 86.632 86.641 86.616 86.687 86.693 86.638 1 0.207 0.004 0.004 0.004 0.004 0.004 0.004 0.004 0.007 0.007 0.007 0.008 0.007 0.007 0.007 2 4.666 4.149 4.228 4.261 4.013 4.222 3.720 4.193 4.377 4.465 4.435 3.952 4.458 4.130 4.361 March 3 1.396 1.194 1.096 1.051 1.298 1.071 1.578 1.117 1.313 1.163 1.259 1.690 1.202 1.514 1.294 4 8.274 8.909 8.881 8.899 8.850 8.931 8.844 8.888 8.495 8.459 8.538 8.487 8.475 8.451 8.493 5 85.457 85.744 85.791 85.785 85.836 85.771 85.854 85.798 85.808 85.906 85.760 85.863 85.857 85.897 85.845 1 0.159 0.006 0.004 0.003 0.005 0.005 0.005 0.005 0.006 0.004 0.005 0.005 0.006 0.005 0.005 2 4.733 3.873 3.925 3.929 3.561 3.945 3.501 3.887 3.955 4.042 4.057 3.483 4.103 3.750 3.995 April 3 1.356 1.335 1.341 1.305 1.647 1.278 1.722 1.337 1.491 1.422 1.493 2.009 1.376 1.691 1.477 4 8.502 8.547 8.565 8.614 8.486 8.515 8.580 8.548 8.337 8.336 8.484 8.375 8.384 8.335 8.372 5 85.249 86.240 86.165 86.150 86.301 86.258 86.192 86.224 86.211 86.196 85.961 86.128 86.132 86.219 86.151 1 0.100 0.010 0.010 0.010 0.010 0.010 0.010 0.010 0.008 0.008 0.008 0.008 0.008 0.008 0.008 2 4.810 4.002 4.032 4.031 3.735 3.953 3.692 3.976 3.967 4.072 3.976 3.569 4.023 3.591 3.926 May 3 1.605 1.578 1.545 1.555 1.851 1.619 1.872 1.602 1.610 1.500 1.607 2.017 1.567 1.987 1.656 4 8.664 8.280 8.320 8.267 8.256 8.190 8.167 8.246 8.274 8.251 8.300 8.213 8.226 8.187 8.250 5 84.821 86.130 86.093 86.137 86.148 86.228 86.258 86.166 86.142 86.170 86.110 86.193 86.176 86.228 86.160 1 0.067 0.035 0.032 0.032 0.035 0.032 0.034 0.033 0.035 0.035 0.036 0.041 0.037 0.035 0.036 2 4.806 4.316 4.390 4.390 3.906 4.252 4.173 4.299 4.391 4.461 4.517 4.032 4.457 4.289 4.393 June 3 3.027 2.129 2.059 2.055 2.554 2.191 2.267 2.148 2.068 1.988 1.938 2.437 1.987 2.165 2.062 4 7.416 7.328 7.424 7.243 7.381 7.257 7.286 7.332 7.465 7.393 7.407 7.400 7.384 7.365 7.408 5 84.683 86.191 86.096 86.281 86.124 86.268 86.240 86.189 86.040 86.122 86.102 86.090 86.136 86.145 86.101 1 0.008 0.029 0.028 0.029 0.030 0.030 0.029 0.029 0.023 0.022 0.025 0.025 0.023 0.029 0.024 2 4.489 4.037 3.989 4.228 3.878 4.044 4.167 4.096 4.099 4.072 4.223 4.101 4.301 4.269 4.215 July 3 3.905 3.058 3.093 2.850 3.242 3.041 2.926 2.998 3.153 3.149 3.018 3.159 2.937 2.981 3.029 4 9.603 9.692 9.860 9.910 10.184 10.055 9.830 9.898 10.649 9.879 9.991 10.177 10.173 10.083 10.008 5 81.995 83.185 83.031 82.983 82.665 82.830 83.048 82.979 82.077 82.878 82.744 82.538 82.566 82.638 82.725 1 0.009 0.026 0.023 0.025 0.027 0.027 0.028 0.026 0.019 0.020 0.019 0.021 0.020 0.022 0.020 2 4.949 3.887 3.858 4.127 3.779 3.994 3.924 4.032 3.918 4.209 4.317 4.139 4.208 4.155 4.283 August 3 3.725 3.093 3.106 2.844 3.218 2.997 3.058 2.948 3.559 3.225 3.150 3.339 3.224 3.314 3.179 4 9.718 10.503 10.242 10.520 10.894 10.630 10.569 10.537 10.189 9.583 10.024 10.129 10.041 9.946 9.955 5 81.599 82.490 82.770 82.483 82.083 82.352 82.421 82.457 82.314 82.964 82.490 82.372 82.507 82.563 82.562 1 0.006 0.005 0.005 0.015 0.005 0.005 0.005 0.005 0.007 0.007 0.007 0.007 0.007 0.007 0.007 2 4.794 3.007 3.018 1.082 2.908 2.999 2.993 3.050 3.028 3.124 3.227 2.939 3.091 2.988 3.106 September 3 2.371 2.041 2.002 2.438 2.140 2.015 2.026 1.977 2.247 2.119 2.022 2.322 2.145 2.254 2.144 4 9.142 10.243 10.017 7.688 10.220 10.021 10.104 10.089 10.545 10.221 10.476 10.493 10.254 10.393 10.368 5 83.686 84.704 84.957 88.777 84.727 84.960 84.873 84.879 84.173 84.529 84.268 84.238 84.503 84.358 84.375
1CCSR/NIES (Centre for Climate Research Studies Model); 2CSIROMk2 (Commonwealth Scientific and Industrial Research Organization
GCM mark 2);3CGCM2 (Canadian Global Coupled Model version 2); 4ECHAM4 (European Centre Hamburg Model version 4); 5GFDL-R30 (Geophysical Fluid Dynamics Laboratory, R-30 resolution model); 6HadCM3 (Hadley Centre Coupled Model version 3); 7Multimodel ensemble.
Table 2 - Continuation.
1 0.006 0.005 0.005 0.005 0.005 0.005 0.005 0.005 0.007 0.006 0.006 0.006 0.006 0.006 0.006 2 4.523 2.492 2.540 2.527 2.318 2.396 2.361 2.451 2.687 2.797 2.787 2.427 2.778 2.453 2.717 October 3 1.496 1.017 0.938 0.954 1.180 1.103 1.133 1.039 1.173 1.021 1.055 1.418 1.041 1.371 1.112 4 7.621 9.081 8.806 8.793 8.907 9.065 9.021 8.922 8.643 8.340 8.390 8.485 8.325 8.417 8.429 5 86.354 87.404 87.711 87.721 87.590 87.431 87.480 87.583 87.489 87.836 87.762 87.664 87.849 87.752 87.736 1 0.022 0.005 0.005 0.005 0.005 0.005 0.005 0.005 0.006 0.006 0.006 0.006 0.006 0.006 0.006 2 4.112 2.984 3.080 2.982 2.634 2.961 2.470 2.904 3.072 3.494 3.389 2.683 3.310 2.738 3.210 November 3 1.516 1.358 1.223 1.340 1.707 1.363 1.867 1.425 1.684 1.231 1.345 2.079 1.418 2.004 1.533 4 7.375 8.108 7.904 8.010 8.002 7.995 8.045 8.011 7.768 7.597 7.664 7.697 7.645 7.712 7.682 5 86.975 87.545 87.788 87.664 87.653 87.676 87.613 87.655 87.470 87.672 87.597 87.534 87.621 87.541 87.570 1 0.049 0.008 0.008 0.008 0.008 0.008 0.008 0.008 0.009 0.009 0.009 0.009 0.009 0.009 0.009 2 4.269 3.494 3.473 3.484 3.228 3.430 2.988 3.412 3.319 3.438 3.410 3.190 3.385 2.924 3.339 December 3 1.795 1.052 1.014 1.014 1.270 1.060 1.500 1.084 1.276 1.073 1.135 1.382 1.150 1.599 1.198 4 7.480 8.416 8.241 8.329 8.288 8.218 8.254 8.290 8.386 8.326 8.438 8.365 8.365 8.351 8.380 5 86.407 87.030 87.264 87.165 87.206 87.284 87.251 87.205 87.010 87.155 87.008 87.056 87.091 87.118 87.075
Continue...
Table 3 - World area (%) occupied by the classes of favorability for Black Sigatoka for each month at current date and 2050
(A2 and B2 scenarios) situations predicted by six climate change models and the multimodel ensemble.
A2 B2
Table 3 - Continuation.
1CCSR/NIES (Centre for Climate Research Studies Model); 2CSIROMk2 (Commonwealth Scientific and Industrial Research Organization
GCM mark 2);3CGCM2 (Canadian Global Coupled Model version 2); 4ECHAM4 (European Centre Hamburg Model version 4); 5GFDL-R30 (Geophysical Fluid Dynamics Laboratory, R-30 resolution model); 6HadCM3 (Hadley Centre Coupled Model version 3); 7Multimodel ensemble.
Continue...
Table 4 - World area (%) occupied by the classes of favorability for Black Sigatoka for each month at current date and 2080
(A2 and B2 scenarios) situations predicted by six climate change models and the multimodel ensemble.
1 0.067 0.057 0.065 0.064 0.062 0.063 0.061 0.063 0.051 0.043 0.044 0.042 0.043 0.043 0.044 2 4.806 2.332 2.576 2.526 1.994 2.374 1.804 2.275 2.957 3.240 3.048 2.637 2.967 2.877 2.966 June 3 3.027 2.330 2.050 2.100 2.655 2.252 2.829 2.361 2.537 2.210 2.420 2.855 2.486 2.581 2.504 4 7.416 8.006 7.765 7.750 7.749 7.571 7.597 7.672 8.758 8.127 8.247 8.289 8.103 8.102 8.205 5 84.683 87.276 87.544 87.560 87.540 87.741 87.709 87.629 85.697 86.380 86.241 86.177 86.401 86.397 86.281 1 0.008 0.047 0.053 0.051 0.050 0.051 0.046 0.049 0.069 0.107 0.059 0.071 0.059 0.084 0.070 2 4.489 2.826 3.089 3.023 2.745 2.932 2.542 2.907 3.427 3.586 3.541 3.300 3.519 3.450 3.532 July 3 3.905 2.864 2.547 2.624 2.934 2.696 3.123 2.751 3.204 2.930 3.069 3.333 3.065 3.132 3.067 4 9.603 10.490 9.851 9.492 10.021 10.124 9.980 9.798 11.027 9.173 9.662 10.055 9.771 9.828 9.730 5 81.995 83.773 84.460 84.810 84.250 84.197 84.309 84.496 82.274 84.204 83.670 83.241 83.586 83.506 83.602 1 0.009 0.040 0.042 0.041 0.037 0.043 0.038 0.041 0.029 0.030 0.029 0.027 0.029 0.028 0.029 2 4.949 2.614 2.961 2.865 2.544 2.765 2.674 2.803 3.080 3.727 3.576 3.241 3.564 3.393 3.518 August 3 3.725 3.147 2.749 2.848 3.199 2.951 3.093 2.935 3.594 2.880 3.066 3.431 3.062 3.282 3.133 4 9.718 10.452 9.437 9.803 10.418 10.363 10.360 10.107 10.482 9.069 9.728 10.186 10.250 10.079 9.905 5 81.599 83.747 84.811 84.443 83.803 83.878 83.835 84.115 82.814 84.294 83.601 83.114 83.094 83.218 83.415 1 0.006 0.012 0.012 0.010 0.009 0.009 0.010 0.010 0.010 0.010 0.009 0.007 0.009 0.009 0.009 2 4.794 2.025 2.059 2.027 1.667 1.925 1.818 1.913 2.300 2.411 2.243 1.893 2.201 2.192 2.207 September 3 2.371 2.037 1.945 1.967 2.359 2.075 2.192 2.101 2.069 1.889 2.073 2.447 2.111 2.125 2.119 4 9.142 9.795 9.178 9.263 9.529 9.239 9.284 9.365 9.907 9.243 9.394 9.545 9.424 9.373 9.481 5 83.686 86.131 86.807 86.733 86.436 86.752 86.696 86.610 85.715 86.447 86.281 86.108 86.254 86.302 86.184 1 0.006 0.004 0.005 0.005 0.004 0.005 0.005 0.004 0.005 0.006 0.005 0.004 0.005 0.005 0.005 2 4.523 1.379 1.651 1.633 1.227 1.505 1.367 1.459 1.541 1.909 1.754 1.311 1.784 1.724 1.671 October 3 1.496 1.664 1.326 1.351 1.782 1.480 1.635 1.547 1.669 1.211 1.411 1.883 1.343 1.411 1.488 4 7.621 8.067 7.328 7.250 7.426 7.335 7.574 7.482 7.770 7.028 7.106 7.291 7.201 7.229 7.271 5 86.354 88.885 89.690 89.761 89.560 89.675 89.419 89.508 89.014 89.846 89.724 89.511 89.666 89.630 89.565 1 0.022 0.005 0.005 0.009 0.005 0.005 0.012 0.005 0.006 0.007 0.007 0.006 0.007 0.007 0.006 2 4.112 1.446 1.733 1.678 1.342 1.587 1.513 1.554 1.944 2.159 1.979 1.671 1.923 1.957 1.939 November 3 1.516 1.604 1.288 1.355 1.702 1.455 1.521 1.489 1.595 1.352 1.544 1.867 1.599 1.562 1.586 4 7.375 7.481 7.207 7.236 7.238 7.250 7.322 7.297 7.830 7.596 7.685 7.714 7.658 7.676 7.693 5 86.975 89.464 89.767 89.722 89.713 89.703 89.632 89.655 88.625 88.887 88.786 88.742 88.813 88.798 88.775 1 0.049 0.007 0.007 0.007 0.007 0.007 0.009 0.007 0.009 0.009 0.009 0.009 0.008 0.009 0.009 2 4.269 1.493 1.758 1.679 1.391 1.598 1.512 1.574 2.191 2.489 2.213 1.623 1.960 1.963 2.099 December 3 1.795 1.556 1.233 1.341 1.648 1.416 1.503 1.448 1.514 1.134 1.456 2.052 1.702 1.670 1.561 4 7.480 8.298 8.025 8.149 8.181 8.123 8.167 8.167 8.691 8.423 8.576 8.530 8.542 8.466 8.548 5 86.407 88.646 88.977 88.823 88.773 88.856 88.809 88.804 87.596 87.945 87.746 87.786 87.788 87.893 87.783
A2 B2
Table 4 - Continuation.
1CCSR/NIES (Centre for Climate Research Studies Model); 2CSIROMk2 (Commonwealth Scientific and Industrial Research Organization
GCM mark 2);3CGCM2 (Canadian Global Coupled Model version 2); 4ECHAM4 (European Centre Hamburg Model version 4); 5GFDL-R30 (Geophysical Fluid Dynamics Laboratory, R-30 resolution model); 6HadCM3 (Hadley Centre Coupled Model version 3); 7Multimodel ensemble.
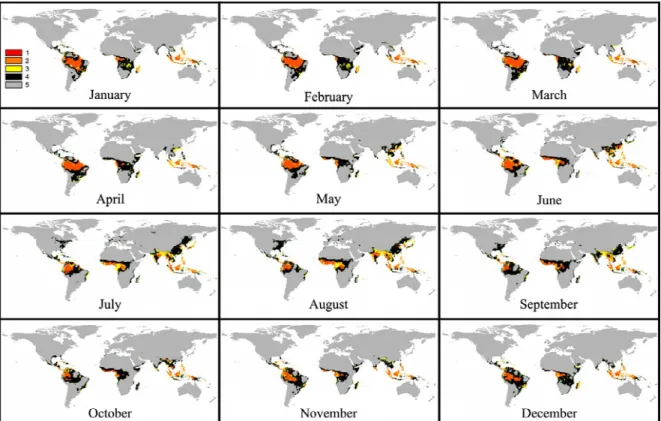
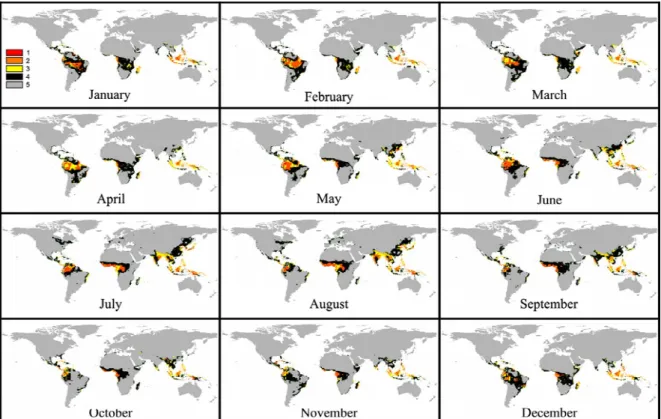
Figure 1- Maps representing current (1961-1990 average) worldwide spatial distribution of the classes of favorabilityfor Black Sigatoka (BS) for January to December, where Class 1: highly favorable to BS; Class 2: favorable to BS; Class 3: relatively favorable to BS; Class 4: little favorable to BS and Class 5: unfavorable to BS.
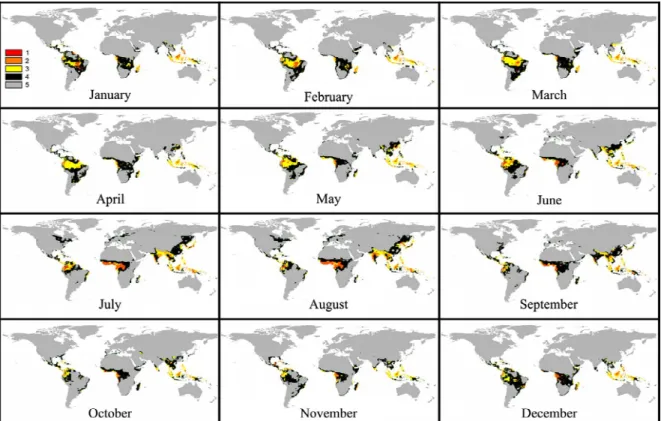
Figure 3 - Maps representing future worldwide spatial distribution of the classes of favorability for Black Sigatoka (BS), predicted by the use of the “multimodel emsemble”, for January to December, for the decade of 2020 (B2 scenario), where Class 1: highly favorable to BS; Class 2: favorable to BS; Class 3: relatively favorable to BS; Class 4: little favorable to BS and Class 5: unfavorable to BS.
Figure 5 - Maps representing future worldwide spatial distribution of the classes of favorability for Black Sigatoka (BS), predicted by the use of the “multimodel emsemble”, for January to December, for the decade of 2050 (B2 scenario), where Class 1: highly favorable to BS; Class 2: favorable to BS; Class 3: relatively favorable to BS; Class 4: little favorable to BS and Class 5: unfavorable to BS.
where they are disseminated by air currents (Meredith
et al., 1973). Conidia germinate over a wider range of
relative humidity (92 to 100%) as compared to
as-cospores (98 to 100%). The effect of temperature on
the germination can be characterized by a quadratic
response function, with an estimated optimum at
26.5ºC. Stover (1983) observed maximum growth of
ascospore germ tubes at 26 to 28ºC after 24 h
incu-bation. The optimal temperature range for disease
de-velopment was 25–28ºC (Jacome et al., 1991; Jacome
& Schuh, 1992).
Regarding the worldwide geographical
distri-bution of the disease considering current and future
periods, the results suggested that for both scenarios
(A2 and B2) there will be a decrease in areas
classi-fied as 1 (highly favorable), 2 (favorable) and 3
(rela-tively favorable) and an increase of areas classified at
4 (little favorable) and 5 (unfavorable) (Figures 1 to
7) (Tables 2 to 4). These changes will be gradual for
the decades of 2020, 2050 and 2080, with some
ex-ceptions that will be presented later in this paper.
Re-sults are in agreement with Ghini et al. (2007) who
predicted that there will be a reduction of the
favor-able area to BS in Brazil in the future. Other authors
also showed changes on the spatial distribution of
favorability classes for other pathosystems in the
fu-ture, like Carter et al. (1996), Boag et al. (1991),
Brasier & Scott (1994) and Brasier et al. (1996).
Variation in the worldwide geographical
distri-bution of the disease will be higher for the A2
sce-nario as compared to B2, and will be different for the
decades of 2020, 2050 and 2080 (Figures 1 to 7 and
Tables 2 to 4). These findings are consistent with those
of Ghini et al. (2007) on the probable impacts of
cli-matic changes on BS in Brazil. The authors concluded
that there will be a reduction in the favorable area to
the disease in the Brazil and that the reduction will be
higher for A2 scenario than for B2.
Some exceptions were detected, for example
classes 3 and 4 in 2080. For class 3, an increase was
observed in the area occupied by the same for
sce-nario A2, which probably is related to the fact that
some world areas that are not so warm (e.g.
subtropi-cal areas) will become favorable to the disease with
an increase in temperature, especially when
consider-ing the interval between 20–25
oC.
In the case of class 4, a decrease was also
ob-served in the area represented by the same for the A2
scenario in 2080 which could be explained by a greater
decrease in relative humidity for this decade. Gauhl
(1994) reported that there is a reduction in the
pro-duction of inoculum of
M. fijiensis
during drier (or
less rainy) months of the year in the Caribbean zone
of Costa Rica, which is also the season with the
low-est temperature. Others studies pointed out that
suc-cessful infection is promoted by extended periods of
high humidity and the presence of free water on leaves
(Mayorga, 1990; Fullerton, 1994).
Analysis of the geographical distribution of the
disease among months showed that in the future there
will be a displacement in the worldwide geographical
distribution of BS (Figures 1 to 7) in which
unfavor-able areas could become favorunfavor-able and vice-versa as
a function of increases in temperature and/or decreases
in relative humidity. Colder months in the southern
hemisphere (June, July and August), which are
con-sidered less favorable for the disease development at
the current climatic conditions, could become more
favorable due to increases in temperature. On the other
hand, months which presented higher temperatures in
this hemisphere (November, December and January)
could become unfavorable to BS because of the
ex-treme increases in the temperature and/or decreases
in relative humidity. A great reduction in the areas of
classes 1 (highly favorable), 2 (favorable) and 3
(rela-tively favorable) in November and December in the
southern hemisphere will probably occur. This
reduc-tion will likely be lower in June and July. Thus,
favorability will probably be gradually displaced from
November to May (current condition) to January to
July, for the years 2020 to 2080.
On the other hand, no such displacement was
evident in the northern hemisphere for the classes
among months of the year, due to hemispheric
asym-metries in climate change predictions. Months most
likely favorable to disease development will continue
to be May to October. Additionally, it was clear from
the results that areas occupied by classes 1, 2, 3 and
4 of the aforementioned months will increase,
particu-larly in Southeast Asia, India and center-east United
States. Thus, conditions of favorability to BS will be
displaced northward.
When we consider three main worldwide
ba-nana producers (FAO, 2007) it is possible to conclude
that spatial distribution of Black Sigatoka will be
dif-ferent in each country. For example, in the case of
Bra-zil a gradual reduction in the favorable area to BS
prob-ably will occur in the decades of 2020, 2050 and 2080.
However, favorable areas to the disease will probably
increase in India and China if IPCC scenarios remain
consistent.
Information available in the literature could help
us to explain differences that will occur with spatial
distribution of BS in the future. Simulations carried out
in this study showed that the class 4 of favorability to
disease development in Brazil tends to increase. This
will be a function of a decrease in relative humidity
which could increase incubation and latent periods
(lower numbers of pathogen cycles per year). Thus,
the importance of the disease will probably be lower.
In India and China, the situation will be the inverse.
Disease development is strongly related to
weather conditions and plant susceptibility. Under very
favorable conditions in Costa Rica and with a
suscep-tible host, incubation periods of
M. fijiensis
can be as
short as 13 to 14 days, whereas during periods of
un-favorable weather, the duration of the incubation
pe-riod can extend up to 35 days (Marín et al, 2003).
Simi-lar reports exist for Nigeria on plantains (Mobambo et
al., 1996). During the rainy season, the incubation
pe-riod was 14 days but in the dry season 24 days.
Dif-ferences in the latent period from December 1993 to
May 1995 for the susceptible cultivar Grande Nine,
which is widely used for the fresh banana market, were
observed in Guapiles, Costa Rica (Marín et al., 2003).
The latent period ranged from 25 days during the rainy
season (June to December) to 70 days during the dry
season at the same locality. When the weather is highly
conducive for ascospore discharge and infection, many
infections occur on the leaves. When infections are
dense, they rapidly coalesce at a very early stage of
development, accelerating the appearance of mature
spots that are characterized by the presence of
pseudothecia and ascospores (Fouré et al., 1984).
Un-der theses conditions, leaves are rapidly and severely
damaged.
In a general way, the use of the “multimodel
ensemble” allowed reduction in the variability of
simu-lation compared with data estimated by each model
in-dividually (Tables 2 to 4). It is important to point out
that the “multimodel ensemble” analysis was used with
success in other studies (Bergot et al., 2004; Cerri et
al., 2007; Ghini et al., 2007; Marengo, 2007), not only
related to Black Sigatoka or plant diseases. The adopted
methodology allows the comparison between results
obtained by each model and by the average of all
(“multimodel ensemble”). This comparison could be
extremely useful to direct and help new researches
about the use of climate change models on the spatial
distribution of plant diseases.
same decade variations were detected for the results
of classes 3 (January and June) and 4 (April and
No-vember). Thus, caution should be taken when using
the “multimodel ensemble”. More studies are
neces-sary to reduce these uncertainties.
Climate changes certainly will affect the
devel-opment of the plant. For the current conditions,
ba-nana is cultivated in more than 100 countries
through-out the world, however, in the future changes in
weather conditions may result in some areas
being unsuitable for banana cultivations, causbeing
com-mercial changes. Such situation, however, can be
pre-vented with genetic improvement. In the same way,
the pathogen can suffer more selection pressure.
Pre-diction of the effect of climate change on pathogens
and plants is difficult and speculative because the
mag-nitude and range of these changes is very uncertain
(Boag et al., 1991; Hillier, 1993). Nevertheless, although
speculative, published data has suggested potential
problems that may exist under a modified climate
(IPCC, 2007).
Most plant disease models use different
weather variables and operate at different spatial and
temporal scales than do the global climate models.
Im-provements in the methodology are necessary to
real-istically assess disease impacts at a global scale.
Experimental research on a diverse range of
disease systems is necessary to improve
comprehen-sion of climate change impacts. Given the multitude
of atmospheric and climatic factors, the possible
change in scenarios and the number of disease
sys-tems, modeling approaches to impact assessment need
to be strengthened. For instance, changes in both mean
temperature and its variability are equally important in
predicting the potential impact of climate change
(Scherm & Bruggen, 1994). Given that climate change
is a global issue, the focus needs to shift from
pad-dock-based assessment on specific diseases to a more
ecologically relevant spatial unit (Scherm et al., 2000)
to consider climate with other associated changes in
land use and vegetation cover (Luo et al., 1995),
among others.
Results obtained in this study could help to
an-swer two important questions: (i) could preventative
measures delay or prevent further spread of the
dis-ease?; and (ii) are those countries threatened by the
disease taking measures to prevent the entry of the
pathogen?
ACKNOWLEDGEMENTS
To CNPq (project 473999/2006-4), and for
first author’s support also by CNPq (project 308596/
2006-4).
REFERENCES
BERGOT, M.; CLOPPET, E.; PÉRARNAUD, V.; DÉQUÉ, M.; MARÇAIS, B.; DESPREZ-LOUSTAU, M.L. Simulation of potential range expansion of oak disease caused byPhytophthora cinnamomi under climate change. Global Change Biology, v.10, p.1539-1552, 2004.
BOAG, B.; CRAWFORD, J.W.; NEILSON, R. The effect of potential climatic changes on the geographical distribution of the plant-parasitic nematodes Xiphinema and Longidorus in Europe. Nematologica, v.37, p.312-323, 1991.
BOURGEOIS, G.; BOURQUE, A.; DEAUDELIN, G. Modelling the impact of climate change on disease incidence: a bioclimatic challenge. Canadian Journal of Plant Pathology, v.26, p.284-290, 2004.
BRASIER, C.M.; DREYER, E.; AUSSENAC, G. Phytophthora cinnamomi and oak decline in southern Europe. Environmental
constraints including climate change. Annales des Sciences Forestieres, v.53, p.347-358, 1996.
BRASIER, C.M.; SCOTT, J.K. European oak declines and global warming: a theoretical assessment with special reference to the activity of Phytophthora cinnamomi. Bulletin OEPP/EPPO Bulletin, v.24, p.221-232, 1994.
CARLIER, J.; FOURÉ, E.; GAUHL, F.; JONES, D.R.; LEPOIVRE, P.; MOURICHON, X.; PASBERG-GAUHL, C.; ROMERO, R.A. Black leaf streak. In: JONES, D.R. (Ed.) Diseases of banana, abacá and enset. Wallingford: CAB International, 2000. p.37-79. CARTER, T.R.; SAARIKKO, R.A.; NIEMI, K.J. Assessing the risks
and uncertainties of regional crop potential under a changing climate in Finland. Agricultural and Food Science in Finland, v.5, p.329-350, 1996.
CERRI, C.E.P.; SPAROVEK, G.; BERNOUX, M.; EASTERLING, W.E.; MELILLO, J.M.; CERRI, C.C. Tropical agriculture and global warming: impacts and mitigation options. Scientia Agricola, v.64, p.83-99, 2007.
CHAKRABORTY, S.; TIEDEMANN, A.V.; TENG, P.S. Climate change: potential impact on plant diseases. Environmental Pollution, v.108, p.317-326, 2000.
CHAKRABORTY, S.; MURRAY, G.M.; MAGAREY, P.A.; YONOW, T.; SIVASITHAMPARAM, K.; O’BRIEN, R.G.; CROFT, B.J.; BARBETTI, M.J.; OLD, K.M.; DUDZINSKI, M.J.; SUTHERST, R.W.; PENROSE, L.J.; ARCHER, C.; EMMETT, R.W. Potential impact of climate change on plant diseases of economic significance to Australia. Australasian Plant Pathology, v.27, p.15-35, 1998.
FOOD AND AGRICULTURE ORGANIZATION - FAO. ProdSTAT. Available at: http://faostat.fao.org. Accessed 30 Jul. 2007. FOURÉ, E.; GRISONI, M.; ZURFLUH, R. Les cercosporiosis du
bananier et leurs traitements. Comportemente des variétés. Etude de la sensibilité variétale des bananiers et plantains B
Mycosphaerella fijiensis Morelet et de quelques caractéristiques biologiques de la maladie de rales noires au Gabon.Fruits, v.39, p.365-377, 1984.
FULLERTON, R.A. Sigatoka leaf diseases. In: PLOETZ, R.C.; ZENTMYER, G.A.; NISHIJINIA, W.T.; ROHRBACH, K.G.; OHR, H.D. (Ed.) Compendium of tropical fruit diseases. St Paul: American Phytopathological Society, 1994. p.12-14. GAUHL, F. Epidemiology and ecology of Black Sigatoka
(Mycosphaerella fijiensis Morelet) on plantain and banana (Musa spp.) in Costa Rica, Central America. Montpellier: INIBAP, 1994. 120p.
GHINI, R.; HAMADA, E.; GONÇALVES, R.R.V.; GASPAROTTO, L.; PEREIRA, J.C. Análise de risco das mudanças climáticas globais sobre a sigatoka-negra da bananeira no Brasil.
Fitopatologia Brasileira, v.32, p.197-204, 2007.
HILLIER, S. Climate change impacts on British vegetation creating tomorrow’s climate today. NERC News, v.26, p.27-29, 1993. IPCC. Climate change 2007: the physical science basis: summary for policymakers. Geneva: IPCC, 2007. 18p. Available at: http:/ /www.ipcc.ch/SPM2feb07.pdf. Accessed 10 Jun. 2007. IPCC. Climate change 2001: the scientific basis: summary for
policymakers. Geneva: IPCC, 2001. 20p. Available at: http:// www.ipcc.ch/pub/spm22-01.pdf. Accessed 10 Jun. 2007. JACOME, L.H.; SCHUH, W. Effects of leaf wetness duration and
temperature of development of black Sigatoka disease on banana infected by Mycosphaerella fijiensis var. difformis.
Phytopathology, v.82, p.515-520, 1992.
JACOME, L.H.; SCHUH, W.; STEVENSON, R.E. Effect of temperature and relative humidity on germination and germ tube development ofMycosphaerella fijiensis var.difformis.
Phytopathology, v.12, p.1480-1485, 1991.
LUO, Y.; TEBEEST, D.O.; TENG, P.S.; FABELLAR, N.G. Simulation studies on risk analysis of rice leaf blast epidemics associated with global climate change in several Asian countries.
Journal of Biogeography, v.22, p.673-678, 1995. MAYORGA, M.H. La Raya negra (Mycosphaerella fijiensis Morelet)
del plátano y del banano. I. Ciclo de vida del patógeno bajo las condiciones del Urabá. Revista ICA, v.25, p.69-77, 1990. MARENGO, J. Cenários de mudanças climáticas para o Brasil em
2100. Ciência & Ambiente, v.34, p.97-114, 2007. MARÍN, D.H.; ROMERO, R.A.; GUZMÁN, M.; SUTTON, T.B.
Black Sigatoka: an increasing threat to banana cultivation.Plant Disease, v.87, p.208-222, 2003.
MEREDITH, D.S.; LAWRENCE, J.S.; FIRMAN, I.D. Ascospore release and dispersal on black leaf streak disease of bananas (Mycosphaerella fijiensis). Transactions of the British Mycological Society, v.60, p.547-554, 1973.
MOBAMBO, K.M.; GAUHL, F.; PASBERG-GAUHL, C.; ZUOFA, K. Season and plant age effects evaluation of plantain for response to Black Sigatoka disease. Crop Protection, v.15, p.609-614, 1996.
MOULIOM-PEFOURA, A.; LASSOUDIÈRE, A.; FOKO, J.; FONTEM, D.A. Comparison of development ofMycosphaerella fijiensisandMycosphaerella musicola on banana and plantain in various ecological zones in Cameroon.Plant Disease, v.80, p.950-954, 1996.
MOURICHON, X.; CARLIER, J.; FOURÉ, J. Sigatoka leaf spot diseases. Montpellier: INIBAP, 1997. 4p. (Musa Disease Fact Sheet, 8).
NEW, M.; LISTER, D.; HULME, M.; MAKIN, I. A high-resolution data set of surface climate over global land areas. Climate Research, v.21, p.1-25, 2002.
ROMERO, R.A.; SUTTON, T.B. Reaction of four Musagenotypes at three temperatures to isolates ofMycosphaerella fijiensis
from different geographical regions. Plant Disease, v.81, p.1139-1142, 1997.
SCHERM, H. Climate change: can we predict the impacts on plant pathology and pest management? Canadian Journal of Plant Pathology, v.26, p.267-273, 2004.
SCHERM, H.; SUTHERST, R.W.; HARRINGTON, R.; INGRAM, J.S.I. Global networking for assessment of impacts of global change on plant pests. Environmental Pollution, v.108, p.333-341, 2000.
SCHERM, H.; BRUGGEN, A.H.C. van. Global warming and nonlinear growth: how important are changes in average temperature?Phytopathology, v.84, p.1380-1384, 1994. STOVER, R.H. The effect of temperature on ascospore germ tube
growth of Mycosphaerella musicola and Mycosphaerella fijiensis
var.difformis.Fruits, v.38, p.625-628, 1983.