Forestry trial data can be used to evaluate
climate-based species distribution models
in predicting tree invasions
Rethabile Frangenie Motloung1,2, Mark Peter Robertson1, Mathieu Rouget3, John Ross U. Wilson2,4
1 Centre for Invasion Biology, Department of Zoology and Entomology, University of Pretoria, Pretoria, South Africa 0002 2 Invasive Species Programme, South African National Biodiversity Institute, Kirstenbosch Rese-arch Centre, Private Bag x7, Claremont, South Africa 7735 3 Centre for Invasion Biology, School of Agricul-tural, Earth and Environmental Sciences, University of KwaZulu-Natal, Private Bag X01, Scottsville 3209 4 Centre for Invasion Biology, Department of Botany and Zoology, Stellenbosch University, Matieland, South Africa 7602
Corresponding author:Rethabile F. Motloung ([email protected])
Academic editor:Ingolf Kühn | Received 12 June 2013 | Accepted 26 September 2013 | Published 24 January 2014
Citation: Motloung RF, Robertson MP, Rouget M, Wilson JRU (2014) Forestry trial data can be used to evaluate climate-based species distribution models in predicting tree invasions. NeoBiota 20: 31–48. doi: 10.3897/neobiota.20.5778
Abstract
Climate is frequently used to predict the outcome of species introductions based on the results from spe-cies distribution models (SDMs). However, despite the widespread use of SDMs for pre- and post-border risk assessments, data that can be used to validate predictions is often not available until after an invasion has occurred. Here we explore the potential for using historical forestry trials to assess the performance of climate-based SDMs. SDMs were parameterized based on the native range distribution of 36 Australian acacias, and predictions were compared against both the results of 150 years of government forestry trials, and current invasive distribution in southern Africa using true skill statistic, sensitivity and speciicity. Classiication tree analysis was used to evaluate why some Australian acacias failed in trials while others were successful. Predicted suitability was signiicantly related to the invaded range (sensitivity = 0.87) and success in forestry trials (sensitivity = 0.80), but forestry trial failures were under-predicted (speciicity = 0.35). Notably, for forestry trials, the success in trials was greater for species invasive somewhere in the world. SDM predictions also indicate a considerable invasion potential of eight species that are currently naturalized but not yet widespread. Forestry trial data clearly provides a useful additional source of data to validate and reine SDMs in the context of risk assessment. Our study identiied the climatic factors required for successful invasion of acacias, and accentuates the importance of integration of status else-where for risk assessment.
Copyright Rethabile F. Motloung et al. This is an open access article distributed under the terms of the Creative Commons Attribution International Li-cense (CC BY 4.0), which permits unrestricted use, distribution, and reproduction in any medium, provided the original author and source are credited. www.pensoft.net/journals/neobiota Advancing research on alien species and biological invasions
Keywords
Species distribution models, model evaluation, Australian acacias, classiication tree, forestry, alien trees, invasions, Southern African Plant Invaders Atlas
introduction
Predicting which species will escape from forestry plantations and become invasive remains a challenge in invasion biology (Daehler et al. 2004). Such prediction is an essential requirement for proactive management (Ficetola et al. 2007). Propagule pres-sure, residence time, species traits, environmental factors, interactions of introduced species with the native species, and historical factors have all been indicated as drivers of invasion success (Castro-Díez et al. 2011; Křivánek et al. 2006; Lockwood et al. 2009; Pyšek et al. 2009; huiller et al. 2006; Wilson et al. 2007), with invasions from silviculture as no exception (Castro-Díez et al. 2011; Gallagher et al. 2011). However, climate plays a fundamental role in determining species distributions (Gaston 2003), and the predictive success of invasive risk assessments is still largely a function of inva-siveness elsewhere and climate suitability (Hulme 2012).
Species distribution models (SDMs) have been widely used to predict invasions (Elith and Leathwick 2009; Pauchard et al. 2004; Peterson 2003; Zhu et al. 2007). An SDM is a mathematical description of the species distribution in environmental space that can be used to predict the distribution of species in geographic space (Peterson et al. 1999). he models combine species occurrence records and environmental variables (Peterson and Holt 2003) to create a climatic envelope model. he resulting model can be projected to any geographic space to identify regions that are suitable for species. he models can be based on native distribution records, introduced distribution records, or both (Steiner et al. 2008). SDMs can therefore be used to identify areas that are suitable for species even before introduction to predict which areas are likely to be invaded (Guisan and Zimmer-mann 2000). SDMs have considerable potential in risk assessment but they are seldom tested in predicting successful tree establishments but see Nuñez and Medley (2011).
he use of SDMs in management of invasive species can be considerably improved by independent datasets to validate SDM predictions (Allouche et al. 2006; Fielding and Bell 1997). Appropriate datasets should contain information on species that were repeatedly introduced in diferent localities with a clear indication of introduction out-come (i.e. success or failure). It is important that the records on introduction outout-come explicitly indicate which factors inluenced the outcome (e.g. climate or biotic). How-ever, these ideal datasets are rarely available. herefore, invaded range data have been used to evaluate SDM predictions (McGregor et al. 2012b; Nuñez and Medley 2011; Nel et al. 2004; Rouget et al. 2004; Wilson et al. 2007). However, such analyses are limited to established widespread invasive species, ignoring any failed introductions.
In-troduced forestry species contribute to the economies of many countries, but can also cause major problems as invaders of natural and semi-natural ecosystems (Essl et al. 2010, 2011; Richardson and Rejmánek 2011). Such introductions have often been well documented, for example government forestry trials throughout southern Africa were reviewed by (Poynton 1979a, b; 2009). he data from these trials provide histori-cal information on intentional introductions and on their outcome, making it possible to explore factors inluencing the success of introductions across diferent areas.
he aims of this study are to evaluate species distribution models using both for-estry trial data and invaded range data, and to investigate why some trials succeeded while others failed. To do this, we narrowed the taxonomic range to a well studied group, Australian acacias. Australian acacias are a good model group to understand plant invasions because Acacia is a speciose genus that contains many introduced and invasive species (Richardson et al. 2011). hey are also a good group for exploring SDMs because native ranges in Australia and introduced ranges in southern Africa are well known and documented (Van Wilgen et al. 2011). Around 80 Australian acacias have been introduced in southern Africa, 36 of which were included in forestry trials (Richardson et al. 2011; Poynton 2009, Table 1). Currently, sixteen Acacia species are conirmed as invasive and three species are reported to be naturalized, but it is not clear whether other species are also likely to invade or not (Richardson et al. 2010, 2011; Van Wilgen et al. 2011; Wilson et al. 2011).
First we used data on the outcome of forestry trials and data on invasive plant distribu-tions to evaluate SDMs. We then assessed why some forestry trials succeeded but others failed. Lastly, we determine which introduced species have a large potentially suitable but not currently occupied range, i.e. which species have a high invasion debt (Essl et al. 2011).
Methods
Study species and datasets
Species distribution models for Australian acacias were calibrated using occurrence records from their native range (Australia) and then projected to southern Africa based on Richardson et al. (2011) approach. he models were evaluated using presence re-cords from the invaded range in the Southern African Plant Invaders Atlas (SAPIA: Henderson 2007) and records of success and failure obtained from government for-estry trials (Poynton 2009).
Species distribution modelling
Model calibration
Here we chose a simple SDM approach that was quick to implement. he models were originally developed for 838 Australian Acacia species (Richardson et al. 2011). he approach was slightly modiied as our pilot study indicated that some of the species ranges were under-predicted when using the exact approach. Minimum and maximum values for each variable over the range of species occurrence were used to deine the range of each species. We also decided to use four predictor variables instead of six as this gave more sensible predictions. he model that we produced is equivalent to the marginal range of BIOCLIM but uses only four predictor variables (Nix 1986).
We obtained a dataset of occurrence records for the selected species (Table 1) from the Australian Virtual Herbarium (accessed 29th June 2010) with only one occurrence
record retained per 10 minute grid cell for each species to reduce spatial sampling bias. Richardson et al. (2011) reported that to clean data all names were checked against the native species list while hybrid, varieties, subspeciic information and authorities were generally removed for simplicity and to make the list comparable. he four bioclimatic variables used to build the SDMs were annual mean temperature (Bio_1), maximum temperature of the warmest month (Bio_5), minimum temperature of coldest month (Bio_6), and annual precipitation (Bio_12) all obtained at a 10 minute spatial resolu-tion from Worldclim [www.worldclim.com (Hijmans et al. 2005)].
For each species we calculated the minimum and maximum values extracted from occurrence records for each predictor variable. hese values were used to identify the range of values that each species could tolerate. For each species, we reclassiied each of the four predictor variable maps into a map consisting of presence (value = 1) or ab-sence (value = 0), using the minimum and maximum values calculated for that species. We then multiplied these presence/absence maps to generate a inal map indicating the potential distribution of that species. he analysis was conducted using the R statistical software (v. 2.11, R Development Core Team 2010). he models were projected to southern Africa to identify climatically suitable regions for each species.
Model evaluation
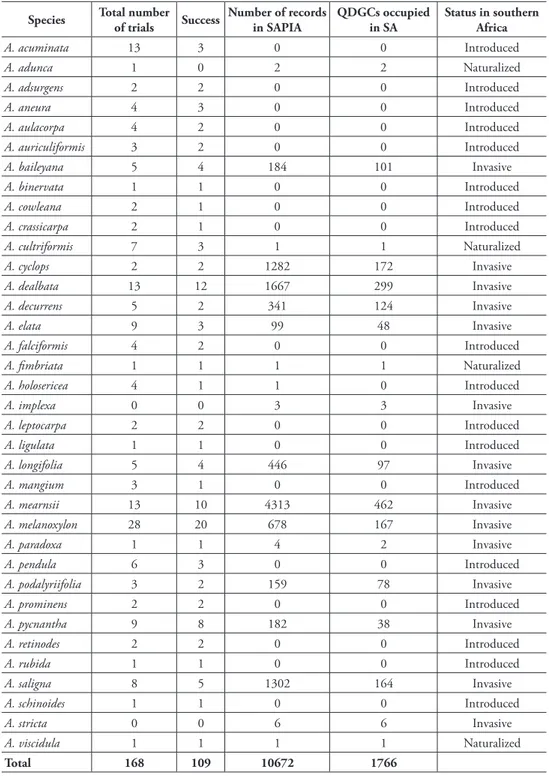
table 1.he number of government forestry trials, the number of successful trials; the number of re-cords in SAPIA, the number of QDGCs occupied in South Africa, Lesotho and Swaziland; and status in southern Africa for the species explored in the study.
Species Total number of trials Success Number of records in SAPIA QDGCs occupied in SA Status in southern Africa
A. acuminata 13 3 0 0 Introduced
A. adunca 1 0 2 2 Naturalized
A. adsurgens 2 2 0 0 Introduced
A. aneura 4 3 0 0 Introduced
A. aulacorpa 4 2 0 0 Introduced
A. auriculiformis 3 2 0 0 Introduced
A. baileyana 5 4 184 101 Invasive
A. binervata 1 1 0 0 Introduced
A. cowleana 2 1 0 0 Introduced
A. crassicarpa 2 1 0 0 Introduced
A. cultriformis 7 3 1 1 Naturalized
A. cyclops 2 2 1282 172 Invasive
A. dealbata 13 12 1667 299 Invasive
A. decurrens 5 2 341 124 Invasive
A. elata 9 3 99 48 Invasive
A. falciformis 4 2 0 0 Introduced
A. imbriata 1 1 1 1 Naturalized
A. holosericea 4 1 1 0 Introduced
A. implexa 0 0 3 3 Invasive
A. leptocarpa 2 2 0 0 Introduced
A. ligulata 1 1 0 0 Introduced
A. longifolia 5 4 446 97 Invasive
A. mangium 3 1 0 0 Introduced
A. mearnsii 13 10 4313 462 Invasive
A. melanoxylon 28 20 678 167 Invasive
A. paradoxa 1 1 4 2 Invasive
A. pendula 6 3 0 0 Introduced
A. podalyriifolia 3 2 159 78 Invasive
A. prominens 2 2 0 0 Introduced
A. pycnantha 9 8 182 38 Invasive
A. retinodes 2 2 0 0 Introduced
A. rubida 1 1 0 0 Introduced
A. saligna 8 5 1302 164 Invasive
A. schinoides 1 1 0 0 Introduced
A. stricta 0 0 6 6 Invasive
A. viscidula 1 1 1 1 Naturalized
he role of forestry trials and invaded range data for SDMs evaluation
Government forestry trials
In southern Africa, forestry trials for Australian acacias were conducted at 67 stations from the 1820s to the 1960s for 36 species (Poynton 2009). Trial data include records on introduction date (that can be used to quantify the importance of residence time in explaining invasions), and the number of stations and the number of times that a species was trialled (that can be used to quantify the efect of propagule pressure). he forestry trials dataset covers ten countries (namely, Angola, Botswana, Lesotho, Ma-lawi, Mozambique, Namibia, South Africa, Swaziland, Zambia, and Zimbabwe), i.e. most of southern Africa.
Of the 168 forestry trial records obtained from this dataset, 129 records had pre-cise geographic location and trial outcome and could be used to evaluate the SDMs (see Table 1). While subspeciic taxa can occupy diferent climatic niches (hompson et al. 2011), for simplicity and as naming was not consistent or veriiable, all species that had varieties or subspecies were grouped together (e.g. plantings of Acacia longifo-lia subsp. longifolongifo-lia and Acacia longifolongifo-lia ssp. sophorae were considered jointly as Acacia longifolia). We also only analysed species with four or more trials. his gave 14 Austral-ian acacias with which to evaluate SDMs and the relative importance of variables in explaining the outcome of the forestry trials. We quantiied the accuracy of predictive power of SDMs for each species (n=14) found in forestry trials by calculating true skill statistic, sensitivity and speciicity.
Southern African Plant Invaders Atlas (SAPIA)
his dataset contains records for over 700 naturalized and invasive species, with in-formation on abundance, habitat preferences, time of introduction and distribution (Henderson 1998). Here we restricted our analyses to Lesotho, South Africa and Swa-ziland as the other regions are relatively poorly sampled and use the SAPIA version ac-cessed April 2012. he accuracy of SDMs for each species (n=11) found in SAPIA was quantiied by calculating sensitivity only as SAPIA is a presence only dataset.
Why did some forestry trials succeed while others failed?
were obtained from Richardson et al. (2011). Climatic suitability was coded as either suitable or unsuitable as predicted by SDMs and biotic factors [e.g. whether seeds or seedlings were eaten by hares or birds as recorded in Poynton (2009)] were coded as either yes or no depending on trial outcome.
he classiication tree was constructed by repeatedly splitting data, deined by a simple rule based on a single explanatory variable at each split. At each split, the data were partitioned into two exclusive groups, each of which was as homogeneous as possible (Breiman et al. 1984). An optimal tree was then determined by testing for misclassiication error rates for the largest tree as well as for every smaller tree by ten-fold cross-validation constructed in CART Pro Ex v. 6.0. he program builds a nested sequence of branches by recursively snipping of the less important splits in terms of explained deviance. he length of the tree was controlled by choosing the one-SE rule, which minimizes cross-validated error within one standard error of the minimum cost tree rule (Pyšek et al. 2009).
Which species that are not yet widespread have a large potential suitable range?
Occupancy of each species was calculated at the quarter degree grid cell (QDGC, 15 min. × 15 min.) level. he current distribution of Australian acacias in Lesotho, South table 2. Variables used to quantify why some forestry trials of Acacia species in southern Africa suc-ceeded while others failed.
Variable Coded Criteria Justiication Data sources
Trial
outcome 0/1
0- failure (absence)
1-success (presence) Poynton (2009)
Biotic Y/N
Did species fail because seeds were eaten by animals
and birds?
Biotic factors have been indicated to inluence survival that can lead to naturalization (Nuñez and Medley 2011)
Poynton (2009)
Climatic
suitability 0/1
0-Climate not suitable 1-Climate suitable
Climatic suitability is widely used to predict outcome of introductions
McGregor et al. (2012).
Species distribution models Climatic variables Bio_1,bio_5, bio_6, bio_12
Annual Mean temperature, Maximum Temperature of the Warmest Month, Minimum Temperature of the Coldest Month &
Annual precipitation
Did trials succeed because of precipitation and temperature ranges? Castro-Díez et al. (2011)
Hijmans et al. (2006)
Biome Names South African biomes
Were trials successful because of the biomes they
were introduced to? Rouget et al. (2004)
Mucina and Rutherford
(2006)
Status
Introduced, Natura-lized or invasive (sensu Richardson et
al. 2000)
Invasiveness elsewhere according to Richardson et
al. (2011)
Invasiveness elsewhere is one of the best predictors of the outcome of species introductions Hulme (2012)
Africa, and Swaziland was based on the number of QDGCs occupied as recorded in both the SAPIA and the forestry trial databases. Species potential distribution was esti-mated based on climatic suitability and range size as the percentage of southern Africa (South Africa, Lesotho and Swaziland) predicted suitable by SDMs.
Results
Evaluation of SDMs using forestry trials and invaded range data
he SDMs successfully predicted the outcome (success or failure) for 81 of the 129 for-estry trials (63%) (overall TSS = 0.15, Table 3), with a high percentage of true presenc-es predicted as prpresenc-esent (sensitivity = 0.80) but a rather low percentage of true absencpresenc-es predicted as absent (speciicity = 0.35). However, there was a higher proportion of false absences than false presences (Table 3). SDM evaluation varied between species, with ive species having low sensitivity values and ten with low speciicity values (Table 3).
Observed invasive ranges of Australian acacias in southern Africa are generally correctly predicted as suitable based on the SDMs (sensitivity = 0.87). However, the predictions mismatched 461 (13%) invasive range records (i.e. 13% of the records in-dicate that species invaded areas that are climatically unsuitable; Table 4). Most of the invasive species have the potential to substantially increase their ranges because more than half of southern Africa is predicted to be suitable.
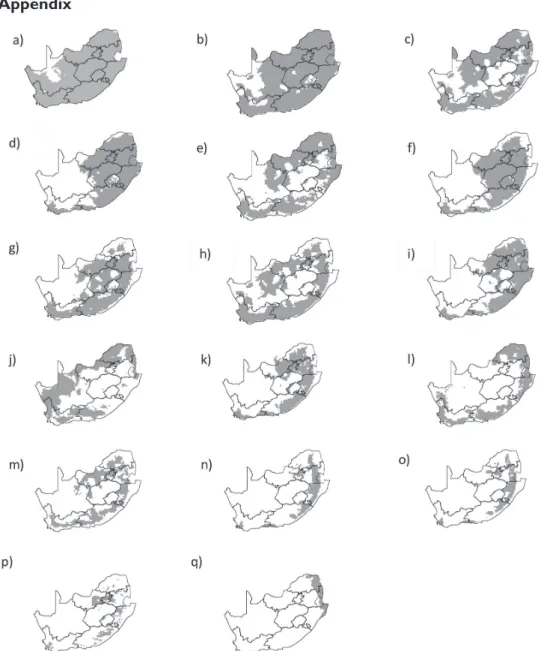
Acacia dealbata and A. mearnsii are provided as visual examples (Fig. 1).
Explaining success or failure of forestry trials
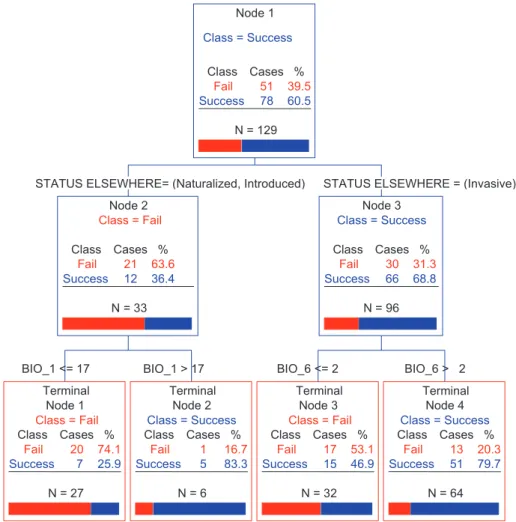
Using climatic suitability alone, 81 trials out of 129 (model accuracy = 0.63) were correctly predicted (Table 3), while 87 (model accuracy = 0.67) records were cor-rectly predicted by the criterion “invasive elsewhere” (Fig. 2: Node 2 and 3). Based on the classiication tree (Fig. 2), three variables (invasive elsewhere, annual mean temperature, and mean temperature of the coldest month) together accurately pre-dicted 72% of the forestry trial records (i.e. 93 trials). he classiication tree analysis correctly predicted forestry trial outcome signiicantly (sensitivity = 086, speciicity = 0.36 and TSS = 0.22).
Determining species that have a high risk of becoming widespread invaders
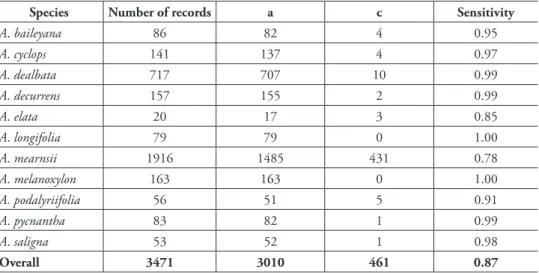
table 4.Measures used to evaluate models using Southern African Plant Invaders Atlas; a-number of cells for which presence was correctly predicted by the model; c-number of cells for which the species was found but the model predicted absence.
Species Number of records a c Sensitivity
A. baileyana 86 82 4 0.95
A. cyclops 141 137 4 0.97
A. dealbata 717 707 10 0.99
A. decurrens 157 155 2 0.99
A. elata 20 17 3 0.85
A. longifolia 79 79 0 1.00
A. mearnsii 1916 1485 431 0.78
A. melanoxylon 163 163 0 1.00
A. podalyriifolia 56 51 5 0.91
A. pycnantha 83 82 1 0.99
A. saligna 53 52 1 0.98
Overall 3471 3010 461 0.87
table 3.Measures used to evaluate models using government forestry trials dataset in southern Africa; a-number of cells for which presence was correctly predicted by the model; b- number of cells for which the species was not found but the model predicted presence; c, number of cells for which the species was found and the model predicted absence; d, number of cells for which absence was correctly predicted by the model. Sensitivity (proportion of actual presences predicted as such); speciicity (proportion of actual absences predicted as such); TSS [true skill statistic (sensitivity + speciicity-1].
Species Number of trials a b c d Sensitivity Speciicity TSS
A. acuminata 13 1 5 1 6 0.50 0.54 0.04
A. aneura 4 1 1 2 0 0.33 0.00 -0.67
A. baileyana 5 4 1 0 0 1.00 0.00 0.00
A. cultriformis 5 0 2 1 2 0.00 0.50 -0.50
A. dealbata 13 11 0 1 1 0.91 1.00 0.91
A. decurrens 7 2 4 0 1 1.00 0.20 0.20
A. elata 9 2 4 2 1 0.50 0.20 -0.30
A. falciformis 4 2 2 0 0 1.00 0.00 0.00
A. longifolia 5 4 1 0 0 1.00 0.00 0.00
A. mearnsii 13 7 2 3 1 0.70 0.33 0.03
A. melanoxylon 28 20 8 0 0 1.00 0.00 0.00
A. pendula 6 1 1 2 2 0.33 0.67 0.00
A. pycnantha 9 7 1 1 0 0.88 0.00 -0.20
A. saligna 8 2 0 3 3 0.40 1.00 0.40
Figure 2.Classiication tree analysis of the probability that a species will succeed (blue part of the bar) or fail (red) in southern African forestry trials based on various variables (see Table 2: trial data and variables used). Each node shows the number of successes and failures in each class, the total number of cases (N) and a graphical presentation of the percentage of success and failure cases (horizontal bar). For each node the splitting criterion is written in caps on top of the nodes. Status is similar to invasiveness elsewhere and the two environmental variables: Bio_1 is annual mean temperature and Bio_6 is minimum temperature of the coldest month.
Discussion
In this study, we found that forestry trial data provided useful data for SDM evalua-tion as it contains informaevalua-tion on species that were repeatedly introduced in diferent localities within southern Africa with a clear indication of trial outcome. Trials were successful in areas that are predicted as climatically suitable by SDMs (sensitivity = 0.80; Table 3). McGregor et al. (2012b) found that successful naturalization of pine species in plantations was linked to a good climate match between their native range and introduced ranges. he results emphasize the value of incorporating forestry data in to SDMs when predicting species distributions.
SDMs could not accurately predict the failures of species in trials (speciicity = 0.35; Table 3) and this suggests that climatic suitability only provides a broad picture of where an introduced species might survive, but there are other factors that deter-mine whether an introduced species will be successful like biotic interactions and evo-lutionary capacity to adapt (Blackburn et al. 2011; Nuñez and Medley 2011; Soberón and Peterson 2005). Factors such as seed predation, competition with local plants and herbivory can have strong efects on Acacia success in trials.
2007). his suggests that species may alter climatic niches during the invasion process. However, there is an on-going debate in literature about the prevalence of niche shift (Peterson 2011). According to the SDMs predictions, even widespread species (e.g. A. dealbata) have not yet fully occupied all climatically suitable areas in southern Africa. So management actions should be focused on containment, with resources dedicated to detecting and removing outlying populations of such species.
In line with other studies, we found that the success of species after introduction in the new ranges was greater for species recorded as invasive elsewhere (McGregor et al. 2012a; Reichard and Hamilton 1997; Scott and Panetta 1993; Williamson and Fitter 1996). As such Australian acacias that succeeded in trials appear to be a non-random sub-set in the global pool: they tended to be species that are invasive elsewhere and are within climatic areas similar to their native ranges hence they are likely to invade large areas. Since Australian acacias that are known to be invasive elsewhere are already planted in southern Africa for forestry purposes (Richardson et al. 2011), their spread should be controlled.
Australian Acacia species that are not yet widespread are likely to spread to currently unoccupied climatically suitable ranges as SDMs predictions indicate that a large portion of Lesotho, South Africa and Swaziland is suitable for invasion by 13 of the 17 currently introduced or naturalized (Fig. 3). We believe this is a major invasion debt and not sim-ply an over-prediction in the SDMs, because there is a strong correlation between extent of usage and invasive distributions for Australian acacias in South Africa (Wilson et al. 2011). he widespread invaders are those species that have been planted for forestry, dune stabilization or ornamental purposes. However, many other introduced species were only ever planted in forestry trials or arboreta. As such their currently restricted distribution is the result of low propagule pressure, but given opportunities and time, these species can and do spread (Kaplan et al. 2012; Zenni et al. 2009; Kaplan et al. in press). Species that have a large potential range and are invasive elsewhere (Fig. 3 and Supplementary material Fig. S1) should be prioritised for management, and where pos-sible eradicated, e.g. Acacia implexa, A. paradoxa and A. stricta in South Africa (Kaplan et al. 2012; Zenni et al. 2009; Kaplan et al. in press). Commercial forestry is one of the major pathways to tree invasions and availability of introduction data can be useful for screening potential invaders when coupled to SDMs. SDMs provide useful information that can inluence management decisions on early detection, prioritization, and more targeted research. SDMs also provide information for rapid assessment of potential dis-tributions of alien species based on climate, even before introduction.
Acknowledgements
References
Allouche O, Tsoar A, Kadmon R (2006) Assessing the accuracy of species distribution models: Prevalence, kappa and the true skill statistic (TSS). Journal of Applied Ecology 43: 1223–1232. doi: 10.1111/j.1365-2664.2006.01214.x
Beaumont LJ, Gallagher RV, huiller W, Downey PO, Leishman MR, Hughes L (2009) Dif-ferent climatic envelopes among invasive populations may lead to underestimations of current and future biological invasions. Diversity and Distributions 15: 409–420. doi: 10.1111/j.1472-4642.2008.00547.x
Blackburn TM, Pyšek P, Bacher S, Carlton JT, Duncan RP, Jarošík V, Wilson JRU, Richard-son DM (2011) A proposed uniied framework for biological invasions. Trends in Ecology and Evolution 26: 333–339. doi: 10.1016/j.tree.2011.03.023
Breiman L, Friedman J, Olshen R, Stone C (1984) Classiication and Regression Trees. Wadsworth, 358 pp.
Broennimann O, Treier UA, Müller-Schärer H, huiller W, Peterson AT, Guisan A (2007) Evidence of climatic niche shift during biological invasion. Ecology Letters 10: 701–709. doi: 10.1111/j.1461-0248.2007.01060.x
Castro-Díez P, Godoy O, Saldaña A, Richardson DM (2011) Predicting invasiveness of Aus-tralian acacias on the basis of their native climatic ainities, life history traits and human use. Diversity and Distributions 17: 934–945. doi: 10.1111/j.1472-4642.2011.00778.x Daehler CC, Denslow JS, Ansari S, Kuo HC (2004) A risk-assessment system for screening
out invasive pest plants from Hawaii and other Paciic Islands. Conservation Biology 18: 360–368. doi: 10.1111/j.1523-1739.2004.00066.x
Elith J, Leathwick JR (2009) Species distribution models: Ecological explanation and predic-tion across space and time. Annual Review of Ecology, Evolupredic-tion and Systematics 40: 677–697. doi: 10.1146/annurev.ecolsys.110308.120159
Essl F, Mang T, Dullinger S, Moser D, Hulme PE (2011) Macroecological drivers of alien conifer naturalizations worldwide. Ecography 34: 1076–1084. doi: 10.1111/j.1600-0587.2011.06943.x
Essl F, Dullinger S, Rabitsch W, Hulme PE, Huelber K, Jarošík V, Kleinbauer I, Krausmann F, Kühn I, Nentwig W, Vilà M, Genovesi P, Gherardi F, Desprez-Loustau ML, Roques A, Pyšek P (2011) Socio-economic legacy yields an invasion debt. Proceedings of the Na-tional Academy of Sciences of the United States of America 108: 203–207. doi: 10.1073/ pnas.1011728108
Essl F, Moser D, Dullinger S, Mang T, Hulme PE (2010) Selection for commercial forestry de-termines global patterns of alien conifer invasions. Diversity and Distributions 16: 911–921. doi: 10.1111/j.1472-4642.2010.00705.x
Ficetola GF, huiller W, Miaud C (2007) Prediction and validation of the potential global distribution of a problematic alien invasive species - he American bullfrog. Diversity and Distributions 13: 476–485. doi: 10.1111/j.1472-4642.2007.00377.x
Gallagher RV, Leishman MR, Miller JT, Hui C, Richardson DM, Suda J, Trávníček P (2011) Invasiveness in introduced Australian acacias: he role of species traits and genome size. Diversity and Distributions 17: 884–897. doi: 10.1111/j.1472-4642.2011.00805.x Gallien L, Douzet R, Pratte S, Zimmermann NE, huiller W (2012) Invasive species
distribu-tion models - how violating the equilibrium assumpdistribu-tion can create new insights. Global Ecology and Biogeography 21: 1126–1136. doi: 10.1111/j.1466-8238.2012.00768.x Gaston KJ (2003) he structure and dynamics of geographic ranges. Oxford University Press,
Oxford University UK, 260 pp.
Guisan A, Zimmermann NE (2000) Predictive habitat distribution models in ecology. Eco-logical Modelling 135: 147–186. doi: 10.1016/S0304-3800(00)00354-9
Henderson L (1998) Southern African Plant Invaders Atlas (SAPIA). Applied Plant Science 12: 31–32.
Henderson L (2007) Invasive, naturalized and casual alien plants in southern Africa: A sum-mary based on the Southern African Plant Invaders Atlas (SAPIA). Bothalia 37: 215–248. Hijmans RJ (2006) WorldClim. http://wordlclim.org/bioclim.htm [accessed 29 June 2010] Hijmans RJ, Cameron SE, Parra JL, Jones PG, Jarvis A (2005) Very high resolution interpolated
climate surfaces for global land areas. International Journal of Climatology 25: 1965–1978. doi: 10.1002/joc.1276
Hulme PE (2012) Weed risk assessment: A way forward or a waste of time? Journal of Applied Ecology 49: 10–19. doi: 10.1111/j.1365-2664.2011.02069.x
Kaplan H, Van Zyl HWF, Le Roux JJ, Richardson DM, Wilson JRU (2012) Distribution and management of Acacia implexa (Benth.) in South Africa: A suitable target for eradication? South African Journal of Botany 83: 23–35. doi: 10.1016/j.sajb.2012.07.016
Kaplan H, van Niekerk A, Le Roux JJ, Richardson DM, Wilson JRU (in press) Incorporating risk mapping at multiple spatial scales into eradication management plans. Biological Invasions. Křivánek M, Pyšek P, Jarošík V (2006) Planting history and propagule pressure as predictors
of invasion by woody species in a temperate region. Conservation Biology 20: 1487–1498. doi: 10.1111/j.1523-1739.2006.00477.x
Lockwood JL, Cassey P, Blackburn TM (2009) he more you introduce the more you get: he role of colonization pressure and propagule pressure in invasion ecology. Diversity and Distributions 15: 904–910. doi: 10.1111/j.1472-4642.2009.00594.x
McGregor KF, Watt MS, Hulme PE, Duncan RP (2012a) How robust is the Australian Weed Risk Assessment protocol? A test using pine invasions in the Northern and Southern hemi-spheres. Biological Invasions 14: 987–998. doi: 10.1007/s10530-011-0133-5
McGregor KF, Watt MS, Hulme PE, Duncan RP (2012b) What determines pine naturali-zation: Species traits, climate suitability or forestry use? Diversity and Distributions 18: 1013–1023. doi: 10.1111/j.1472-4642.2012.00942.x
Mucina L, Rutherford MC (2006) he vegetation of South Africa, Lesotho and Swaziland. South African National Biodiversity Institute, 808 pp.
Nix HA (1986) A biogeographic analysis of Australian elapid snakes. In: Longmore R (Ed) Atlas of Elapid Snakes of Australia. Australian Government Publications Service, Cranberra, 4–15. Nuñez MA, Medley KA (2011) Pine invasions: Climate predicts invasion success; something
else predicts failure. Diversity and Distributions 17: 703–713. doi: 10.1111/j.1472-4642.2011.00772.x
Pauchard A, Cavieres LA, Bustamante RO (2004) Comparing alien plant invasions among re-gions with similar climates: Where to from here? Diversity and Distributions 10: 371–375. doi: 10.1111/j.1366-9516.2004.00116.x
Peterson AT (2003) Predicting the geography of species’ invasions via ecological niche mod-eling. Quarterly Review of Biology 78: 419–433. doi: 10.1086/378926
Peterson AT (2011) Ecological niche conservatism: A time-structured review of evidence. Jour-nal of Biogeography 38: 817–827. doi: 10.1111/j.1365-2699.2010.02456.x
Peterson AT, Holt RD (2003) Niche diferentiation in Mexican birds: Using point occur-rences to detect ecological innovation. Ecology Letters 6: 774–782. doi: 10.1046/j.1461-0248.2003.00502.x
Peterson AT, Soberón J, Sánchez-Cordero V (1999) Conservatism of ecological niches in evo-lutionary time. Science 285: 1265–1267. doi: 10.1126/science.285.5431.1265
Poynton RJ (1979a) Tree Planting in Southern Africa. he Eucalypts. Department of Forestry Pretoria. South Africa, 882 pp.
Poynton RJ (1979b) Tree Planting in Southern Africa. he Pines. Department of Forestry Pretoria, South Africa, 576 pp.
Poynton RJ (2009) Tree Planting in Southern Africa: Other Genera. Deapartment of Forestry Pretoria, South Africa, 773 pp.
Pyšek P, Jarošík V, Pergl J (2011) Alien plants introduced by diferent pathways difer in inva-sion success: Unintentional introductions as a threat to natural areas. PLoS ONE 6: 1–11. art. no. e24890.
Pyšek P, Křivánek M, Jarošik V (2009) Planting intensity, residence time, and species traits deter-mine invasion success of alien woody species. Ecology 90: 2734–2744. doi: 10.1890/08-0857.1 R Development Core Team (2008) R: a language and environment for statistical computing.
Version 2.8.1. R Foundation for Statistical Computing, Vienna.
Reichard SH, Hamilton CW (1997) Predicting invasions of woody plants introduced into North America. Prediccion de invasiones de plantas lenosas introducidas a Norteamerica 11: 193–203. doi: 10.1046/j.1523-1739.1997.95473.x
Richardson DM, Carruthers J, Hui C, Impson FAC, Miller JT, Robertson MP, Rouget M, Le Roux JJ, Wilson JRU (2011) Human-mediated introductions of Australian acacias - a global experiment in biogeography. Diversity and Distributions 17: 771–787. doi: 10.1111/j.1472-4642.2011.00824.x
Richardson DM, Pyšek P, Rejmánek M, Barbour MG, Dane Panetta F, West CJ (2000) Natu-ralization and invasion of alien plants: Concepts and deinitions. Diversity and Distribu-tions 6: 93–107. doi: 10.1046/j.1472-4642.2000.00083.x
Rouget M, Richardson DM, Nel JL, Le Maitre DC, Egoh B, Mgidi T (2004) Mapping the potential ranges of major plant invaders in South Africa, Lesotho and Swaziland using climatic suitability. Diversity and Distributions 10: 475–484. doi: 10.1111/j.1366-9516.2004.00118.x
Scott JK, Panetta FD (1993) Predicting the Australian weed status of southern African plants. Journal of Biogeography 20: 87–93. doi: 10.2307/2845742
Soberón J, Peterson A.T (2005) Interpretation of Models of Fundamental Ecological Niches and Species Distributional Areas. Biodiversity Informatics 2: 1–10.
Steiner FM, Schlick-Steiner BC, Vanderwal J, Reuther KD, Christian E, Staufer C, Suarez AV, Williams SE, Crozier RH (2008) Combined modelling of distribution and niche in invasion biology: A case study of two invasive Tetramorium ant species. Diversity and Distributions 14: 538–545. doi: 10.1111/j.1472-4642.2008.00472.x
hompson GD, Robertson MP, Webber BL, Richardson DM, Le Roux JJ, Wilson JRU (2011) Predicting the subspeciic identity of invasive species using distribution models: Acacia saligna as an example. Diversity and Distributions 17: 1001–1014. doi: 10.1111/j.1472-4642.2011.00820.x
huiller W, Richardson DM, Rouget M, Procheş Ş, Wilson JRU (2006) Interactions be-tween environment, species traits, and human uses describe patterns of plant inva-sions. Ecology 87: 1755–1769. http://0-dx.doi.org.innopac.up.ac.za/10.1890/0012-9658(2006)87[1755:IBESTA]2.0.CO;2
Van Wilgen BW, Dyer C, Hofmann JH, Ivey P, Le Maitre DC, Moore JL, Richardson DM, Rouget M, Wannenburgh A, Wilson JRU (2011) National-scale strategic approaches for managing introduced plants: Insights from Australian acacias in South Africa. Diversity and Distributions 17: 1060–1075. doi: 10.1111/j.1472-4642.2011.00785.x
Williamson M, Fitter A (1996) he varying success of invaders. Ecology 77: 1661–1666. doi: 10.2307/2265769
Wilson JRU, Gairifo C, Gibson MR, Arianoutsou M, Bakar BB, Baret S, Celesti-Grapow L, Ditomaso JM, Dufour-Dror JM, Kuefer C, Kull CA, Hofmann JH, Impson FAC, Loope LL, Marchante E, Marchante H, Moore JL, Murphy DJ, Tassin J, Witt A, Zenni RD, Richardson DM (2011) Risk assessment, eradication, and biological control: Global ef-forts to limit Australian acacia invasions. Diversity and Distributions 17: 1030–1046. doi: 10.1111/j.1472-4642.2011.00815.x
Wilson JRU, Richardson DM, Rouget M, Procheş Ş, Amis MA, Henderson L, huiller W (2007) Residence time and potential range: Crucial considerations in modelling plant in-vasions. Diversity and Distributions 13: 11–22. doi: 10.1111/j.1366-9516.2006.00302.x Zenni RD, Wilson JRU, Le Roux JJ, Richardson DM (2009) Evaluating the invasiveness
of Acacia paradoxa in South Africa. South African Journal of Botany 75: 485–496. doi: 10.1016/j.sajb.2009.04.001
Appendix
![Figure 1. Current distribution [from both forestry trials (noted as trial failure or success) and SAPIA] and potential distribution for: a Acacia dealbata and b A](https://thumb-eu.123doks.com/thumbv2/123dok_br/18281882.345669/10.701.79.621.86.835/figure-current-distribution-forestry-failure-potential-distribution-dealbata.webp)