Biomass and carbon stock from
Pinus
caribaea
var.
hondurensis
under homogenous stands in southwest Bahia, Brazil
Estoques de biomassa e carbono de Pinus caribaea var.
hondurensis em plantio homogêneo no Sudoeste da Bahia
Máida Cynthia Duca de LimaI Patrícia Anjos Bittencourt Barreto-GarciaI* Carlos Roberto SanquettaII Adalberto Brito de NovaesI Lara Clímaco de MeloII ISSN 1678-4596
ABSTRACT
There is a large number of studies evaluating methods to quantify biomass for the genus Pinus in different regions of Brazil. However, knowledge about this subject in the Northeast region of Brazil is still incipient. The objective of the present study was to assess the biomass and carbon stocks and select mathematical models to estimate these variables in Pinus caribaea var. hondurensis, which is established in homogenous stands in the Southwest region of the state of Bahia (Brazil). The
biomass was quantified using the destructive method. Samples
of needles, bole, bark, and branches were analyzed to determine their carbon contents. Ten models were tested, and the best of them were chosen based on the following statistical indicators:
adjusted determination coefficient, estimate standard error,
maximum likelihood logarithm, and graphical analysis of waste. Values for total biomass and carbon stocks were 69 and 42Mg ha-1,
respectively. Curtis and Schumacher-Hall Log models showed to be the most indicated to estimate the total dry biomass and carbon of the species under the conditions studied.
Key words: exotic forest species, mathematical models, biomass.
RESUMO
Embora haja um grande número de estudos avaliando
métodos para quantificar biomassa para o gênero Pinus em
diferentes regiões do Brasil, o conhecimento sobre o tema na região Nordeste do país ainda é incipiente. O objetivo deste trabalho foi avaliar os estoques de biomassa e carbono e selecionar modelos matemáticos para estimar essas variáveis em Pinus caribaea var. hondurensis, que está estabelecido em plantio homogêneo
na região Sudoeste da Bahia. A quantificação da biomassa foi
realizada empregando o método destrutivo. Amostras de acículas, fuste, casca e galhos foram analisadas para determinar os teores de carbono. Dez modelos foram testados e a escolha dos melhores
modelos foi baseada nos indicadores estatísticos: coeficiente de
determinação ajustado, erro padrão da estimativa, logaritmo da máxima verossimilhança e análise gráfica dos resíduos. Os valores
de estoques de biomassa total e carbono foram de 69 e 42Mg ha-1,
respectivamente. Os modelos de Curtis e Schumacher-Hall Log mostraram ser os mais indicados para as estimativas de biomassa
seca total e carbono da espécie nas condições estudadas.
Palavras-chave: espécie florestal exótica, modelos matemáticos,
fitomassa.
INTRODUCTION
In Brazil, the progressive increase in the demand for forest resources has driven the expansion in the area of planted forests, which currently corresponds to about 7.7 million hectares (IBÁ, 2015). The genus Pinusis among the most commonly used forest essences. In 2012, Pinus species occupied 1.6 million hectares, i.e, 23.4% of the total area of planted forests in the country (ABRAF, 2013).
Although more extensive stands are concentrated in the South region of Brazil, the genus is distributed in several other regions, such as the Southeast and Northeast. This distribution is related to the introduction of different species, coming from a wide variation in ecological conditions in their original dispersion. This fact provided a high genetic variability and, as a consequence, a greater adaptation to various climate and soil conditions (CHAVES & CORRÊA, 2005, SHIMIZU, 2006). In addition,
IUniversidade Estadual do Sudoeste da Bahia (UESB), 45031-900, Vitória da Conquista, BA, Brasil. E-mail: patriciabarreto@uesb.edu.br. *Corresponding author.
IIUniversidade Federal do Paraná (UFPR), Curitiba, PR, Brasil.
the wide use of the genus can be attributed to the technological characteristics of its wood, which allows different applications, including construction, sawmill industry, laminated products, plates, energy, paper, and cellulose. Pinus caribaea is among the pine species most cultivated in the country. It has three varieties, including the hondurensis, which is one of the most planted species in the world (MELO et al., 2013).
Biomass estimation is considered an important tool in the evaluation and use of native or planted forests. It allows obtaining information about the stocks of carbon and mineral elements, energy conversion, and nutrient cycling (SILVEIRA et al., 2008). In addition, it allows quantifying and exporting wood after exploiting the forest.
Information about carbon stocks in the forest biomass may also indicate the potential of these covers to sequester atmospheric carbon (RAVINDRANATH & OSTWALD, 2008). Consequently, it properly assesses the impacts that material (biomass) removal can supposedly cause to the environment. Therefore, a concise and reliable biomass assessment is an essential part of the studies designed to measure carbon capture by forests (SANQUETTA et al., 2004).
Quantification of forest biomass can
be performed using direct or indirect methods. According to WATZLAWICK et al. (2006), direct methods represent the actual measurement, which is performed directly in the biomass, e.g., weighing a whole bole by means of a scale. Conversely, indirect methods consist of estimating the biomass from its correlation with an easily measurable variable, which does not require destruction of the plant material.
Adjusting equations with regression techniques, in which the weight of the tree (or each of its components) is related to dendrometric variables (diameter at breast height, height, and volume), is the most commonly used procedure to indirectly quantify biomass (KOEHLER et al., 2002). Carbon compounds are a large part of the forest biomass (WATZLAWICK et al., 2006), and the mathematical modeling has also been widely used to estimate carbon stocks. According to SANQUETTA (2002), many models are effective. However, they are not always suitable to all species and conditions. Evaluate them with appropriate statistical methods is necessary to identify the best one for each case.
Climate, soil type, relief, hydrography, as well as age and genetic variation within and
between species influence the biomass production
and accumulation and; therefore, carbon production in native or planted forest stands (LUGO et al.,
1988; CALDEIRA et al., 2004). Various biomass and carbon assessment studies were performed in species of the genus Pinus, and above-ground tree biomass (57-299Mg ha-1) and carbon stock (26-136Mg ha-1)
estimates were shown in different regions of Brazil (WATZLAWICK et al., 2005; BALBINOT et al., 2008; CORRÊA & BELLOTE, 2011; GIONGO et al., 2011; WATZLAWICK et al., 2013). Although there is a growing expansion in the areas planted with this genus, information about its production potential is still incipient, and no study related to the subject was reported until now in the Northeast region of Brazil, especially in the State of Bahia.
Therefore, the objectives of this study were (1) evaluate the biomass and carbon stocks and their distribution in the different tree components; (2) select mathematical models to estimate the biomass and carbon from Pinus caribaea var. hondurensis in homogeneous stands.
MATERIALS AND METHODS
This study was conducted in a ten-year-old Pinus caribaea var. hondurensis stand located in the experimental area of the State University of Southwest Bahia (Vitória da Conquista, BA, Brazil; geographic coordinates: South latitude: 14º53’ and West longitude: 40º48’). The stand was established in low capoeira (secondary forest) area, after cleaning with crawler tractor and tillage with disk harrow. Seminal seedlings were planted in 2002, with localized fertilization in the hole (single superphosphate: 200g; spacing: 3x3m2). Maintenance
was performed in the study area only two, six, and 12 months after planting, with weed-competition control by means of weeding in and between the lines.
The region has a plan to gently-rolling relief (height: ca. 880m). According to the Koppen
classification system, the climate is type Cwb
(altitude tropical climate) with mean temperature of about 21°C and 700-1100mm annual precipitation. The soil is Dystrophic Yellow Latosol class.
Trees (n=20) were selected and distributed
in five diameter classes (amplitude: 4cm) for biomass
which were weighed on a mechanical scale (capacity: 150kg; precision: 50g). After weighing, samples were withdrawn from each compartment and taken to dryness in a greenhouse (65°C) until the dry-matter weight was stabilized. After the samples were dried, they were weighed and ground until a powder consistency, employing a six-knife mill and metal sieves. Carbon content of the milled samples was determined through a carbon (Leco C-144) analyzer.
The dry biomass was calculated multiplying the green mass by the moisture correction factor, which was obtained by the dry-to-wet ratio of the sample weights. The carbon stocks per tree (kg) and per area (Mg ha-1) were estimated from the values
for dry biomass and their respective carbon contents. Correlations between the dependent (carbon stock and total-tree and tree-component biomass) and independent (DBH and full height) variables were
established and assessed before fitting the mathematical
models. Correlations indicated the importance of
adopting fittings only for the carbon stocks and
total-tree biomass, since a low correlation was observed between the variables for separate compartments.
Ten mathematical models from the literature were tested to select the most appropriate model for the total biomass and carbon stock estimates of the species studied:
1 - Ln Y = β 0 + β 1Ln DBH + ε (Stoffels)
2 - Ln Y = β 0 + β 1/ DBH + ε (Curtis)
3 - Y = β 0 + β 1DBH + β 2 DBH² + ε (Parábola)
4 - Y = β 0 + β 1DBH + ε (Linha Reta)
5 - Y = β 0 + β1 DBH
2+ ε (Kopezky – Gehrhardt)
6 - Y = β 0 + β 1DBH
2 h+ ε (Spurr)
7 - Y = β 0 + β 1DBH 2 + β
2DBH 2 h + β
3 h+ ε (Stoate)
8 - Ln Y = β0 + β1 Ln DBH + β2 Ln h + ε
(Schumacher-Hall Log)
9 - Y = β0 + β1 DBH
0.5*Ln DBH + ε (*)
10 - Y= β0 + β1 DBH + β2 DBH 2+ β
3DBH h+ β4DBH 2
h + β5 h+ ε (Meyer)
Where, Y = tree biomass; βi = model coefficient; DBH = diameter at 1.30 m (in cm); h = total tree height (in m); Ln = Neperian logarithm; ε = random
error; and * = name not reported in the literature. Statistical criteria to select the best models
were as follows: adjusted coefficient of determination
(R2
adj), standard error of the estimate (Syx), and
logarithm of the maximum likelihood (LML). Such criteria were considered in combination to calculate the weighted value (WV) for the scores of each equation tested. Weights were then assigned to the statistical criteria and the equations were ranked according to their precision. Weight 1 was attributed to the most effective model, 2 to the second one, and
so on, as proposed by THIERSCH (1977). After the
individual classification, the scores for each model
were summed and the two models with the lowest WV were selected for both biomass and carbon.
In the models in which the dependent variable was logarithmically transformed, the Meyer’s correction factor was used to correct the discrepancy between the values. The standard error was also corrected in the original scale, for comparison with the arithmetic models.
The LML was obtained by the ratio between the sum of the squares of the residual errors and the sample size (n). It has been used to indicate
the fitting degree of the models, because it has a higher power of discrimination between fittings as
compared to the statistical indices commonly used (SHAPIRO & BRAIN, 1981). The higher its value,
the best the fit obtained.
The models selected with basis on the WV were analyzed for graphic distribution of residues, to verify occurrence of trends in the estimates. The t test was also applied to paired data (α=0.01) to verify
accuracy of the selected models. This test is traditionally used to examine whether a prediction technique is or equal to another one or can replace it. Analyzes were performed using the Statistical SAEG® (v.9.1) program.
RESULTS AND DISCUSSION
The total dry matter of the stand was about 69Mg ha-1 (Table 1). On average, it corresponds to
62.3kg per tree (range: 12.6-140.0kg). CORRÊA & BELLOTE (2011) evaluated stands (of the same species and with the same age; spacing: 2.7m x 1.85m) established in São Paulo, and reported an approximate value of 264Mg ha-1 for biomass, which corresponds to
132kg per tree. The lowest biomass, as observed in the present study, may be related to different factors, such as species adaptation to the studied area. It presents low levels of soil rainfall and fertility, and absence of silvicultural practices in the established stand, such as maintenance fertilization and thinning.
verified that the biomass was distributed in the following
order: bole (68.5%) > branches (16.3%) > bark (12.2%) > needles (2.9%). According to PEDROSA et al. (2013), the biomass distribution in the various plant organs may vary among species, within the same species, or due to a change in the environmental conditions.
The carbon stock present in the tree biomass totaled about 42Mg ha-1, with a greater
participation of the bole (27.58Mg ha-1), which
correspond to about 65% of the total carbon
fixed in the biomass (Table 1). According to KUZYAROV & DOMANSKI (2000), the bole is the most representative compartment in carbon storage, as it represents the main plant reservoir.
After the bole, the largest contribution to the carbon stock was represented by bark (16.7%), followed by branches (13.5%) and needles (4.7%). This demonstrates the importance of the conservative management of crop residues in maintaining not only the needles and branches, but
also the bark in the field.
Higher values of carbon fixed in aerial
part of the total biomass were reported in the State of Paraná (Brazil) by WATZLAWICK et al. (2013) in Pinus taeda stands aged 14 (61.9Mg ha-1) and 19
years (38.0Mg ha-1), and BALBINOT et al. (2008), in Pinus spp. plantations aged 5-15 years (59.5Mg ha-1).
Values observed for R2
adj were in the range
73.9-89.7%, with values greater than 80% in six of the equations tested, showed a good statistical performance of most models for both biomass and carbon estimates (Table 2). Model 8 (Schumacher-Hall Log) presented the highest values for R2
adj (89.7% and 89.4%, respectively). Table 1 - Dry biomass and organic carbon stocks, and
participation of each compartment of the aerial part in the composition of the total biomass.
---Biomass--- ---Carbon---Compartments
Mg ha-1 % Mg ha-1 %
Needles 4.17 6.03 2.00 4.73
Branches 11.36 16.41 5.70 13.46
Bark 14.57 21.05 7.05 16.66
Bole 39.10 56.21 27.58 65.15
Total 69.19 100.0 42.33 100.0
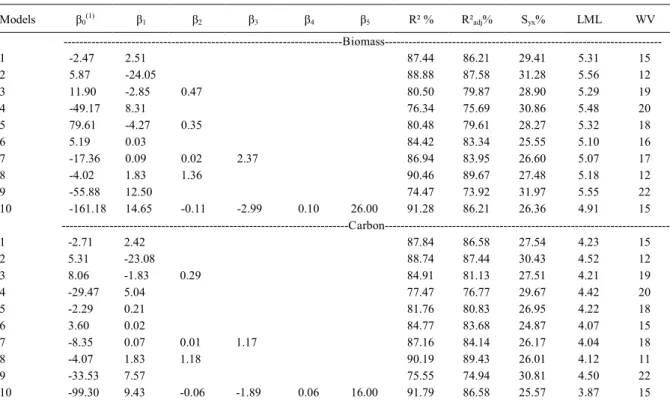
Table 2 - Statistical coefficients and parameters obtained in fitting of models for estimates of the total dry biomass and total carbon fixed of the trees.
Models β0(1) β1 β2 β3 β4 β5 R² % R²adj% Syx% LML WV
---Biomass---1 -2.47 2.51 87.44 86.21 29.41 5.31 15
2 5.87 -24.05 88.88 87.58 31.28 5.56 12
3 11.90 -2.85 0.47 80.50 79.87 28.90 5.29 19
4 -49.17 8.31 76.34 75.69 30.86 5.48 20
5 79.61 -4.27 0.35 80.48 79.61 28.27 5.32 18
6 5.19 0.03 84.42 83.34 25.55 5.10 16
7 -17.36 0.09 0.02 2.37 86.94 83.95 26.60 5.07 17
8 -4.02 1.83 1.36 90.46 89.67 27.48 5.18 12
9 -55.88 12.50 74.47 73.92 31.97 5.55 22
10 -161.18 14.65 -0.11 -2.99 0.10 26.00 91.28 86.21 26.36 4.91 15
---Carbon---1 -2.71 2.42 87.84 86.58 27.54 4.23 15
2 5.31 -23.08 88.74 87.44 30.43 4.52 12
3 8.06 -1.83 0.29 84.91 81.13 27.51 4.21 19
4 -29.47 5.04 77.47 76.77 29.67 4.42 20
5 -2.29 0.21 81.76 80.83 26.95 4.22 18
6 3.60 0.02 84.77 83.68 24.87 4.07 15
7 -8.35 0.07 0.01 1.17 87.16 84.14 26.17 4.04 18
8 -4.07 1.83 1.18 90.19 89.43 26.01 4.12 11
9 -33.53 7.57 75.55 74.94 30.81 4.50 22
10 -99.30 9.43 -0.06 -1.89 0.06 16.00 91.79 86.58 25.57 3.87 15
(1)β
n: regression coefficients; R²: coefficient of determination (%); R²adj: adjusted coefficient of determination (%); Syx: standard error of the
Values for the standard error of the estimate (Syx%) indicated that the models for biomass and carbon estimates had similar performances (24.9-32.0%) (Table 2). It is possible that the values observed for Syx% reflect the heterogeneity of the stand studied, which determined a lower correlation between dependent variable and independent variables. On average, the lowest values were observed in the models 6 (Spurr; 25.2%) and 10 (Meyer; 26.0%). GIONGO et al. (2011) studied the biomass of Pinus elliottii (age: 23 years) and also reported a lower value for Syx% when using model 6.
In relation to the logarithm of maximum likelihood (LML), models 2 and 9 are highlighted, as they showed the highest results for this parameter (Table 2). However, according to the set of statistical criteria, which defined the weighted values (WV) of the equations tested, the 2 (Curtis) and 8 (Schumacher-Hall Log) models were the most satisfactory in estimating biomass and carbon (Table 2).
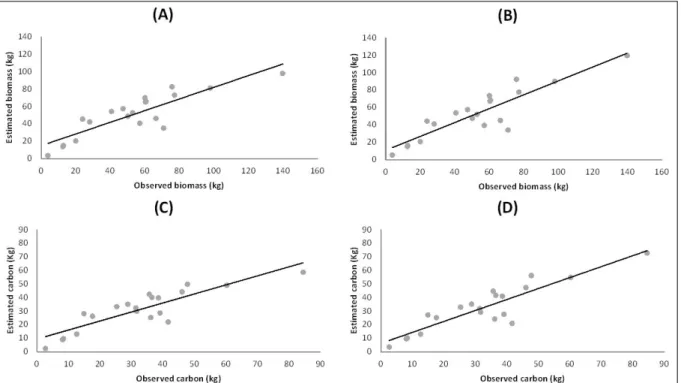
Graphical distribution of the observed values for biomass and carbon versus those estimated by the two models selected with basis on WV are
shown in figure 1. Generally, the graphic dispersion
was very similar between the models and did not show evident trends along the regression line. This suggested that the statistical criteria considered
can favor a proper selection of models suitable for biomass or carbon estimates.
The differences between the estimates obtained by the two models and their respective actual values were analyzed by paired t test and were
considered not significant for both biomass (model
2: P=0.498; model 8: P=0.990) and carbon (model 2: P=0.496; model 8: P=1.000). The standard error of the mean difference was in the range 1.75-2.94. Namely, both equations allowed to obtain estimates statistically similar to the actual values, indicating
the efficiency of both models in estimation of
individual biomass and carbon stock.
CONCLUSION
The values of total biomass and carbon stocks were 69 and 42Mg ha-1, respectively with
a greater participation of bole, followed by bark, branches, and needles.
The Curtis and Schumacher-Hall Log models are indicated for dry biomass and carbon estimates of Pinus caribaea var. hondurensis under the conditions studied. However, it is highlighted that use of the Curtis model can represent a reduction
in the time and costs involved in field activities, as
this model estimates the biomass and carbon only as a function of DBH.
REfERENCES
ABRAF. Anuário estatístico da ABRAF 2013 ano base 2012/ ABRAF. Brasília, 2013. 130p. Available from: <http:// www.bibliotecaflorestal.ufv.br/handle/123456789/3910>. Accessed: Sept. 20, 2015.
BALBINOT, R. et al. Carbon stock in Pinus spp. plantations in different ages et southern region of the state of Paraná. floresta, v.38, n.2, p.317-324, 2008. Available from: <http://ojs.c3sl.ufpr.
br/ojs/index.php/floresta/article/viewArticle/11626>. Accessed:
Jul. 11, 2014. doi: 10.5380/rf.v38i2.11626.
CALDEIRA, M.V.W. et al. Biomass estimate of tree species in a mixed araucaria forest-General Carneiro-PR. Biomassa e Energia, v.1, n.3, p.291-310, 2004. Available from: <http:// www.renabio.org.br/09-B&E-v1-n3-2004-p291-310.pdf>. Accessed: Apr. 08, 2015.
CHAVES, R.Q.; CORRÊA, G.F. Macronutrients in the soil-Pinus caribaea Morelet system with yellowing of the needles followed by senescence and death. Revista Árvore, v.29, n.5, p.691-700, 2005. Available from: <http://www.scielo.br/scielo.php?script=sci_artte xt&pid=S0100-67622003000600003>. Accessed: Jul. 10, 2014. doi: 10.1590/S0100-67622003000600003.
CORRÊA, R.S.; BELLOTE, A.F.J. Soil attributes and biomass yield from Pinus caribaea var. hondurensis. Cerne, v.17, n.2, p.181-187, 2011. Available from: <http://www.scielo. br/scielo.php?pid=S0104-77602011000200004&script=sci_ arttext>. Accessed: Apr. 07, 2015. doi: 10.1590/S0104-77602011000200004.
GIONGO, M. et al. Inventário de biomassa em um plantio de
Pinus elliottii engelm, aos 23 anos de idade. Jornal Biotecnologia Biodiversidade, v.2, n.3, p.81-86, 2011. Available from: <http:// revista.uft.edu.br/index.php/JBB/article/viewFile/253/181>. Accessed: Jun. 06, 2014. doi: 2179-4804.
IBÁ (INDÚSTRIA BRASILEIRA DE PRODUTORES DE ÁRVORES). Relatório IBÁ 2015 ano base 2014. Brasília: 2015. 64p. Available from: <http://www.iba.org/images/shared/ iba_2015.pdf>. Accessed: Sept. 21, 2015.
KOEHLER, H.S. et al. Fontes e níveis de erros nas estimativas do potencial de fixação de carbono. In: SANQUETA, C.R. et al. (Eds.). As florestas e o carbono. Curitiba: [S.l.: s.n.], 2002. p.251-264.
KUZYAROV, Y.; DOMANSKI, G. Carbon input by plants into the soil. Review. Journal of Plant Nutrition and Soil Science, v.163, p.421-431, 2000. Available from: <http://www.researchgate.net/profile/Yakov_Kuzyakov/ publication/236660704_Carbon_input_by_plants_into_the_soil._ Review/links/0c960518c1f37cac53000000.pdf>. Accessed: Jul. 10, 2014. doi: 10.1002/1522-2624(200008)163:43.0.CO;2-R.
LUGO, A.E. et al. An analytical review of production rates and stem wood biomass of tropical forest plantations. forest Ecology and Management, v.23, n.1, p.79-200, 1988.
MELO, L.C. et al. Volumetric estimates in a stand of Pinus caribaea var. hondurensis in Bahia State, Brazil. Pesquisa florestal Brasileira, v.33, n.76, p.379-386, 2013. Available from: <http://pfb.cnpf.embrapa.br/pfb/index.php/pfb/article/view/459> Accessed: Jul. 15, 2014. doi: 10.4336/2013.pfb.33.76.459.
PEDROSA, T.D. et al. Biomass estimation of Brazilian
Eucalyptus grandis plantations. Scientia Plena, v.9, n.5, 2013. Available from: <http://www.scientiaplena.org.br/sp/article/ view/1248/786>. Accessed: May 09, 2014. doi: 1248/786.
RAVINDRANATH, N.H.; OSTWALD M. Carbon inventory methods handbook for greenhouse gas inventory, carbon mitigation and round wood production projects. Advances in global change research. Dordrecht: Springer, 2008. V.29, p.107.
SANQUETTA, C.R. Métodos de determinação de biomassa
florestal. In: SANQUETTA, C.R. et al. (Eds.). As florestas e o
carbono. Curitiba: FUPEF/ Imprensa da UFPR, 2002. p.119-140.
SANQUETTA, C.R. et al. Proposta metodológica para
quantificação e monitoramento do carbono estocado em florestas plantadas. In: SANQUETTA, C.R.; ZILLIOTTO,
M.A.B. Carbono: ciência e mercado global. Curitiba: UFPR / ECOPLAN, 2004. p.120-150.
SHAPIRO, S.S.; BRAIN, C.W. A review of distributional testing procedure and development of a censored sample distributional test. In: TAILLIE, C.; PATIL, G. P.; BALDESSARI, B. A.
Statistical distribution in scientific work. Dordrecht: D. Reidel
Publishing, 1981. v.5. p.1-24.
SHIMIZU, J.Y. Pinus na silvicultura brasileira. Revista da Madeira, v.16, n.99, p.4-14, 2006. Available from: <http://www.remade.com.br/br/revistadamadeira_capa. php?edicao=99&button2=OK>. Accessed: Sept. 21, 2015.
SILVEIRA, P. et al. The art state of the forest biomass estimation and carbon in forest formation. floresta, v.38, n.1, p.185-206, 2008. Available from: <http://ojs.c3sl.ufpr.br/ojs/index.php/
floresta/article/view/11038/7509>. Accessed: Mar. 20, 2014.
doi: 10.5380/rf.v38i1.11038.
THIERSCH, A. A eficiência das distribuições diamétricas para prognose de Eucalyptus camaldulensis. 1997. 155f.
Dissertação (Mestrado em Engenharia Florestal) – Universidade
Federal de Lavras, Lavras, MG.
WATZLAWICK, L.F. et al. Estimativa de biomassa e carbono em plantios de Pinus taeda L. utilizando imagens do satélite Ikonos II. Ciência e Natura, v.,28, n.1, p.45-60, 2006. Available from: <http://cascavel.ufsm.br/revistas/ ojs-2.2.2/index.php/cienciaenatura/article/view/9708/5816>. Acessed: Jun. 09, 2014.
WATZLAWICK, L.F. et al. Organic Carbon and Biomass Storage in Pinus taeda L. Biomassa & Energia, v.2, n.1, p.7-17, 2005. Available from: <http://www.renabio.org.br/02-B&E-v2-n1-2005-p7-17.pdf>. Accessed: Apr. 08, 2015.
WATZLAWICK, L.F. et al. Aboveground stock of biomass and organic carbon in stands of Pinus taeda L. Cerne, v.19, n.3, p.509-515, 2013. Available from: <http://www.scielo. br/scielo.php?pid=S0104-77602013000300019&script=sci_ arttext>. Accessed: Apr. 07, 2015. doi: 10.1590/S0104-77602013000300019.
WOJCIECHOWSKI, J.C. et al. Biomassa em uma floresta de