Abstract—This paper presents a performance benchmark scheme for assessing the output response of a Proportional Integral Derivative (PID) controlled feedback system for a linear single-input-single-output (SISO) process system. A comparison is presented between the output response of a user defined closed loop specification and the process model derived from a linear system identification, achieved by fitting a routine operating closed loop data. The identification method used is the autoregressive moving-average with exogenous input (ARMAX). A simple assessment technique, that explicitly considers the simulation analysis of certain factors such as process model gain mismatch and changes in process time delays are used for the process evaluation framework. The results obtained thus, demonstrate that an effective performance tool that is suitable for monitoring a PID controlled process is achieved
.
Index Terms—About four key words or phrases in alphabetical order, separated PID, Settling time, SISO, System identification Time delay
I. INTRODUCTION
HEpush to continuously improve and monitor industrial systems is helping create demands for simple and effective monitoring process performance schemes. In the last two decades, considerable interest and studies from both industrial and academic institutions to implement control performance techniques have been investigated. Studies in the last decade [1]-[2] have stated that over 50% of all controllers are not commissioned correctly or are poorly tuned. Thus resulting to poor performances [3] showed that over 60% of industrial controllers were reported to have performance issues. To provide a solution, various performance indices have been proposed to monitor operating process plant and aid in diagnosis of controller issues [4]-[7]. Early control loop performance monitoring benchmarks were based on a comparison of the current control loop performance and a measure achieved using minimum variance control (optimal control). This form of analysis became popular because its performance computation only required knowledge of the time delay of the system and data collected under closed loop operation. The assessment goal was to reduce process variability and operate as close as possible to optimal limits. Unfortunately, minimum variance control is rarely desired in practice due to its significant control effort demands, which can be damaging to process plants [5]. However, the performance
Manuscript received July 3, 2015; revised July 30, 2015. O. P. Eweka is with GESA VISAR Company limited (phone: +44 790-103-1098; e-mail: [email protected]).
.
measure based on minimum variance index has been shown to provide an optimal performance measure that can be used as a measure against which the output response of a controlled process can be evaluated [7]. Nowadays, people consider a measure technique that can be automated and used to monitor control system performance that could be affected by different issues and thus begin to perform out of specification. This includes unmeasured disturbances, poor control tuning, modifications of operating limits and significant time delays. A survey of literature relating to control performance has been presented [8]. Industrial assessments are usually based on a set of control performance criteria (set point tracking, deterministic disturbance or stochastic disturbance assessment) and selection of a suitable benchmark is therefore necessary to provide a performance evaluation of the control loops regardless of the effect or nature of plant disturbances acting on the system.
Generally, industrial processes comprise of many control loops that take a variety of simple and advanced structures, which are implemented to meet the ever increasing demand for higher product quality at reduced cost. In practice, the application of Proportional Integral (PI)/Proportional Integral Derivative (PID) controllers to industrial processes have become common standards due to their simplicity and wide acceptance in industrial applications [9]-[12]. Since the first tuning rules proposed by [13], other various PID methods and modifications of the original tuning rules have followed. The focus of this paper is to propose a simple performance measure that can be used to monitor and improve PID controlled systems while understanding the effect of time delays on the control loop performance. The PID control law applied is based on an internal model control (IMC) design as this is comparable with what is now routinely applied in the industry. Simulations of a unified regulatory framework to set-point tracking is implemented and used to compare different control loops output responses. This paper is organized as follows. Section 2 provides the problem formulation, which includes a description of the system and the PID control concept considered in the study. Section 3 presents the proposed performance strategy used to assess the SISO feedback control loop. Section 4 provides illustrative examples to examine the performance scheme. Benefits and conclusion of the study are provided in section 5.
A Simple Performance Monitoring Technique
For PID Controlled SISO Processes
O. P. EWEKA,
Member, IAENG
II. PROBLEM FORMULATION
A. General Model Structure
Many process models are known to exhibit different output behavior. In this paper the controlled linear process model is represented by a discrete time model expressed in (1) as:
( ) = (1)
where { } is a white-noise process and the sequence { }, are chosen depending on the initial values j = 0, 1, 2,…The
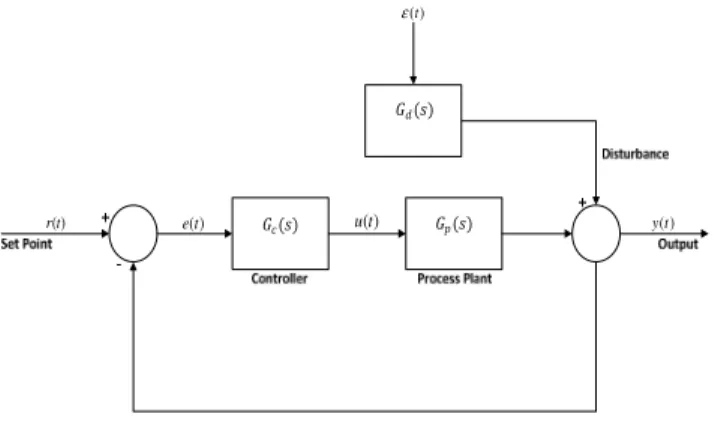
closed loop model is illustrated in fig. 1 and the following notation ( ) as the input signal to the system, ( ) is the controller error, and the controlled variable is ( ).
) (t u )
(t
r e(t) y(t)
) (t
ε
( )
( ) ( )
Fig. 1. Block diagram for assessment of controlled Feedback process.
Based on the given linear feedback controlled loop shown in Fig. 1, the approximate closed loop model is represented as:
( ) = ( − ) + ( ) (2)
Equation (2) is an ARMAX model, where A is a monic
polynomial, B is a polynomial in the time-shift operator, is
the manipulating variable or exogenous input sequence, ξ(t)
assumed to be an identically distributed random sequence. C
is a monic polynomial of the moving average component and it enables the serially correlated random effects to be modelled. The optimal approximate linear model is calculated by solving a cost function, equation (3). Such that when minimised the output is driven as closes as possible to the desired reference.
"(#$%#& #') = (())[+( + )⁄ ) − ( + ))]& ./
.0
+ 1())[∆ ( + ) − 1)]& .3
$
(3)
J is given as the cost function; #$ signifies the minimum
costing horizon; #& is the maximum costing horizon; #' is the control horizon; (()) is the error weighted co-efficient; ( + )) is the first order approach to known reference is trajectory reference. ∆ is the backward shift operator. Solving the optimization function, the PID tuning parameters are determined. For the user specified feedback
control loop, a simple second order plus dead time transfer function of the given process model in(1) is used. The transfer function is thus represented as
5( ) =7 6 $ &+ 7& + 1
89 , 7$> 7& (4)
where 6 is the process gain, 7$and 7& the process time constant, = is the time delay. A block diagram of the simulated feedback control loop is shown in fig (1) with transfer function block 5( ) as the process model, > ( ) is the control transfer function and ? is the disturbance transfer function driven by a zero mean white noise ( ). The control parameters are decided in section 2.2
B. PID Controller
A review of different PI/PID tuning methods have been presented by [12] with more than 200 tuning rules identified. These PID parameters are defined for various process models. The mathematical expression of the PID control strategy is given in (5).
( ) = 6AB ( ) +71
CD ( ) %E + 7? ( )
F (5)
where 65, 7C, 7? are the control parameters denoted as proportional gain, integral time of the controller and derivative time of the controller respectively. Practically, the control strategy (5) is not physically realisable due to its sensitivity of the derivative term with noisy signals. It turns out that the internal model control (IMC) based on augmenting the derivative term in (5) with a first order low pass filter provides a suitable PID control structure. Furthermore, its success has been attributed with its ability to provide time delay compensation and achieve a trade-off off between control performance and robustness measure to interactions makes it a suitable choice for an industrial controller. The pragmatic difficulty with PID control application is the lack of industrial standards, which leads to various PID control structures and tuning approach. The estimation of the controller parameters under designed with the Maclaurin series expansion for PID control was chosen as a good choice for both set point and regulatory process systems. This is chosen because the approximation approach of the process time delay avoids any form of deterioration of the integral and derivative time constant of the PID controller [14]. The PID parameters can thus be computed and this is therefore summarized in an analytical form and expressed in (6-8).
6A=6(21 + =)%G (6)
7G= (%$+ %&) −2(21 + =)21&− & (7)
7J = %G− (%$+ %&) +
(%$%&) −6(21 + =) =K
%G (8)
method that provides the tuning guidelines for the controller. The tuning parameter is given as lambda (1) with various selections proposed for SISO process models [15]-[18]. Based on the specified lambda proposed in literature, lambda is selected as a function of time delay (=) and time constant (%). Hence, the tuning guidelines in this study is given in (9) as:
1 = NOP (0.2=, 0.4%) (9)
III. PIDPERFORMANCE METHOD
A simple solution measure is determined for PID controlled systems. The proposed approach is similar to a historical performance monitoring framework, that implores a user specified performance measure to evaluate the PID controlled feedback system. Many practical systems have noisy signals, thus the corresponding PID control algorithm have been tuned to deliver a specific closed loop output response. The performance approach therefore takes into consideration a characteristic behavior of the output response by assessing the settling time determined from model estimates. Based on this parameter, a performance metric given in (10) is defined.
PERF.M.= S _U5VWXUU5 S _>XU9V?XUU5
S _U5VWXUU5 × 100% (10)
The index metric lies within zero and a hundred percent. Since most controllers are designed to improve the performance of the process. Hence an optimal output response indicate a percentage value close to 100% and a zero percentage (0%) value indicates the performance of the process can be improved upon. The open and closed loop settling time are determined based on the applying the ARMAX identification model analysis. This is carried out by fitting a time series model to the closed loop operating process and estimating the measured response. For analysis purpose, two models and a large amount of data are considered. In addition, a residual test analysis and a validation process are carried out to determine if the estimated model is a good fit. The first model constitutes the description of the closed loop dynamics of the system during set point changes. While, the second model relates to the open loop model of the process, which is a challenging procedure to carry out because under closed loop control the input is dependent on the output of the process and this renders many identification techniques unsuitable [19]. To address this difficulty, two general methods are proposed. The first involves a two stage identification approach that considers the dynamics of the controller when identifying the process dynamics. An alternative method is to introduce a random excitation signal (dither signal) that does not dominate the actions of the controller output [20]. In this paper, the two stage method is chosen for the system identification as this does not disturb the process, since the process model is known, in this case an ARMAX model is selected to estimate the response data. An impulse test is further carried out to obtain the selected characteristic behavior of the system. Due to the nature of the disturbance acting on the process, the settling time is determined for when the output response reaches within 5% of the final steady value. Simulation analysis to demonstrate the
potential of this proposed method is presented in section (4).
IV. DEMONSTRATED CASE STUDY AND ASSESSMENT
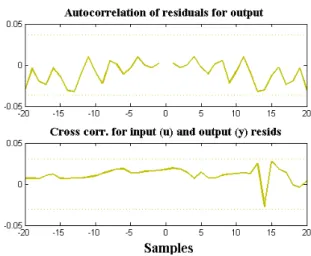
Considering a second order plus time delay system (SOPTD) 6 = 2, %$= 10 %&= 2 = = 3 with an additive disturbance to the system, described as colored white noise. The IMC-PID controller presented in (4, 5and 6) has its control parameters as fA= 0.4979, 7g = 10.9545 and 7h = 0.7429 and simulation of control loop using a step input signal is carried out for large sample data points, chosen for identification purposes. The sampling time 79= 1 and a noise variance value of 0.36 was used. Fitting an ARMAX model(iO = 2; ik = 6; i = 5; if = 3), an estimate of the process dynamics was determined. The simulated and estimated output response is presented in fig (2). A validation analysis based on correlation measure of the modeled output is illustrated in fig (3)
Fig. 2. Simulated and Estimated output response
Fig. 3. Autocorrelation residual plot used for validation
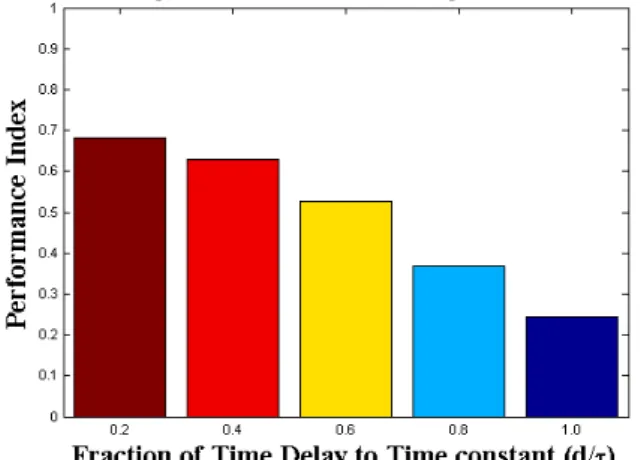
the user specified PID feedback control loops gives a percentage of 73%. This result indicates the process output response can be improved upon by retuning the PID controller. To examine the suitability of the proposed performance metric for PID controlled processes a variation of the time delay to time constant l8mn, ranging from 0.1 to 1 was carried out. Comparison of the output response, of the process variations had similar responses as illustrated in fig (2). The performance evaluation of only the time delay to process time constant is illustrated in fig (4). Further assessment study was carried out by considering the process model mismatch gain of 10% and 20%. The performance results using a bar chart is illustrated in Fig. (5) and fig (6).
Fig. 4. Process model Performance Measure of varying Time delay to time constant
Fig. 5. Performance measure for 10% Process model gain mis-match
Fig. 6. Performance measure for 20% Process model gain mis-match
Fig. 4, shows that, for conditions where there is no plant model mismatch the performance of the PID control for the range of time delays achieves a higher percentage metric value of the closed loop response, when compared to the performance metric of process model gain mismatch in Fig. 5 and 6. However, as the time delay to time constant ratio increases, the performance of the PID controlled system degrades gradually for the various case studies considered. This performance scheme, thus demonstrates a simple evaluation approach that allows for the monitoring of a process closed loop output response.
V. CONCLUSION AND BENEFITS
A simple and effective performance monitoring technique for a PID controlled process has been presented. Results obtained for set point tracking of the system allow for improvement and evaluation of the desired closed loop output response by examining the characteristic behaviors of the system response. It can also be used as a tool to observe and determine early deteriorating conditions of a closed loop output system response. Furthermore, the proposed approach can be applied as a monitoring strategy to PID controlled processes with varying disturbance change, although this has not been explored in this paper.
REFERENCES
[1] Ender, David B. "Process control performance: Not as good as you think." Control Engineering 40, no. 10
(1993): 180-190.
[2] Pfeiffer, Bernd-markus, Roland Wieser, and Otmar Lorenz. "Wie verbessern Sie die Performance Ihrer Anlage mit Hilfe der passenden APC-Funktionen?." atp edition-Automatisierungstechnische Praxis 51, no. 04
(2009): 36-44.
[3] Bialkowski, W. L. "Dreams versus reality: a view from both sides of the gap: manufacturing excellence with come only through engineering excellence." Pulp & Paper Canada 94, no. 11 (1993): 19-27.
[4] Harris, T. J., C. T. Seppala, and L. D. Desborough. "A review of performance monitoring and assessment techniques for univariate and multivariate control systems." Journal of Process Control 9, no. 1 (1999):
1-17.
monitoring tool and applications in a flotation plant."
Minerals Engineering 16, no. 11 (2003): 1069-1074.
[6] Hoo, K. A., M. J. Piovoso, P. D. Schnelle, and D. A. Rowan. "Process and controller performance monitoring: overview with industrial applications."
International Journal of Adaptive Control and Signal Processing 17, no. 7‐9 (2003): 635-662.
[7] Qin, S. Joe. "Control performance monitoring—a review and assessment." Computers & Chemical Engineering 23, no. 2 (1998): 173-186.
[8] Jelali, Mohieddine. "An overview of control performance assessment technology and industrial applications." Control Engineering Practice 14, no. 5
(2006): 441-466.
[9] Rhinehart, R. Russell. "The century's greatest contributions to control practice." ISA transactions 39,
no. 1 (2000): 3-13.
[10]Åström, Karl Johan, and Tore Hägglund. "The future of PID control." Control engineering practice 9, no. 11
(2001): 1163-1175.
[11]O'Dwyer, Aidan. "PID compensation of time delayed processes 1998-2002: a survey." (2003).
[12]O'Dwyer, Aidan. Handbook of PI and PID controller tuning rules. Vol. 57. London: Imperial College Press,
2009.
[13]Ziegler, J. G., and N. B. Nichols. "Optimum settings for automatic controllers." Journal of dynamic systems,
measurement, and control 115, no. 2B (1993): 220-222.
[14]Panda, Rames C., Cheng-Ching Yu, and Hsiao-Ping Huang. "PID tuning rules for SOPDT systems: Review and some new results." ISA transactions 43, no. 2
(2004): 283-295.
[15]Rivera, Daniel E., Manfred Morari, and Sigurd Skogestad. "Internal model control: PID controller design." Industrial & engineering chemistry process design and development 25, no. 1 (1986): 252-265.
[16]Fruehauf, Paul S., I-Lung Chien, and Mark D. Lauritsen. "Simplified IMC-PID tuning rules." ISA Transactions 33, no. 1 (1994): 43-59.
[17]Skogestad, Sigurd. "Simple analytic rules for model reduction and PID controller tuning." Journal of process control 13, no. 4 (2003): 291-309.
[18]Luyben, Michael L., Bjorn D. Tyreus, and William L. Luyben. "Plantwide control design procedure." AICHE journal 43, no. 12 (1997): 3161-3174.
[19]Ljung, Lennart. "Perspectives on system identification."
Annual Reviews in Control 34, no. 1 (2010): 1-12.
[20]Forssell, Urban, and Lennart Ljung. "Closed-loop identification revisited." Automatica 35, no. 7 (1999):