Nowcasting Intraseasonal Recreational
Fishing Harvest with Internet Search Volume
David W. Carter*, Scott Crosson, Christopher Liese
Social Science Research Group, NOAA Southeast Fisheries Science Center, Miami, Florida, United States of America
*david.w.carter@noaa.gov
Abstract
Estimates of recreational fishing harvest are often unavailable until after a fishing season has ended. This lag in information complicates efforts to stay within the quota. The simplest way to monitor quota within the season is to use harvest information from the previous year. This works well when fishery conditions are stable, but is inaccurate when fishery conditions are changing. We develop regression-based models to“nowcast”intraseasonal recreational fish-ing harvest in the presence of changfish-ing fishery conditions. Our basic model accounts for sea-sonality, changes in the fishing season, and important events in the fishery. Our extended model uses Google Trends data on the internet search volume relevant to the fishery of inter-est. We demonstrate the model with the Gulf of Mexico red snapper fishery where the recrea-tional sector has exceeded the quota nearly every year since 2007. Our results confirm that data for the previous year works well to predict intraseasonal harvest for a year (2012) where fishery conditions are consistent with historic patterns. However, for a year (2013) of unprec-edented harvest and management activity our regression model using search volume for the term“red snapper season”generates intraseasonal nowcasts that are 27% more accurate than the basic model without the internet search information and 29% more accurate than the prediction based on the previous year. Reliable nowcasts of intraseasonal harvest could make in-season (or in-year) management feasible and increase the likelihood of staying within quota. Our nowcasting approach using internet search volume might have the potential to improve quota management in other fisheries where conditions change year-to-year.
Introduction
All federally-managed saltwater fisheries in the United States have a“hard”cap or quota on har-vest and measures to prevent the quota from being exceeded. The commercial and recreational fishing sectors are held accountable for exceeding their share of the quota with adjustments in the following year [1,2]. Commercial fishing catch statistics are typically available in time to monitor the progress towards the commercial quota share within the season. However, esti-mates of recreational harvest are often not available until after the season has ended. For exam-ple, the Marine Recreational Information Program (MRIP) of the U.S. National Oceanic and
OPEN ACCESS
Citation:Carter DW, Crosson S, Liese C (2015) Nowcasting Intraseasonal Recreational Fishing Harvest with Internet Search Volume. PLoS ONE 10(9): e0137752. doi:10.1371/journal.pone.0137752
Editor:Jeffrey Buckel, North Carolina State University, UNITED STATES
Received:December 3, 2014
Accepted:August 20, 2015
Published:September 8, 2015
Copyright:This is an open access article, free of all copyright, and may be freely reproduced, distributed, transmitted, modified, built upon, or otherwise used by anyone for any lawful purpose. The work is made available under theCreative Commons CC0public domain dedication.
Data Availability Statement:All files required to replicate the manuscript are available athttp://www. sefsc.noaa.gov/socialscience/
carterCrossonLieseNowCasting.htm.
Funding:The authors have no support or funding to report.
Atmospheric Administration (NOAA) aims to release preliminary estimates of recreational fishing harvest 45 days after the estimation period ends. Final harvest estimates are usually avail-able by mid-April of the following year. In these situations, fishery managers seeking to deter-mine if the quota has been exceeded can either wait for official estimates or use an alternative approach to approximate current harvest. Simplenaivepredictions can be used whereby harvest during the same period in the previous year is used to estimate the missing current period har-vest level. We use the term naive from time series analysis to denote a forecast based on a previ-ous period [3]. This practice can work well for relatively stable fisheries. However, when the season length is subject to change and fishing effort, catch rates, or fish sizes vary, the practice of using historical data to proxy the present is problematic. In addition, naive predictions for a cur-rent period are not possible when the fishery was closed during that period in the prior year.
We introduce a regression approach that uses information on fishery-related internet search volume to provide more timely intraseasonal predictions of recreational harvest. There is a growing literature showing that the internet search volume on a particular topic (e.g., unem-ployment insurance) can be used to predict current levels of policy-relevant variables (e.g., unemployment rates) [4]. Importantly, these predictions are not forecasts of future conditions, but rather“nowcasts”of current conditions. In the words of Choi and Varian [5] the goal is to
“predict the present.”Nowcasting has value because traditional methods of compiling statistics from surveys or official records takes time. Any lag between the time that decision makers need information and the time that the information is available increases uncertainty, which increases the risk of poor decision making. If nowcasting can reduce this uncertainty, the qual-ity of decisions can be improved [5–9]. Nowcasting attempts to arrive at an estimate sooner, but in no way replaces traditional methods, which remain the standard against which nowcasts are judged and continuously re-calibrated.
We demonstrate the harvest nowcasting approach with the Gulf of Mexico recreational red snapper fishery. This fishery has been particularly difficult to manage with progressively short-ening seasons in the presence of changes in effort and an increasing average fish size. The recre-ational sector has overharvested red snapper in every year from 2007 to 2013 with the
exception of 2010, when the Deepwater Horizon (DWH) oil spill forced a mandatory closure of prime fishing grounds during the busy summer season.
NOAA fisheries forecasts recreational harvest of red snapper and other key species several months in advance in order to set fishing seasons [10]. Forecasts are based on trends in histori-cal catch rates and fish weight by fishing sector (private, for-hire). The agency does not regu-larly monitor the harvest of red snapper within the season because the season is shorter than the data reporting period. However, there have been times when managers reopened the fishery later in the year. In these cases there was a need for information on the cumulative level of har-vest before the harhar-vest data were available. For example, in 2013 following a new stock assess-ment, the recreational quota increased after the summer season closed and there was an interest in re-opening the season in the fall. In this case, there was a need to determine whether the new quota had been exceeded during the original season. Our proposed approach is designed to warn fishery managers of pending quota overages within the year by nowcasting harvest using a regression model including data on internet searches during the summer months when fishing activity peaks.
Materials and Methods
Recreational Fishery Harvest Data
recreational harvest as the season proceeds in two-month waves and is compiled from three sep-arate surveys. The NOAA MRIP provides bi-monthly (wave) estimates of fish harvested by for-hire charter and private boats fishing in the marine waters of Florida, Alabama, Mississippi, and Louisiana. Preliminary wave estimates from the MRIP are typically available 45-days after the end of the wave and final estimates for the previous year are usually released during April. Har-vest estimates from private and charter boats fishing in the marine waters of Texas are provided by the Texas Parks and Wildlife Division (TPWD) Creel Survey. The TPWD estimates can be delayed anywhere from six months to a year or more. The NOAA Southeast Headboat Survey (HBS) provides estimates of harvest from head boats in the marine waters of all states in the Gulf of Mexico. The HBS estimates are also often delayed by more than a year.
Our analysis uses bi-monthly (wave) estimates of aggregate recreational fishing harvest (whole weight) of red snapper in the Gulf of Mexico between 2004 and 2013. In 2013, MRIP implemented an improved sampling design for the onsite Access Point Angler Intercept Survey (APAIS) that is used to estimate the mean harvest per angler fishing trip. Revised harvest esti-mates for 2013 were released in December of 2014 along with re-calibrated estiesti-mates of harvest for 2004 to 2012. However, the nowcasting thought experiment used to test competing forecast models used in this analysis requires that we develop models using only the information avail-able at the time of the forecast.
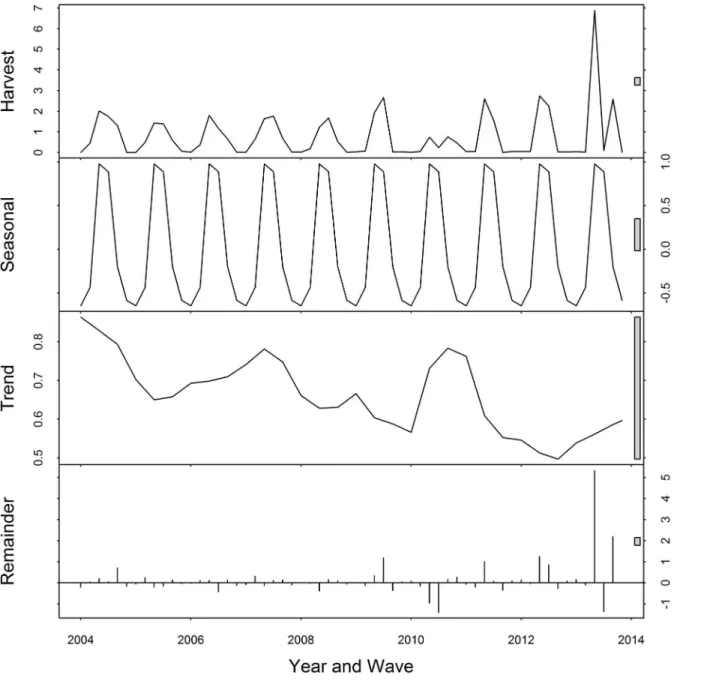
The seasonal and trend Loess-decomposition of the harvest series is displayed inFig 1. The decomposition was conducted using thestl()function in thestatspackage ofR[11]. The
raw harvest data series is shown in the first panel with the grey range bar on the right side indi-cating the relative scale of the series. The grey range bars on the right in the bottom three pan-els indicate the scale of each time series component relative to the raw data series with shorter range bars indicating a greater contribution. According to the second panel, red snapper har-vest is highly seasonal with a peak occurring during the summer months and low during the winter months. The third panel shows what appears to be a downward trend. However, the rel-atively long range bar, i.e., small magnitude, suggests that the trend is not a very important con-tributor to the variation of the harvest series. The last panel displays the remaining random component of the series that cannot be explained by seasonality or a trend. The short range bar of the remaining component suggest that there is still considerable unexplained (beyond sonal and trend) variation in the harvest series, especially in recent years when the fishing sea-son has changed frequently. Some of this extra variation is evident in the reduced harvest levels during the summer of 2010 when a substantial portion of the Gulf of Mexico was closed to fish-ing followfish-ing the explosion of the DWH oil rig.
Previous projections estimated landings per day (in numbers) during summer when tour-ism is high and weather tends to be better than fall. Because the Gulf Council is proposing to reopen in September or October, landings per day are not expected to be as high as sum-mer due to lower tourism, more severe weather, and children returning to school. Because the season has not been open in fall since 2010, and prior to then not since 2007, it is diffi-cult to predict fall landings per day. . .Season lengths presented herein are contingent on previous projections accurately estimating the length of the fishing season under a 4.145 mp quota. Given inconsistent regulations and historical overages of the quota, there is potential that the summer season length (Jun 1-Jun 28) was too long and may result in a quota over-age. Similarly, given the short duration of the season, it may have been too short and the quota might not have been met. If landings during summer are greater than the current
Fig 1. Loess Decomposition of Red Snapper Harvest (Million Pounds): 2004—2013, by wave.
4.145 mp quota, then season lengths presented herein will be overestimated. If landings dur-ing summer are less than the current 4.145 mp quota, then average weights and/or landdur-ings per day have been overestimated, and season lengths presented herein would be
underestimated.
Note that the process to reopen a season is a lengthy administrative process. Thus, the har-vest estimates for the May-Jun wave of 2013 were not available when the decision to re-open the fall season was made. It was assumed that the quota was harvested exactly during the sum-mer season. Data from 2011 and 2012 were used to project the harvest information necessary to set the fall season.
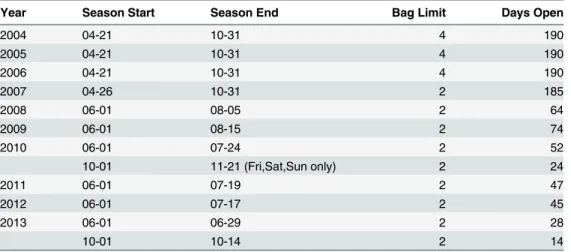
Though not shown inTable 1, Texas, Louisiana and Florida set regulations for fishing in state waters in some years that differed from the federal waters regulations. Throughout the study period, Texas allowed harvest year-round in state waters with a 4-fish bag limit. In 2013, Louisiana had a weekend-only (Friday through Sunday and some holidays) season in state waters from mid-April through the end of September with a 3-fish bag limit (2-fish during the federal season). Also, in 2013, Florida opened red snapper fishing in state waters for 68-days from June 1st to July 14th and from October 1st to October 14th.
Internet Search Volume Data
Google provides two tools to examine the periodic volume of queries that users enter into the Google internet search engine. The first, Google Trends, allows users to download monthly or weekly indices of the web search volume for a particular term. The index value for each period is calculated by dividing by the total count for all queries in that period from the U.S. and then scaled such that the highest volume in the series is assigned 100 and the lowest volume is assigned 0. Importantly, the normalization controls for the growth in all Internet search use over time.
The second Google tool, Google Correlate, returns the search volume for any term along with the volume of searches for the top correlated terms. The tool will also return the top inter-net search terms that is correlated with any data series you enter. All series from the Google Correlate tool are further standardized to have a mean value of zero and a variance of one [13].
We downloaded the standardized monthly series from 2004 to 2013 for the term“red snap-per season”in the U.S. from the Google Correlate tool. This series contains more information
Table 1. Regulations on the Recreational Harvest of Red Snapper in the Federal Waters of the Gulf of Mexico, 2004—2013.
Year Season Start Season End Bag Limit Days Open
2004 04-21 10-31 4 190
2005 04-21 10-31 4 190
2006 04-21 10-31 4 190
2007 04-26 10-31 2 185
2008 06-01 08-05 2 64
2009 06-01 08-15 2 74
2010 06-01 07-24 2 52
10-01 11-21 (Fri,Sat,Sun only) 2 24
2011 06-01 07-19 2 47
2012 06-01 07-17 2 45
2013 06-01 06-29 2 28
10-01 10-14 2 14
than the Google Trends series because Google Trends sets the search volume to 0 for periods where the volume is below a certain (unspecified) threshold. In this case, the index for the term
“red snapper season”was 0 in most months prior to 2011 in the Google Trends series, but not the Google Correlate series.
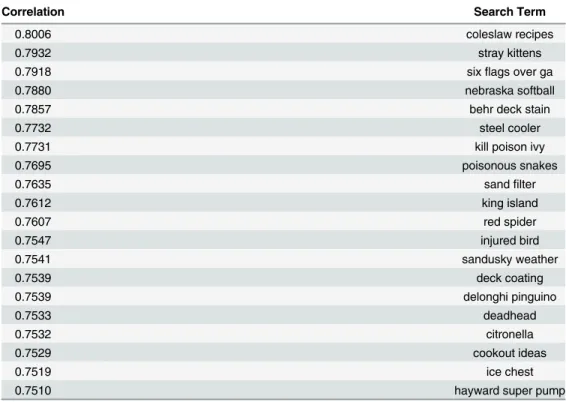
There are many other search terms that might be correlated with red snapper harvest. Some are too general (e.g., red snapper) because the terms refer to behavior not related to fishing (e.g., recipes). Other terms (e.g., red snapper bag limit) are too specific because there simply is not enough search volume. We started with the most obvious term,“red snapper season”, and it worked reasonably well. As noted, above, the Google Correlate tool will return the top inter-net search terms correlated with any data series you enter.Table 2shows the search terms that are correlated with the monthly (interpolated bi-monthly) red snapper harvest series. On cor-relation alone, this table suggests we should have used the term“coleslaw recipes”in our model. However, this term and the others in the table are not directly related to fishing. Most appear related to summer activities, suggesting a common seasonality with the red snapper harvest series. The raw correlation between the red snapper harvest series and the (1st month)
“red snapper season”search term is 0.482. This correlation is much lower than the correlation with searches for“coleslaw recipes’, but the relationship is much more plausible. Since there are millions of possible search terms, correlation alone cannot identify an appropriate search term. Instead, a search term must be found that a) is fairly exclusive to the particular fishery and management problem being studied and b) is broad enough to produce significant volume. The latter implies that the particular fishery management problem being studied needs to lead anglers to query the internet. A search term satisfying both a) and b) will not necessarily exist for all fisheries and management problems.
Our harvest data is in bi-monthly periods and the internet search volume data is monthly. Rather than aggregating the monthly internet search volume data to bi-monthly observations,
Table 2. Search Terms Correlated with Red Snapper Harvest.
Correlation Search Term
0.8006 coleslaw recipes
0.7932 stray kittens
0.7918 sixflags over ga
0.7880 nebraska softball
0.7857 behr deck stain
0.7732 steel cooler
0.7731 kill poison ivy
0.7695 poisonous snakes
0.7635 sandfilter
0.7612 king island
0.7607 red spider
0.7547 injured bird
0.7541 sandusky weather
0.7539 deck coating
0.7539 delonghi pinguino
0.7533 deadhead
0.7532 citronella
0.7529 cookout ideas
0.7519 ice chest
0.7510 hayward super pump
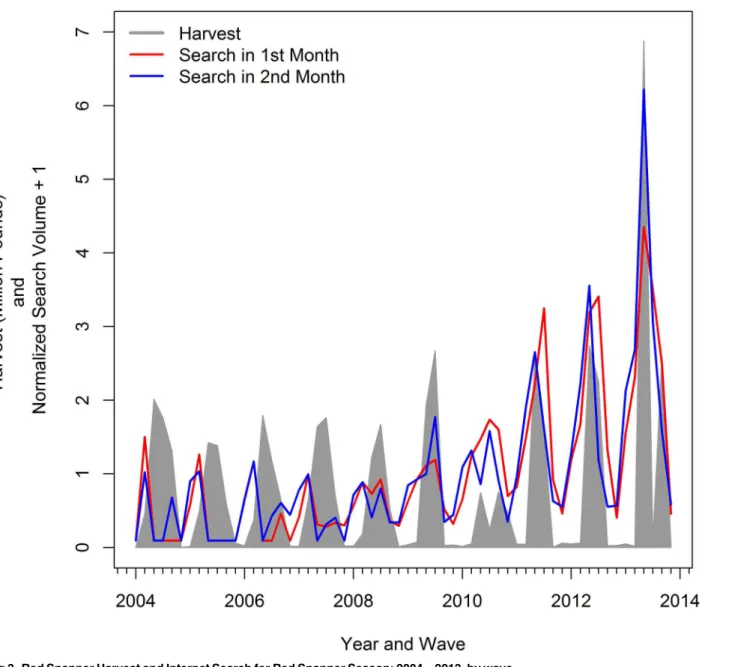
we chose to consider the search volume of both months in a two-month period separately in our discussion and models.Fig 2shows the U.S. search volume for the term“red snapper sea-son”on a bi-monthly scale. The line labeled“Search in 1st Month”is the volume in the first month of the period and the line labeled“Search in 2nd Month”is the volume for the second month of the period. Note that we have added 1 to every observation in the two search volume series so that the series are everywhere positive. This is only for display purposes. In general, the search volume of the two months in each period move together. The figure also shows the number of days in each two-month period when red snapper harvest was allowed in the federal waters of the Gulf of Mexico. Notice how the searches peak just before the season opens in early years, but become more erratic in later years.
Fig 3again shows the U.S. search volume for the term“red snapper season”for each month in the two-month period, this time with the bi-monthly harvest of red snapper in the Gulf of of
Fig 2. Red Snapper Season and Internet Search for Red Snapper Season: 2004—2013, by wave.
Mexico. The search volume precedes the harvest levels in the early years of the series, but tends to overlap with harvest levels in latter years.
Modeling Approach and Diagnostics
There is approximately a two month lag in the preliminary estimates of the recreational harvest of red snapper in the Gulf of Mexico; that is, the earliest estimated harvest for the two-month period just completed is available at the end of the following two-month period. Therefore, managers do not know whether the quota has been exceeded at the end of a period until two months later. We consider three different approaches to nowcast the harvest level of the period just completed. The approaches are based on three different forecasting models. The first model is a naive prediction that assumes the current period harvest is the same as the harvest level in the same period of the previous year. This nowcasting approach typically works well
Fig 3. Red Snapper Harvest and Internet Search for Red Snapper Season: 2004—2013, by wave.
for series with stable seasonality [3] and will be the benchmark with which we evaluate the other two nowcasting models. The benchmark is set to reflect a strategy that is intuitively appealing and easy to implement. We emphasize, however, that the naive approach does not represent current practice because NOAA fisheries does not usually monitor the red snapper quota within the year.
Our next model addresses the seasonal pattern evident in the harvest time series (seeFig 1) and key fishery closure events. The seasonal pattern appears to be stable (i.e., deterministic), however, there is still a possibility that there are changes in the seasonality over time that are not revealed upon visual inspection of the series. Canova and Hansen developed a procedure to test the null hypothesis of deterministic (six two-month periods annually) seasonality against the alternative of seasonal non-stationarity [14]. Thensdiffsfunction in theforecast package forRuses this test to determine the number of seasonal differences (i.e., current period
harvest minus the harvest six periods or one year prior), if any, necessary to make a given sea-sonal time series stationary. In the case of the red snapper harvest series, the test does not reject the null hypothesis of deterministic seasonality. Therefore, the starting point for the second model is a regression of the harvest series on an intercept and one indicator for each two-month wave (2 through 6) that equals one if the observation is in that wave and zero otherwise. We also add the first and sixth lag of the harvest variable to this regression to address seasonal autocorrelation, a variable for the number of days closed to red snapper fishing in the period, and an indicator for the two periods following the DWH oil spill event in 2010. This model nowcasts the harvest level in the current period to be the same as the historic average harvest level in that period with adjustments for the harvest levels in the previous period and a year ago as well as closures due to regulations and the DWH event. The third model adds two vari-ables to the second model indicating the internet search volume for the term“red snapper sea-son”in the first and second month of the period. The third model also includes interactions between the number of days closed and the search terms to allow for a differential effect of search when the season is closed and when it is not. Recent observations related to the use of internet search volume in forecasting, for example flu outbreaks, has suggested that the distinc-tion between simple interest in a topic and actual behavior is important [15,16]. The general form of the complete model is
ht¼a 1 þ
X6
i¼2
aiwitþb1ht 1þb2ht 6þb3dtþb4ct
þb5s1tþb6s2tþb45cts1tþb46cts2tþet
ð1Þ
wherehtis the harvest of red snapper in periodt, eachwitterm equals one if periodtis wavei of the year and zero otherwise,ht−1andht−6is the harvest of red snapper in the previous period and the same period of the previous year, respectively,dtequals one if the period was closed to fishing following the DWH event and zero otherwise,ctis the number of days closed to red snapperfishing during the period,s1tands2tis the internet search volume for the term“red snapper season”during thefirst and second months of the period, respectively,etis an i.i.d. error term, and theαandβterms are parameters to estimate. To recap, thefirst model is a naive prediction based on the harvest during the same period in the previous year; the second model contains the wave indicator variables (wit), thefirst (ht
−1) and sixth (ht−6) lags of harvest, the indicator (dt) for the DWH event and the variable (ct) for the number of days closed to red snapperfishing; and the third model is the complete equation shown above.
2012 and 2013 with days open to red snapper fishing. Model specification goodness-of-fit is examined using the adjustedR2measure of the coefficient of determination. The residuals of a good forecasting model will have a mean of zero and be uncorrelated. If, in addition, the residu-als are normally distributed and have a constant variance, then the construction of confidence intervals for forecasts is straightforward [3]. The null of independence and normality of the residuals from each forecast model are evaluated using the Ljung-Box and Shapiro-Wilk tests, respectively (box.test()andshapiro.test()in thestatsRpackage). The
Breusch-Pagan test (bptest()in thelmtestRpackage) is used to test the null that the variance of
the residuals is constant. Unless otherwise noted, all modeling, diagnostics, and forecasting is conducted using theforecastpackage forR[17].
The performance of each model in nowcasting harvest is examined by comparing the actual harvest in periods of 2012 and 2013 that have some days open for red snapper fishing with the model predictions for these periods. For any given model the harvest for each period is pre-dicted by estimating the model with data up to the period with open days and then calculating a one-step-ahead forecast. For example, the harvest nowcasts for May-Jun of 2012 is based on the models estimated using data up to Mar-Apr of 2012. Note that in this example the third (complete) model would use the internet search volume information for May-Jun to help pre-dict May-Jun harvest. We compare the nowcasting ability of the second and third models to evaluate the potential difference in nowcasts with and without the internet search volume information. This follows the approach used by others who have examined whether search vol-ume can improve the best forecasts available using the data available at the time of forecast [5,
7,9]. Nowcast accuracy is measured using the mean absolute error (MAE) as recommended by Hyndman and Koehler [18] when comparing the accuracy of forecasts of series measured on the same scale. Lower MAE values indicate more accurate harvest nowcasts.
As a check on the policy relevance of the modeling results we examine the ability of a model to determine whether the harvest has exceeded the quota during a period with open days. Two performance measures are examined. For each model, the first performance measure takes the cumulative harvest from the previous periods and adds the one-step-ahead forecast for the cur-rent period, i.e.,
^ Ht ¼Ht
1þ ^
ht ð2Þ
whereH^tis the estimated cumulative harvest in periodtandHt−1is the observed cumulative harvest in the previous period, andh^tis the nowcast harvest estimate for periodt. For each model, we graphically examine how close the estimated cumulative harvest fromEq 2is to the quota during the open season. The nowcast estimates are subject to prediction error. Therefore, assuming that the prediction errors are normally distributed, the second performance measure for each model calculates the prediction intervals and the probability that the quota has been exceeded for each nowcast period.
Results
Specification Evaluation and Parameter Discussion
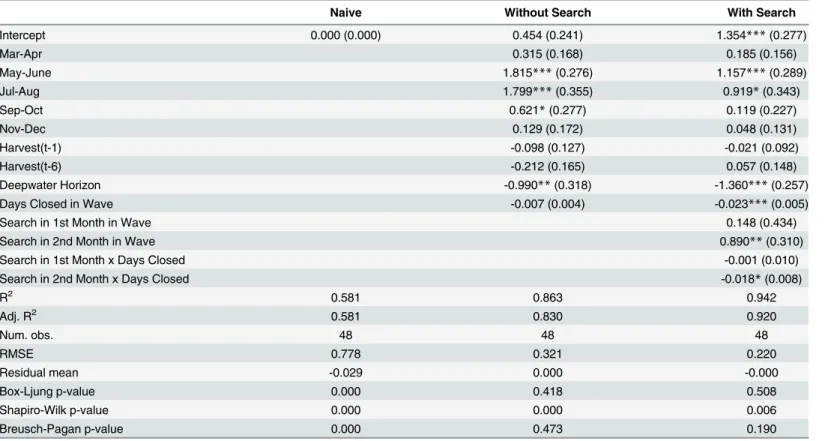
increases with each model going from left to right. The naive model explains about 58% of the variation in red snapper harvest. The amount of variation explained increases to around 83% with the second model when the seasonality and fishery closures are included. Importantly, the complete model with the internet search volume explains about 92% of harvest variation. This suggests that the internet search volume for the term“red snapper season”can be used to predict red snapper harvest variation beyond the amount explained by seasonality and fishery closures.
The residual mean in all models, except the naive, is zero indicating that the models can pro-duce unbiased forecasts. The null of independence in the Ljung-Box test cannot be rejected at the 95% level in all models, except the naive. The null of normality in the Shapiro-Wilk test is rejected at the 95% level in all models. The null of a constant residual variance (homoscedastic-ity) in the Breusch-Pagan test cannot be rejected at the 95% in any model, except the naive. Thus, the complete model comes close to satisfying all of the tests for a good forecast model, passing the tests for constant residual variance and residual independence, but not the test for residual normality. The normality of the residuals is not essential, but does make calculating confidence intervals easier. In any case, the complete model specification including the season-ality, the fishery closures, and the internet search volume appears to fit the historic data best and provides the best forecasting properties. Based on this finding we proceed with the com-plete model for the one-step-ahead nowcast of the harvest in each two-month period of 2012
Table 3. Red Snapper Recreational Harvest Regression Results: 2004—2011.
Naive Without Search With Search
Intercept 0.000 (0.000) 0.454 (0.241) 1.354***(0.277)
Mar-Apr 0.315 (0.168) 0.185 (0.156)
May-June 1.815***(0.276) 1.157***(0.289)
Jul-Aug 1.799***(0.355) 0.919*(0.343)
Sep-Oct 0.621*(0.277) 0.119 (0.227)
Nov-Dec 0.129 (0.172) 0.048 (0.131)
Harvest(t-1) -0.098 (0.127) -0.021 (0.092)
Harvest(t-6) -0.212 (0.165) 0.057 (0.148)
Deepwater Horizon -0.990**(0.318) -1.360***(0.257)
Days Closed in Wave -0.007 (0.004) -0.023***(0.005)
Search in 1st Month in Wave 0.148 (0.434)
Search in 2nd Month in Wave 0.890**(0.310)
Search in 1st Month x Days Closed -0.001 (0.010)
Search in 2nd Month x Days Closed -0.018*(0.008)
R2 0.581 0.863 0.942
Adj. R2 0.581 0.830 0.920
Num. obs. 48 48 48
RMSE 0.778 0.321 0.220
Residual mean -0.029 0.000 -0.000
Box-Ljung p-value 0.000 0.418 0.508
Shapiro-Wilk p-value 0.000 0.000 0.006
Breusch-Pagan p-value 0.000 0.473 0.190
***p<0.001,
**p<0.01,
*p<0.05.
and 2013 with days open to red snapper fishing. However, we also generate the nowcasts using the specification (model 2) without the internet search volume so that we can compare the nowcasts with and without the internet search volume.
Before discussing the results of the nowcasts for 2012 and 2013, we briefly review the esti-mated parameters from the complete specification (the last column) inTable 3. The constant and the indicators for May-Jun and Jul-Aug are significantly different from zero at the 95% level. Approximately one million pounds more of red snapper was harvested during waves 3 and 4 than during Jan-Feb. This happens because the season for red snapper occurred primar-ily during waves 3 and 4 in each year of our study period. Harvest decreased by more than 1.3 million pounds in the waves following the DWH event. The parameters on the harvest one wave and one year prior are not significant at the at the 95% level.
The effects of the number of days closed to red snapper fishing in a wave and the internet search volume are more complicated because of the interaction terms. At the average level of internet search volume in a period (i.e.,s1t=s2t= 0 because the search series is normalized to the mean of the series) each day closed to fishing is related to a 23 thousand pound reduction in harvest on average. When there are no days closed to fishing in a wave then the effect of internet search volume is given by parameters on 1st and 2nd month activity alone. The parameters related to the search volume in 1st month of the wave are not significant at the 95% level. The parameters related to the 2nd month search volume are significant at the 95% level suggesting a one unit (standard deviation) increase in search volume is related to nearly 900 thousand more pounds being harvested (when every day in the wave is open to harvest). Based on the interac-tion terms, for each addiinterac-tional day open to harvest, a one unit increase in internet search volume in the 2nd month of the wave is related to a 18 thousand pound increase in harvest.
Nowcasts for 2012 and 2013
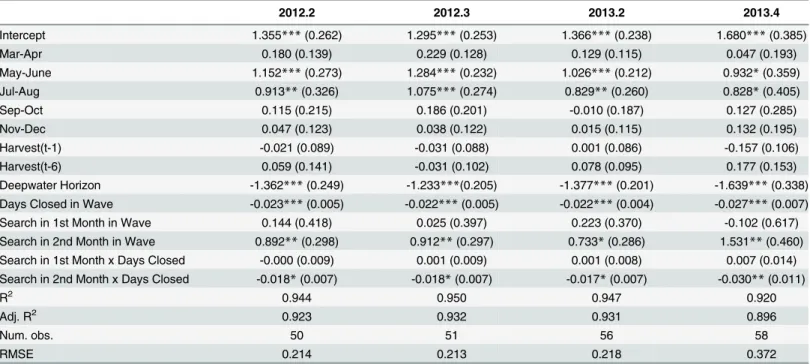
Table 4shows the parameter estimates for the models used to calculate the one-step-ahead fore-casts (nowfore-casts) for the waves with open fishing days in 2012 and 2013. Each column has the results for the model estimated using the data up to the year and wave indicated. For example, the column labeled 2012.2 contains the parameter estimates based on the data through Mar-Apr of 2012. The estimates in this column are used to calculate the nowcast for May-Jun of 2012. The parameter estimates are similar to the results described for the complete model (last column) inTable 3. However, the estimates of the parameters on internet search volume terms for the 2nd month in the wave are larger for the model using the most recent data. The magni-tude of the parameter on search in 2nd month in the wave and parameter on the related interac-tion with days closed doubles for the data through 2013.4 relative to the rest of the periods. This suggests a growing importance of the internet search volume signal. The model fit also declines slightly in recent periods indicating an increasing amount of noise in the harvest data.
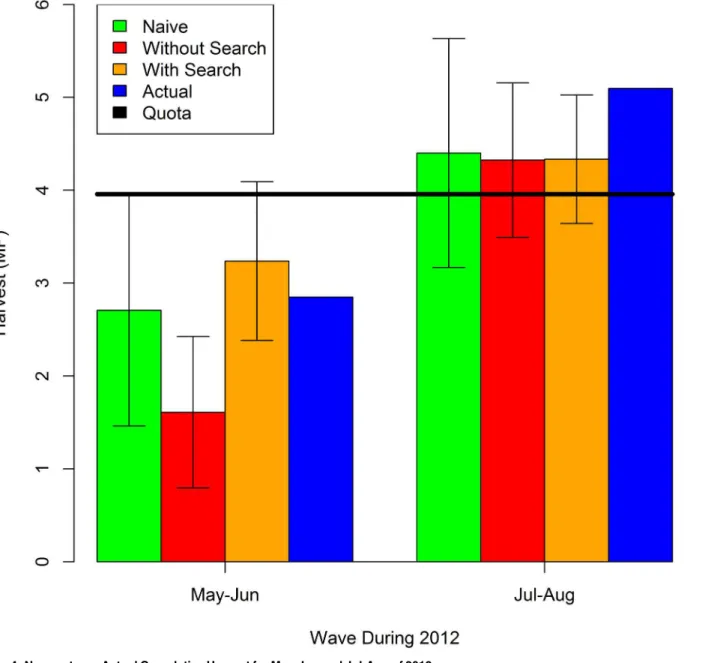
(in Jul-Aug). The MAE of the nowcast for waves 3 and 4 of 2012 with the naive approach, the model without search volume, and the model with search volume is 0.42, 1.01, and 0.58, respec-tively. In the case of 2012 the naive approach nowcasts May-Jun and Jul-Aug harvest slightly better than the complete model with internet search volume. However, the model nowcasts these waves 43% better with internet search volume than without.
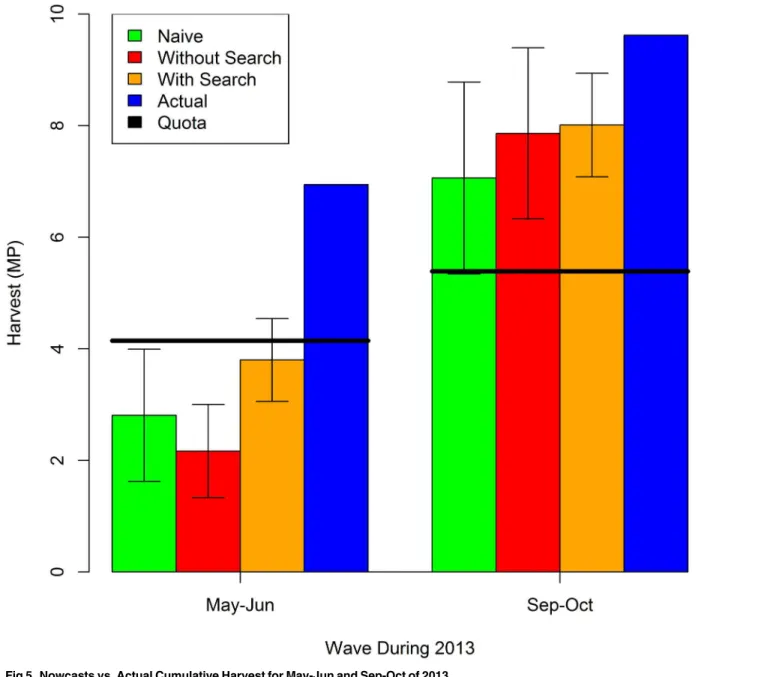
The cumulative harvest in waves 3 and 5 of 2013 is nowcast usingEq 2and models 2013.2 and 2013.4. The results are shown inFig 5along with the actual cumulative harvest, the esti-mate using the naive model, and the estiesti-mate using the model without the internet search vol-ume. Again, the black horizontal bars indicate the quota which was increased once during 2013. We focus on waves 3 and 5 because the harvest of red snapper in federal waters was closed in the other waves of 2013. The 95% confidence intervals are also indicated for each nowcast. All models significantly underpredict the unprecedented cumulative harvest in May-Jun of 2013. The complete model with internet search volume comes closest and suggests a 17% probability of exceeding the quota in May-Jun of 2013. Note that due to the lag in recrea-tional reporting, managers were unaware that the quota had been greatly exceeded in May-Jun, and reopened a second shorter season in Sep-Oct (along with a slight and unrelated increase in the quota). The nowcasts of cumulative harvest in Sep-Oct of 2013 are all less than the actual cumulative harvest, but all models suggest that the quota is being exceeded in this wave with near certainty. However, the naive approach is problematic in this case because there was no harvest in the previous year as Sep-Oct in 2012 was closed to fishing in federal waters. There was only a small amount of harvest in state waters during Sep-Oct of 2012 to be added to the actual May-Jun harvest to predict the Sep-Oct cumulative harvest for 2013. The MAE of the
Table 4. Red Snapper Recreational Harvest Rolling Regression Results.
2012.2 2012.3 2013.2 2013.4
Intercept 1.355***(0.262) 1.295***(0.253) 1.366***(0.238) 1.680***(0.385)
Mar-Apr 0.180 (0.139) 0.229 (0.128) 0.129 (0.115) 0.047 (0.193)
May-June 1.152***(0.273) 1.284***(0.232) 1.026***(0.212) 0.932*(0.359)
Jul-Aug 0.913**(0.326) 1.075***(0.274) 0.829**(0.260) 0.828*(0.405)
Sep-Oct 0.115 (0.215) 0.186 (0.201) -0.010 (0.187) 0.127 (0.285)
Nov-Dec 0.047 (0.123) 0.038 (0.122) 0.015 (0.115) 0.132 (0.195)
Harvest(t-1) -0.021 (0.089) -0.031 (0.088) 0.001 (0.086) -0.157 (0.106)
Harvest(t-6) 0.059 (0.141) -0.031 (0.102) 0.078 (0.095) 0.177 (0.153)
Deepwater Horizon -1.362***(0.249) -1.233***(0.205) -1.377***(0.201) -1.639***(0.338) Days Closed in Wave -0.023***(0.005) -0.022***(0.005) -0.022***(0.004) -0.027***(0.007)
Search in 1st Month in Wave 0.144 (0.418) 0.025 (0.397) 0.223 (0.370) -0.102 (0.617)
Search in 2nd Month in Wave 0.892**(0.298) 0.912**(0.297) 0.733*(0.286) 1.531**(0.460) Search in 1st Month x Days Closed -0.000 (0.009) 0.001 (0.009) 0.001 (0.008) 0.007 (0.014) Search in 2nd Month x Days Closed -0.018*(0.007) -0.018*(0.007) -0.017*(0.007) -0.030**(0.011)
R2 0.944 0.950 0.947 0.920
Adj. R2 0.923 0.932 0.931 0.896
Num. obs. 50 51 56 58
RMSE 0.214 0.213 0.218 0.372
***p<0.001,
**p<0.01,
*p<0.05.
nowcast for waves 3 and 5 of 2013 with the naive approach, the model without search volume, and the model with search volume is 3.35, 3.27, and 2.38, respectively. For 2013 models with and without the internet search volume nowcast May-Jun and Sep-Oct harvest better than the naive approach. Indeed, the model with internet search volume nowcasts 27% better than the model without internet search volume and 29% better than the naive prediction.
The MAE of the nowcasts over the four periods considered in 2012 and 2013 is 1.88, 2.14, and 1.48, respectively, for the naive approach, the model without search volume, and the model with search volume. The model with internet search volume performs best, followed by the naive approach and then closely by the model without internet search volume. Overall, the
Fig 4. Nowcasts vs. Actual Cumulative Harvest for May-Jun and Jul-Aug of 2012.
model with internet search volume nowcasts 31% better than the model without internet search volume and 22% better than the naive prediction.
Discussion
Fisheries in the United States are managed with hard caps on harvest for any given year. Stay-ing under the cap throughout the year can be difficult, especially for recreational fishStay-ing where preliminary harvest estimates are usually unavailable until more than a month after the moni-toring period is completed. This can be long after the season ends. We examined the potential for using nowcasting with internet search information to generate predictions of the recrea-tional harvest before official estimates are available. The Gulf of Mexico recrearecrea-tional red
Fig 5. Nowcasts vs. Actual Cumulative Harvest for May-Jun and Sep-Oct of 2013.
snapper fishery has been managed for over ten years using effort-based controls such as bag limits and seasonal closures. During this time, the bag limit has been cut in half, and the season been reduced from nearly 200 days to less than 20 days. Despite these measures, harvest has exceeded the allowable catch in recent years, and the lag in reporting harvest estimates is a sig-nificant impediment to successfully managing the fishery.
Estimates of the recreational harvest of red snapper in the Gulf of Mexico are generated in bi-monthly waves and preliminary estimates are available around 45 days after the completion of each wave. Harvest estimates from the same wave in the previous year are a simple, intuitive proxy for the estimate of harvest in the wave just completed. This“naive”approach works well when fishery conditions (seasons, angler effort, and catch rates) are relatively stable. Indeed, the naive approach produced the best nowcasts for the open waves of 2012 when the season was similar to the previous year. However, we show that the naive approach can be problematic when current fishery conditions are considerably different than conditions during the previous year. For instance, a harvest prediction for the current period will not be available if the same period was closed to fishing during the previous year. In these cases, a more flexible modeling approach can be helpful.
Our results support a more flexible modeling approach for nowcasting harvest during 2013 when harvest levels were unprecedented due to changes in seasons, angler effort, and average fish size. A regression model using internet search information generates nowcasts that are nearly 30% better than the naive prediction and the the model without search information. This result is consistent with improvements in nowcasts with internet search information found in other (non-fishery) applications [6]. In general, the use of internet search information always improved the fit of our harvest regressions and increased the accuracy of the nowcasts. This sug-gests that there might be an underlying behavioral link between harvest levels and internet search volume (See Figs2and3). More research is necessary to determine if correlation between harvest levels and internet search volume persists in other fisheries and different resource man-agement situations. Researchers much be careful to separate behaviorally-relevant search terms from spuriously correlated terms [19,20]. Survey or interview research might also help under-stand the nature of the behavioral link, if any, between internet search and harvest.
The regression modelling approach we propose is also useful because it makes uncertainty explicit. In the face of missing or delayed information on current harvest, fishery managers need to decide on the amount of overharvesting risk they are willing to tolerate. We show how our approach can be used to quantify this risk in terms of a probability of exceeding the quota. Understanding the risk of exceeding the harvest quota is very important when managers con-sider whether there is enough quota remaining to reopen the season for some period in the later part of the year as was done in the red snapper fishery during 2013. Due to data reporting delays in 2013, managers were not aware that the quota had already been exceeded by a consid-erable margin during the summer season. Our nowcasting model with internet search informa-tion would have predicted a nearly 20% probability that the quota had been exceeded during the summer season of 2013. Fishery managers could have considered this information when deciding to reopen the fishery in the fall of 2013. Staying within quotas has become more important recently for U.S. recreational fisheries where accountability measures have been introduced that require overages in one year to be“repaid”in the following year with tighter regulations on harvest.
the point of the nowcast. In other cases, though, if the relationship between internet search activity and harvest is suspected to have changed significantly, then it may be necessary to drop some of the data from early years when re-estimating the model.
There are several ways the nowcasting approach presented in this paper could be extended. First, as already noted, it would be useful to see if the harvest nowcasting improvements we found with internet search volume hold for other fisheries or other natural resource manage-ment situations. Second, the regression model used to predict harvest could include the inter-net search volume measured at different times during each two-month period. Google Trends provides weekly estimates of search volume which gives eight potential estimates that could be used in our model of bi-monthly harvest. Lastly, the regression approach could potentially be improved with other timely indicators of harvest behavior. This could include the volume of other internet search terms or multiple search terms combined in an index of sportfishing interest. In addition, the early work using social media activity to nowcast economic phenom-ena is promising [21]. There has been some work in fisheries using a small scale social network to understand the distribution of fishing effort [22]. It is worth exploring whether information on social media volume for terms related to recreational fishing regulations and activity can be used to improve models used to nowcast harvest activity. As a final note, we caution that now-casting cannot replace traditional data collection methods in providing scientifically valid esti-mates of harvest. Nowcasting can provide useful information in some cases until existing data collection methods are able to provide more timely harvest estimates.
Author Contributions
Analyzed the data: DWC. Contributed reagents/materials/analysis tools: DWC SC CL. Wrote the paper: DWC SC CL. Assembled data: DWC.
References
1. Crosson S. The impact of empowering scientific advisory committees to constrain catch limits in U.S. fisheries. Science and Public Policy. 2013; 40:261–273. doi:10.1093/scipol/scs104
2. Methot RD, Tromble GR, Lambert DM, Greene KE. Implementing a science-based system for prevent-ing overfishprevent-ing and guidprevent-ing sustainable fisheries in the United States. ICES Journal of Marine Science. 2014; 71:183–194. doi:10.1093/icesjms/fst119
3. Hyndman R, Athanasopoulos G. Forecasting: Principles and practice. Heathmont, Vic: OTexts; 2014.
4. Fondeur Y, Karam F. Can Google data help predict French youth unemployment? Economic Modelling. 2013; 30:117–125. doi:10.1016/j.econmod.2012.07.017
5. Choi H, Varian H. Predicting the present with Google trends. Economic Record. 2012; 88:2–9. doi:10. 1111/j.1475-4932.2012.00809.x
6. Chen T, So EPK, Wu L, Yan IKM. The 2007–2008 U.S. recession: What did the real-time Google trends data tell the United States? Contemporary Economic Policy. 2014; 33:395–403. doi:10.1111/coep. 12074
7. Goel S, Hofman JM, Lahaie S, Pennock DM, Watts DJ. Predicting consumer behavior with Web search. Proceedings of the National Academy of Sciences. 2010 Oct; 107:17486–17490. doi:10.1073/pnas. 1005962107
8. Wu L, Brynjolfsson E. The Future of Prediction: How Google Searches Foreshadow Housing Prices and Sales. National Bureau of Economic Research; 2014.
9. Bordino I, Battiston S, Caldarelli G, Cristelli M, Ukkonen A, Weber I. Web Search Queries Can Predict Stock Market Volumes. PLoS ONE. 2012; 7:e40014. doi:10.1371/journal.pone.0040014PMID:
22829871
10. Farmer NA, Froeschke JT. Forecasting for recreational fisheries management: What’s the catch? North American Journal of Fisheries Management. 2015; 34:720–735. doi:10.1080/02755947.2015. 1044628
12. Southeast Regional Office (SERO). Estimated 2013 Season Lengths for a Fall Reopening of the Gulf of Mexico Red Snapper Recreational Season. St. Petersburg, FL: NOAA Fisheries Service; 2013. SERO-LAPP-2013-05.
13. Mohebbi M, Vanderkam D, Kodysh J, Schonberger R, Choi H, Kumar S. Google correlate whitepaper. Google, Inc.; 2011. Available from:http://www.google.com/trends/correlate/whitepaper.pdf.
14. Canova F, Hansen BE. Are seasonal patterns constant over time? A test for seasonal stability. Journal of Business & Economic Statistics. 1995; 13:237–252. doi:10.2307/1392184
15. Lazer D, Kennedy R, King G, Vespignani A. The Parable of Google Flu: Traps in Big Data Analysis. Sci-ence. 2014; 343:1203–1205. doi:10.1126/science.1248506PMID:24626916
16. Ormerod P, Nyman R, Bentley R. Nowcasting economic and social data: When and why search engine data fails, an illustration using Google Flu Trends. ArXiv e-prints. 2014;
17. Hyndman RJ, Khandakar Y. Automatic Time Series Forecasting: The forecast Package for R. Journal of Statistical Software. 2008; 27:1–22.
18. Hyndman RJ, Koehler AB. Another look at measures of forecast accuracy. International Journal of Forecasting. 2006; 22:679–688. doi:10.1016/j.ijforecast.2006.03.001
19. Martin DR, Pracheil BM, DeBoer JA, Wilde GR, Pope KL. Using the Internet to understand angler behavior in the information age. Fisheries. 2012; 37: 458–463. doi:10.1080/03632415.2012.722875
20. Wilde GR and Pope KL. Worldwide trends in fishing interest indicated by internet search volume. Fish-eries Management and Ecology. 2013; 20: 211–222. doi:10.1111/fme.12009
21. Antenucci D, Cafarella M, Levenstein M, Re C, Shapiro MD. Using Social Media to Measure Labor Mar-ket Flows. National Bureau of Economic Research; 2014. 20010.