Effect of transit gas pipeline temperature on the
production potential of agricultural soils
Vplyv teploty tranzitného plynovodu na produk
č
ný
potenciál po
ľ
nohospodárskych pôd
Daniela HALMOVÁ* and Alexander FEHÉR
Slovak University of Agriculture in Nitra, Faculty of European Studies and Regional Development, Department of Sustainable Development, Mariánska 10, 949 01 Nitra, Slovakia, *correspondence [email protected]
Abstract
The aim of our study was to investigate the temperature effects of a transit gas pipeline on soil and harvested crop over the years 2004 – 2006. The study area was
located in the village Veľký Cetín (Nitra District, South-Western Slovakia) soil type is
Mollic Fluvisols calcaric. The temperature of the transported gas increased the soil temperature in the range of 1.1 to 1.75 °C (average ) above the gas lines. It also reduced soil moisture by 0.07 – 2.67 weight per cent (average). The wheat yields above the gas pipelines decreased by 3.63 % in 2004 and by 9.53 % in 2006. Yield of barley also decreased by 13.88 % in 2005.
Keywords: gas pipeline, soil temperature, soil moisture, yield of wheat, yield of
barley
Abstrakt
Cieľom práce bolo zistiť vplyv teploty tranzitného plynovodu na pôdu a úrody
niektorých plodín v priebehu rokov 2004 – 2006. Výskumná plocha sa nachádza v
obci Veľký Cetín na pôdnom type čiernica karbonátová. Vplyvom teploty
prepravovaného plynu sa zvýšila teplota pôdy nad plynovodom v priemere o 1,1 až
1,75 °C a zároveň sa znížila pôdna vlhkosť v priemere o 0,07 – 2,67 hmotnostných
percent. Úrody pšenice nad plynovodom boli nižšie o 3,63 %, v roku 2004 a 9,53 %
v roku 2006, pri jačmeni v roku 2005 tiež došlo k zníženiu o 13,88 %.
Kľúčové slová: plynovod, teplota pôdy, vlhkosť pôdy, úroda pšenice, úroda jačmeňa
Detailný abstrakt
Cieľom štúdie bolo zistiť vplyv teploty tranzitného plynovodu (TP) na pôdu a úrody
plodín, v priebehu rokov 2004-2006. Výskumná plocha sa nachádza v obci Veľký
umiestnené v dvoch variantoch nad štyrmi líniami tranzitného plynovodu (variant 1 – pôda narušená výstavbou plynovodu + dohnojená organickým hnojením; variant 2 – pôda narušená výstavbou plynovodu, nedohnojovaná, slúžil ako kontrolný variant
nad plynovodom) a výskumné políčka kontrolného variantu mimo plynovodu sa
nachádzali vo vzdialenosti 20 m od TP. V priebehu troch rokov sme sledovali porovnávali a štatisticky vyhodnotili vývoj teploty a vlhkosti pôdy nad tranzitným plynovodom a mimo neho a taktiež úrody pestovaných plodín jednotlivých variantov.
Naše výsledky možno zhrnúť nasledovne. Vplyvom teploty prepravovaného plynu sa
zvýšila teplota pôdy nad plynovodom v priemere o 1,1 až 1,75 °C a zároveň sa
znížila pôdna vlhkosť v priemere o 0,07 – 2,67 hmotnostných percent. Pri hodnotení
biomasy zelených rastlín sa výškové rozdiely pri pšenici pohybovali od 10-15 cm a pri
jačmeni od 5 – 10 cm. Tieto skutočnosti sa prejavili aj v hmotnosti zelenej biomasy
pestovaných rastlín. Úrody pšenice nad plynovodom boli nižšie o 3,63 %, v roku
2004 a 9,53 % v roku 2006, pri jačmeni v roku 2005 tiež došlo k zníženiu o 13,88 %.
Jednorazovo aplikované organické hnojenie (50 t*ha-1) sa prejavilo na výške úrody
pšenice nachádzajúcej sa na pôde nad tranzitným plynovodom. Úrody boli vyššie o 18,03 % v roku 2004 a v roku 2006 o 2,86 %.
Introduction
Landscape is an area where man performs all his activities. Since times when he emancipated from complete dependency on nature, man has changed its character according to his needs, and affects it positively and negatively depending on his activities that take place in nature. Each way of land-use has its own environmental impact, which does not occur only in the physical environment, but also in biotic processes of agricultural landscapes.
The agricultural landscape is a diverse and economically important component of the natural landscape. At present, it is seen as a multifunctional space exposed to
anthropogenic influence related to agriculture but also non-agricultural activity. In agro-ecosystems, activities related to ensuring basic living needs of the population (food) interfere with other economically strategic activities and/or their consequences. Man-built line networks (of any kind) are foreign elements in the landscape. They bring into the landscape not only new design parameters, but may also have external manifestations of expected and also unexpected effects on its elements and
simultaneously on its manifestations as a whole. Underground transit line networks radically interfere with the landscape during their construction which then gradually affect the landscape with different impacts. For example, Viciani and Moggi (1996) noticed loss of fifteen plants species on pasture lands ten years after construction of a gas pipeline. Also Schuchardt et al. (1999) pointed out changes in the composition of vegetation and number of animal species. Changes in a soil fauna of a spruce forrest caused by presence of gas pipeline was recorded by Romanenko, et al.
(1997). Temperature of the transported gas is an important factor that may also affect
the production potential of arable crops.
Materials and Methods
The experiment was carried out on a field stripe in Pilišky, farmed by the agricultural
Fluvisols calcaric, sandy-clay-loam. Disruption of soil cover caused by construction of gas transit pipeline was characterized in form of Urbi-Anthropis Regosols directly above the pipeline branches, and in their close proximity. High gravel content in the form of a homogeneous mixture was observed in the whole soil profile (Skalský, et al., 2002).
Plots with size of 150x300 cm were staked above four lines of the transit pipeline for two options:
• Option 1 – soil disturbed by pipeline construction was fertilized with
compost-based organic fertilizer – Vitahum (200 g of Vitahum was dried for eight hours, weight of dry mass was 80,4 g and content of nutrition was: 1.9 % N, 0.5 % P, 0.9 % K) as a growing medium in a dose of 22.5 kg which was used as a single application on the experimental plot during the establishment of the experiment,
• Option 2 – soil disturbed by pipeline construction was not fertilized – served as
the Control Option above the pipeline.
Individual treatments were separated by a 2 m wide stripe of land.
• Option 3 – soil undisturbed by pipeline construction was not fertilized – served
as the Control Option at a distance of 20 m from the gas lines. Soil temperature was measured at a depth of 250 – 350 mm using a digital
thermometer Testo 906 above each gas line and further from the line. Afterwards, we calculated the arithmetic average of the measured values.
The soil samples taken for a determination of moisture content were collected while measuring temperature of soil from a depth of 250 – 350 mm, using a soil probe from three spots above each pipeline and outside of the pipeline. Soil moisture was
calculated by gravimetric method – percentage by weight (Houšková, 1999). The collected soil samples were put into aluminium desiccants, which were weighed, put opened to the dryer and dried at 105 °C for eight h ours. Dried soil samples were weighed again and then was calculated soil moisture in weight percentage. Then, we calculated average values using arithmetic average of the moisture values.
Green biomass of seven plants was collected from each option above each gas pipeline and also further from the pipeline (28 p lants per pipeline). Plants were weighed after they were collected from the vegetation stand and then after drying as well. Then, we calculated the difference in fresh weight and dry weight of the plants. The data obtained were used to compare the difference in weight of plants grown above the pipeline and further from the pipeline.
Yield of wheat and barley were harvested and evaluated from a square meter, in three replications from each plot above each pipeline and further from the pipeline. Plants removed from each square meter were firstly counted. Spikelets and straw were weighed separately and threshed out the spikelets using a thresher. After grain cleaning, we calculated the yield and determinate the thousand-grain-weight (TGW). We made arithmetic averages from calculated and weighed values.
We used a method of testing statistical hypotheses for processing differences among the options, since this method gives us tests of contrasts by unpaired t-tests. The
Objective
• to find out how an increased temperature of the transported gas affects the
soil temperature, soil moisture and yield of the harvested crops,
• to determine an impact of the intensifying factor (organic fertilizer) on the yield
of the crops above the pipelines.
Results and Discussion
The average temperature of natural gas at the inlet to the gas compressor station ranged from 16.1 to 29.4 °C in 2004, from 14.5 to 2 4.9 °C in 2005 and from 10.0 to 23.5 °C in 2006 (SPP, 2004 – 2006).
Trend of temperature and humidity
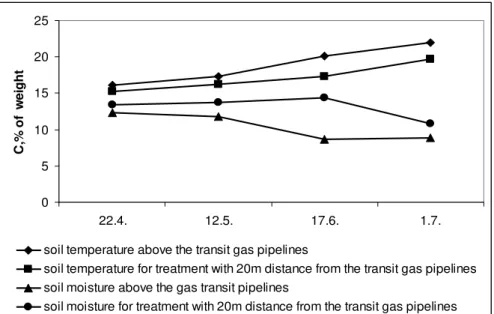
From the observed trend of the average temperature and soil moisture during the years 2004 – 2006 (Fig.1 – 3), may be concluded that the soil temperature above the pipelines was always higher than further from the lines. The difference was
influenced mainly by the temperature of the transported gas. This fact also affected
the soil moisture above the pipeline (cf. Širáň, 2003). The lowest significance in
correlation of these factors were recorded in 2004, when the soil temperature above the pipeline was on average by 1.1 °C higher and so il humidity was on average by 0.07 wt% lower than further from the pipeline. The highest significance in correlation of these factors was observed in 2006, when the soil temperature was on average by 1.75 °C higher then further from the pipeline, w hich was a statistically significant
difference (P = 0.0283 < α = 0.05) and the soil moisture was about 2,67 wt% lower,
which was a statistically high significant difference (P = 0.0018 <α = 0.01). Blaško
(2005) indicated differences in temperature (average values) measured above the gas pipelines and further from the pipeline at a depth of 0.30 m in front of KS4 at site
Branč from 1.2 to 1.8 °C and lower soil moisture above t he pipeline in the range of
2.2 – 2.6 wt %. Given the above, we can state that the development of correlations between the average soil temperature and soil moisture corresponds with other authors (Al-Kayssi, et al., 1990, Bingcheng, 2006, Penuelas et al., 2007 Krakauer, et al., 2010).
0 5 10 15 20 25
29.4. 5.5. 15.6. 30.6.
°C
,
%
o
f
w
e
ig
h
t
soil temperature above the transit gas pipelines
soil temperature for treatment with 20m distance from the transit gas pipelines soil moisture above the gas transit pipelines
Figure 1. Trend of the average soil temperature and soil moisture in Veľký Cetín
during 2004
Obrázok 1. Vývoj priemernej teploty a vlhkosti pôdy, Veľký Cetín, 2004
0 5 10 15 20 25
29.4. 24.5. 15.6. 30.6.
°C
,
%
o
f
w
e
ig
h
t
soil temperature above the transit gas pipelines
soil temperature for treatment with 20m distance from the transit gas pipelines soil moisture above the gas transit pipelines
soil moisture for treatment with 20m distance from the transit gas pipelines
Figure 2. Trend of the average soil temperature and soil moisture in Veľký Cetín
during 2005
Obrázok 2. Vývoj priemernej teploty a vlhkosti pôdy, Veľký Cetín 2005
0 5 10 15 20 25
22.4. 12.5. 17.6. 1.7.
C
,%
o
f
w
e
ig
h
t
soil temperature above the transit gas pipelines
soil temperature for treatment with 20m distance from the transit gas pipelines soil moisture above the gas transit pipelines
soil moisture for treatment with 20m distance from the transit gas pipelines
Figure 3. Trend of the average soil temperature and soil moisture in Veľký Cetín
during 2006
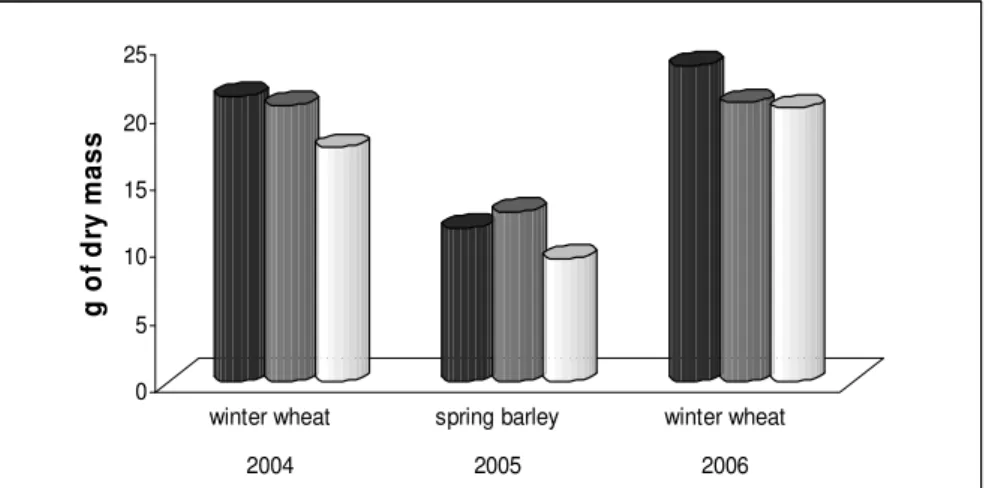
Biomass of green plants
The increased temperature and sufficient soil humidity caused, that from the beginning of the growing period, the vegetation stand above the gas lines was
always higher than the stand further from the pipeline. Differences in height for wheat ranged between 10 – 15 cm and 5 – 10 cm for barley (observed in the last decade of May) (Halmová, 2009). This fact was also reflected on the weight of biomass
collected from the stand (Figure 4).
0 5 10 15 20 25
g
o
f
d
ry
m
a
s
s
winter wheat spring barley winter wheat
2004 2005 2006
soil disturbed by the construction of the transit gas pipeline – fertilized by organic fertilizer soil disturbed by the construction of the transit gas pipeline – non-fertilized = Control Option soil intact by the construction of the transit gas pipeline – Control Option further from the pipeline
Figure 4. Comparison of the average weight of plant dry biomass in Veľký Cetín
2004-2006
Obrázok 4. Porovnanie priemerných hmotností suchej biomasy rastlín in Veľký Cetín
2004-2006
Differences among plant weights (winter wheat) in 2004 were about 3.51 % higher in favour of Option 1 (soil disturbed by transit pipeline construction – fertilized by
organic fertilizer) compared with Option 2 (soil disturbed by transit pipeline
construction – non-fertilized). When we compare the weight of plants in Option 2 and 3 (soil intact by transit pipeline construction, fertilized), then the pipeline in non-fertilized Option (2) was about 17.99 % higher, than it was further from the pipeline. As for the spring barley in 2005, we recorded 10.31 % higher plant weight in Option 2 compared to Option 1. When both non-fertilized Options wre compared, plant weight above the pipeline was about 37.22 % higher than further from the pipeline. In 2006 (winter wheat), the weight of the plants was higher by 13. 51% in the Option 1 (soil disturbed by transit pipeline construction, fertilized by organic fertilizer) compared with the Option 2 (soil disturbed by transit pipeline construction, non-fertilized). By comparing the options 2 and 3, we found out a difference of 1.97 % in favour of non-fertilized option above the pipeline.
Yields
(organic fertilizer, Option 1) was obvious in wheat, but we found out, comparing non-fertilized Options (2 and 3), that yields achieved above the pipeline were lower (TGW was also lower) than yields further from the pipeline (Fig. 5).
0 1 2 3 4 5 6 7 8
t.
h
a
-1
winter wheat spring barley winter wheat
2004 2005 2006
soil disturbed by the transit gas pipeline construction, fertilized by organic fertilizer soil disturbed by the construction of the transit gas pipeline – non-fertilized = Control Option soil intact by the construction of the transit gas pipeline – Control Option further from the pipeline
Figure 5. Crop yields trend, Veľký Cetín 2004-2006
Obrázok 5. Vývoj úrod, Veľký Cetín 2004-2006
In 2004, the yield of the winter wheat was by 18.03 % higher in Option 1 than in Option 2. This difference was statistically highly significant (P = 0.0076 <α = 0.01).
It means that the organic fertilizer significantly affected crop yields in the research year. When comparing non-fertilized Options (2 and 3), the yield above the pipeline was by 3.63 % lower than the yield further from the pipeline.
In 2005, the yield of the spring barley was by 4.72 % lower in Option 1 than in Option 2. When comparing non-fertilized Options, the yield above the pipeline was lower by 13.88 % than the yield further from the pipeline, which is a statistically high significant difference (P = 0.0037 <α = 0.01).
In 2006, the yield of the winter wheat was by 2.86 % higher in Option 1 than in Option 2. Comparing non-fertilized Options, we found out, similarly to the previous two
years, a reduction in yields above the pipeline. In this particular year, the yield
reduction represented 9.53 %, compared to the yield further from the pipeline, which is a statistically significant difference (P = 0.0291 <α = 0.05).
2006 (Šiška, Čimo, 2006; Šiška, Čimo, 2007). Fisher, et al. (2000) indicate that in
rare cases the gas pipeline causes a cooling of the soil and hence an increase of yields during a growing season. In the U.S., up to 50 % increase in yields of alfalfa was locally found.
Conclusions
We can conclude from the results obtained that:
• The increased temperature of the transported gas caused an increase in soil
temperature above the transit pipeline (statistically significant difference was recorded in 2006), and a reduction in the soil moisture (statistically highly significant difference was recorded in 2006).
• The above-mentioned facts were reflected on the weight of the biomass but
also on the yield of the crops as follows: while the weight of the biomass above the transit pipeline was always higher than further from the pipeline, the yields were lower, whereas we observed statistically high significant difference for barley in 2005 and also for wheat in 2006. The yield of the crops grown above the pipeline was lower than in the treatment with 20 m distance from the
pipeline.The important factor in this regard, in relation to increased
temperature, is considered to be also the soil of high skeletal content (as a consequence of the soil cover disturbance when placing the pipelines into the soil), where a rapid runoff of fallen precipitations is likely to occur.
• The effect of the intensifying factor (organic fertilizer) was shown in wheat,
particularly in the first experimental year, when we noticed a statistically significant difference in favour of Option 1, compared with wheat in Option 2 – soil disturbed by transit pipeline, non-fertilized.
References
Al-Kayssi, A.W., Al-Karaghoulia, A.A., Hassona, A.M., Bekera, S.A. (1990) Influence of soil moisture content on soil temperature and heat storage under
greenhouse conditions. Journal of Agricultural Engineering Research, 45(4), 241-252.
Bingcheng, L., Wei, L., Qinglling, L. (2006) Experimental studies on the influences of temperature of moisture transport in saturated porous soil. Huazhong University of Science and Technology, 30(4), 106-108.
Blaško, P. (2005) Vplyv tranzitného plynovodného systému na produkčný potenciál
pôdy a úrody vybraných druhov plodín. Doktorandská dizertačná práca.
Nitra: SPU.
Čimo, J. (2007) Klimatická charakteristika roku 2006. Poskytnuté Katedrou
biometeorológie a hydrológie FZKI, SPU v Nitre.
Fisher, D. A., FisheR, D. F., Fisher, D. P. (2000) Gas pipelines: are they a detriment or an enhancement for crops? Journal of the American Society of Farm Managers and Rural Appraisers, 63(1), 68-71.
Halmová, D. (2009) Vplyv tranzitného plynovodu na vybrané vlastnosti a parametre
Houšková, B. (1999) Metódy stanovenia ukazovateľov agrochemických vlastností
pôdy. In: Fiala a kol. Záväzné metódy rozborov pôd. Čiastkový monitorovací
systém – Pôda. Bratislava : VÚPOP.
Krakauer, N. Y., Cook, B. I., Puma, M. J. (2010) Contribution of soil moisture
feedback to hydroclimatic variability. Hydrology and Earth System Sciences 14(3), 505-520.
Penuelas, J. et al. (2007. Response of plant species richness and primary
productivity in shrublands along a north-south gradient in Europe to seven years of experimental warming and drought: reductions in primary
productivity in the heat and drought year of 2003. Global Changes Biology, 13(12), 2563-2581.
Romanenko, E. N., Geľtzer, J. G., Romanenko, N. D. (1997) The effect of soil
disturbance in a spruce forest on the abundance of nematode trophic groups. Russian Journal of Nematology, 5(2), 97-101.
Schuchardt, B. et al. (1999) Effects on the soil functions from the laying of a gas pipeline. Analysis of vegetation, earthworms and ground beetles in Marshland. Berlin: Naturschutz- und Landschaftsplanung.
Skalský, R., Halas, J., Madaras, M. (2002) Zistenie vplyvu prevádzkových potrubí
tranzitnej sústavy SPP a. s. DSTG na pôdu úrodnosť vybraných druhov
poľnohospodárskych plodín. Priebežná správa z riešenia za rok 2002.
Bratislava: VÚPOP..
SPP a. s., (2004 – 2006) Priemerné mesačné teploty transportovaného plynu v °C
v roku 2004 – 2006, na vstupe a výstupe kompresorových staníc. Nitra, dep. in SPP a. s.
Širáň, M. (2003) Teplota pôdy vo vegetačnom období vo vzťahu k jej vlhkosti.
Pedologické dny 2003 [Online]. Available at: http://www. pedologie.cz /cz/left/ dokumenty.htm [Accessed 20 September 2013].
Šiška, B., Čimo, J. (2006) Klimatická charakteristika rokov 2004 a 2005 v Nitre. Nitra:
SPU49 s . ISBN 80-8069-761-2