Determinantes da mortalidade
neonatal e pós-neonatal no
Município de São Paulo*
Determinants of neonatal and
post-neonatal mortality in the City of São
Paulo
Carla Jorge Machado
Doctor of PhilosophyJohns Hopkins Bloomberg School of Public Health
Johns Hopkins University
Departamento de Demografia
Centro de Desenvolvimento e Planejamento Regional (CEDEPLAR)
Universidade Federal de Minas Gerais (UFMG)
Av. Augusto de Lima 1376/sl. 908 CEP 30190-003 - Belo Horizonte, MG [email protected]
Kenneth Hill
Doctor of Philosophy London School of EconomicsDepartament of Population and Family Health Sciences
Bloomberg School of Public Health
* Fontes de Auxílio na Forma de Bolsa: Bolsa de Doutorado Pleno – CAPES (durante o período de elaboração do primeiro manuscrito) – Processo nº 2166/97-6.
Resumo
Introdução: Introdução: Introdução: Introdução:
Introdução: Nos países em desenvolvimen-to, nos anos 90, a mortalidade na infância (de menores de cinco anos) apresentou declínio proporcional maior do que o da mortalidade infantil. Para a redução da mor-talidade na infância, deve-se entender, logo, os determinantes da mortalidade infantil. Material e Métodos:
Material e Métodos: Material e Métodos: Material e Métodos:
Material e Métodos: Relacionou-se proba-bilisticamente dados do SIM e do SINASC: 209628 nascidos vivos e 3842 óbitos infantis do Município de São Paulo, coorte de 1998. Utilizou-se regressão logística para analisar fatores de risco da mortalidade neonatal e pós-neonatal: peso ao nascer, idade gesta-cional, escores Apgar ao primeiro e quinto minuto, tipo de parto, pluralidade, sexo, edu-cação e idade da mãe, número de perdas anteriores, número de consultas pré-natal, raça, parturição e desenvolvimento da co-munidade. Resultados e Conclusões:Resultados e Conclusões:Resultados e Conclusões:Resultados e Conclusões: Fi-Resultados e Conclusões: lhos de mães mais velhas apresentaram me-nor risco de morte neonatal, e, de mães ado-lescentes, maior risco de morte na infância. Associação significativa foi encontrada en-tre parturição acima de três e morte pós-neonatal. Não houve associação de parto cesáreo e mortalidade infantil. Houve asso-ciação entre morte neonatal e número bai-xo de visitas pré-natal, baibai-xo peso ao nascer, nascimento de pré-termo e escores Apgar baixos; e entre morte pós-neonatal e núme-ro baixo de visitas pré-natal, baixo peso ao nascer, e escores Apgar baixos. A associação de residência da mãe numa comunidade mais desenvolvida e sobrevivência infantil sugere que fatores não controlados estão por trás deste resultado.
Palavras-chave: Palavras-chave: Palavras-chave: Palavras-chave:
Introduction
Determinants of infant and child mor-tality have been extensively studied in de-mographic and epidemiological research and an important conclusion is that in the 1990s there was a continued decrease in mortality among infants and children in most of the developing world1. This sustained
decline is mostly a result of child survival interventions, such as immunization and oral
rehydration2. The average decline in child
mortality in the 1990s was estimated to be most pronounced in ages 2 to 4 (10.5% de-crease), and for children aged one year (4% decrease). Neonatal and post-neonatal mor-tality rates declined less, 3.0% and 2.5%
de-crease, respectively1, and as a consequence
there is an increasing proportion of infant deaths occurring in the neonatal period, which now accounts, worldwide, for two thirds of deaths in children less than one year old, and nearly four-tenths of all deaths in children less than five years of age3.
There-fore, to further reduce child mortality, fac-tors associated with infant mortality, which experienced the slowest pace of decline, must be addressed.
In this article we study determinants de-scribed in the literature as most likely to ex-ert an effect on infant survival, provided that they were available in our data. Thus, we analyzed proximate determinants of neona-tal and post-neonaneona-tal morneona-tality (sex, plural-ity, mode of delivery, prior losses, Apgar scores at one and at five minutes, gestational age, prenatal care and birth weight), less proximate determinants (parity and mater-nal age) and distal determinants (race, ma-ternal education and community develop-ment) for the 1998-birth cohort, City of São Paulo. Apgar scores, birth weight and gesta-tional age are highly correlated with infant survival and in combination are a measure of the newborn’s well-being, success of re-suscitative efforts, newborn’s size, and ma-turity4. Twins or higher order births account
for a disproportionate large percent of dead infants in all populations5; male infants are
known to be more likely to die in the first
Abstract
Introduction: Introduction: Introduction: Introduction:
Introduction: Child Mortality (mortality of children less than five years) has declined considerably in the developing world in the 1990s, but the Infant Mortality has declined less. Therefore, to further reduce child mortality it is important to understand the determinants of neonatal and post-neonatal mortality. Material and Methods:Material and Methods:Material and Methods:Material and Methods:Material and Methods: We probabilistically matched 209628 live births and 3842 infant death records from the City of São Paulo, birth cohort of 1998. Data came from SINASC and SIM. We then used logistic regression to analyze the following risk factors of neonatal and post-neonatal mortality: birth weight, gestational age, Apgar scores at 1 and 5 minutes, delivery mode, plurality, sex, maternal education, maternal age, number of prior losses, prenatal care, race, parity and community development. Results and Conclusion:
Results and Conclusion: Results and Conclusion: Results and Conclusion:
Results and Conclusion: Infants of older mothers were less likely to die in the neonatal period; infants of adolescent mothers were more likely to die in both periods. Parities four or higher increased the likelihood of post-neonatal death. Cesarean delivery was not found to be associated with infant mortality. Low number of prenatal care visits, low birth weight, preterm birth and low Apgar scores were associated with neonatal death; Low number of prenatal care visits, low birth weight, and low Apgar scores were associated with post-neonatal death. Finally, having a mother live in a highest developed community decreased the likelihood of infant death, suggesting that unmeasured factors are behind such association.
Key words: Key words: Key words: Key words:
year of life6. The association between mode
of delivery and infant survival is
controver-sial though, as a review7 shows. A mother
with a higher number of prior losses is also considered to bear infants with higher risks of death, probably due to higher risks of
malformation8 and mothers with higher
number of prenatal care visits are more likely to bear children with lower risks of death in infancy and it has been suggested that the effect is more pronounced in developing than in developed countries9. Race is another
variable that has to be considered in the analysis, since black infants usually experi-ence much worse health status compared to
whites10. Maternal education may lower
in-fant mortality since educated mothers are less likely to accept fatalist explanations and are more likely to manipulate modern
medi-cal systems than less educated mothers11.
Also, maternal education may be seen, at least partially, as a surrogate for household in-come, which negatively affects infant death. Higher parities (four or higher previous live births) and nulliparities are considered to exert an extra risk for birth outcomes and they are likely to reflect deviance from the normal uterine function. Also, high parity can be seen as a marker for low social status and
income which affects infant death12 and is
possibly capturing effects of closely spaced births known to be deleterious to infant sur-vival13. Regarding maternal age, various
so-cioeconomic disadvantages and suboptimal health outcomes are associated with adoles-cent pregnancy, such as insufficient educa-tion, limited career and job opportunities and
poor conditions for effective parenting14.
Women age 35 and older are also at higher risk for chromosomal abnormalities and other factors associated with higher risks of
infant mortality15. Finally, the community
where the mother resides may affect infant survival given it may influence attitudes and behavior. Some characteristics may influ-ence more directly birth outcomes, such as the availability of health services and envi-ronmental pollution16. In this article, which
is part of the one of the author’s doctoral dissertation submitted to The Johns Hopkins
University in 2002, our aim is to evaluate the importance of each of those factors on neonatal and post-neonatal mortality and compare and contrast the results.
Material and Methods
We used information from the SINASC (Information System on Live Births) and from SIM (Information System on Mortal-ity) from the 1998-birth cohort whose mother’s place of residence in 1998 was the City of São Paulo. We obtained the data on live births and also on infant deaths, assum-ing that the mother’s place of residence at the time of birth was the same place of resi-dence at the time of infants death; full expla-nation of results and methods are described in detail elsewhere7. In brief, we considered
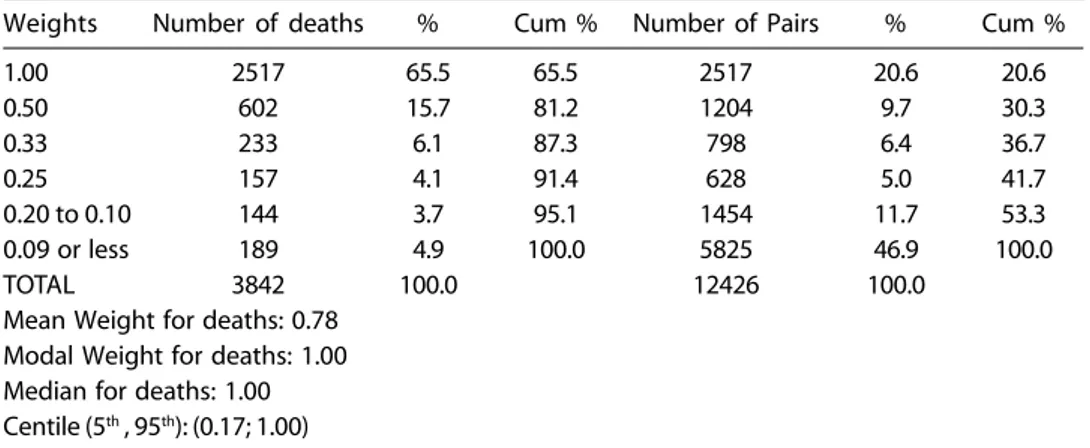
respec-tive birth record, the vast majority was matched to at least two birth records and received a weight of 1.0 or 0.5 (81%). When we merged the birth record file to the matched file, in order to obtain a combina-tion of all infants exposed to infant death, we gave the birth records that were not involved in any matched pair (presumably infants that did not die) a weight of 1.0 (197,408 birth records). For the analysis of matched data we used the STATA 6 software.
The coverage of events from SIM and SINASC in the State of São Paulo is consid-ered excellent, close to 100%. A comprehen-sive review of literature is elsewhere7.
Valid-ity and internal consistency of the data were
checked very throughout earlier work 7 and
data were considered of good quality on this matter. Consistency and validity were exam-ined with empirical regularities observed in other populations or with the criterion of plausibility 7.
Variable Constructs Variable Constructs Variable Constructs Variable Constructs Variable Constructs
The outcome variables are whether or not an infant died in the neonatal period, and whether or not an infant died in the post-neonatal period. We created an indicator variable of neonatal mortality (dying before 28 days of life) after merging the matched file and the birth record file. From this birth cohort of 209,628 infants, 2,581 infants died
in the neonatal period (12.3 per 1,000 live births). An indicator variable for post-neonatal mortality (from 28 days of life to eleven months) was also created, the refer-ence category being those who survived to 28 days. From 207,047 infants exposed to a post-neonatal death, 1,261 died within eleven months of life (6.1 per 1,000).
Explanatory variables were classified in proximate determinants (Apgar scores at one and at five minutes, birth weight, gesta-tional age, prenatal care, sex, plurality, prior losses and mode of delivery), less proximate determinants (parity and maternal age) and distal determinants (race, maternal educa-tion and community development). We clas-sified both Apgar scores in: below 7; 7 and 8; 9 and 10; and unknown. In earlier results7 we
observed that Apgar scores seemed biased towards high values and we hypothesized that infants considered healthy, are given Apgar scores 9 or 10 without much adher-ence to specific score components. Hadher-ence, an infant with an Apgar score of 7 or 8 may be perceived to be less healthy than an in-fant of Apgar 9 or 10. Inin-fants with Apgar scores of 7 or 8 may thus be at increased risk of dying in the neonatal or post-neonatal period. Birth weight was categorized into nine groups of 500 grams each (less than 1,000 g, 1,000 to 1,499 g, 1,500 to 1,999 g, 2,000 to 2,499 g; 2,500 to 2,999 g, 3,000 to 3,499 g, 3,500 to 3,999 g, 4,000 to 4,499 g, 4,500 g or higher,
Table 1 – Distribution of weights for matched pairs.
Tabela 1 – Distribuição de pesos para dados pareados
Weights Number of deaths % Cum % Number of Pairs % Cum %
1.00 2517 65.5 65.5 2517 20.6 20.6
0.50 602 15.7 81.2 1204 9.7 30.3
0.33 233 6.1 87.3 798 6.4 36.7
0.25 157 4.1 91.4 628 5.0 41.7
0.20 to 0.10 144 3.7 95.1 1454 11.7 53.3
0.09 or less 189 4.9 100.0 5825 46.9 100.0
TOTAL 3842 100.0 12426 100.0
Mean Weight for deaths: 0.78 Modal Weight for deaths: 1.00 Median for deaths: 1.00 Centile (5th , 95th): (0.17; 1.00)
and missing birth weight). Categories of ges-tational age were taken as ‘27 weeks or less’, ‘28 to 36 weeks’, ‘37 to 41 weeks’, and ‘42 weeks or more’ and missing. Infants were also categorized according to whether they were singleton births, non-singleton births or this category was missing. Infants were also classified based on whether the delivery was normal; a cesarean; other (primarily for-ceps); and for unknown mode of delivery. The number of prenatal-care visits was clas-sified based on the existing categories: no visits, 1 to 6 visits, 7 or more visits and un-known number of visits.
Finally, the number of stillbirths and abortions were considered together in a cat-egory called “prior losses” and we created four categories: no prior loss, one prior loss, more than one prior loss; and missing infor-mation on prior loss.
Maternal age was categorized into con-secutive five-year age groups from 15 up-wards, as it is done in most demographic research, and a first category of 11 to 14, to estimate the effect of very young maternal age on infant mortality. The last category was 40 and over; and finally an additional cat-egory for missing age. We categorized parity as zero parity; parity one; parity two or three; parity four or higher; and missing parity17.
In categorizing race, given that whites have historically been the most affluent group in Brazil, and because among the non-white, 97% are mixed race or black, we defined two categories: “white” and “non-white” and “missing” (67% of all infants). We classified maternal education in: illiterate; incomplete elementary education; complete elementary education; secondary school; college and an additional category for missing. Information at the community (or district) level exists for each of the 96 districts in the City of São Paulo. To capture community effects, we created an indicator variable of development for each district and used the method of principal components’ analysis to weight different dis-trict level indicators18, 19, 20. Principal
compo-nents’ analysis uses linear combinations of variables to explain sets of observations on many variables and simplify information
contained in a group of variables18, 19, 20. The
method applied here summarized the dis-trict-level information on 18 variables, in-cluding average educational attainment of the household head, average household in-come, average access to health services and other facilities, in each district, among oth-ers. The technique created a set of mutually uncorrelated components of the data. Intui-tively, the first principal component is the linear index that captures the most common
variation among the components obtained18.
We used STATA’s 6 factor command and specified the principal components’ option within the command.
All community indicator variables were based on the 1991 population census, 1996 population counts, and other district level information, such as the number of school enrollments and unmet need for services such as health care centers in each district. Most indicators are summarized in an index developed for each district called the “Index of Social Exclusion/Inclusion”21, 22. The
in-terpretation of each index is that the higher the value of the index, the higher the average degree of ‘social inclusion’ of its population into the society, i.e., the better off the popu-lation of the district is, in comparison to all other districts. Therefore, the interpretation is quite intuitive – the higher, the better. For some variables, though, we only had rates or
percentages or even absolute numbers21, 22.
The first principal component explained 43.2 percent of the variation in these 18 vari-ables, which is a substantial percentage. The first component serves as a reasonable over-all index 20. In our case, the first component
women’s autonomy. The higher the index, the better off is the district, in relation to one another. After the index was constructed, we sorted the infants by ‘district development’. The 40% who scored lowest were catego-rized as living in a ‘district with poor devel-opment’, the middle 40% as living in a ‘dis-trict with medium development’ and the high-est scoring 20% were categorized as living in a ‘ highly developed district’20.
Multivariate Analysis Multivariate Analysis Multivariate Analysis Multivariate Analysis Multivariate Analysis
The odds ratio is a key measure in many epidemiologic analyses and represents a ra-tio between the probability that an event occurs and the probability the event does not occur. It measures the relative magni-tude of two sets of odds occurring under differing conditions, and it varies from zero to infinity23. To obtain an adjusted odds
ra-tio, we used a multivariate logistic regres-sion in order to model the two dichotomous outcomes under study. Because character-istics of mothers and infants from the same community were related, we corrected the standard errors for lack of independence between observations using the Huber/ White correction, which assumes that ob-servations are independent across clusters but not within clusters (the community of mother’s residence at the time of birth) 24.
We used STATA 6 for the regression analysis and selected the cluster option within the logit command. This approach does not change the coefficients but takes into account the clustering in the covariance matrix.
By chance alone, the ratio between two odds can vary. Therefore, the p-value indi-cates the probability that the two sets of odds occurring under differing conditions are equal to one, adjusted by all other covariates. The significance of the Wald test of whether the odds ratio is equal to one is given in pa-renthesis in Table 3, next to the odds ratios23.
Whenever the p-values fell in between 0.10 and 0.19, the significance was considered marginal and is written in the text. Also, in Table 3, we present the 95% confidence in-tervals for the odds ratios.
Results
Before we show results from multivariate analysis, we present the distribution for in-fants who died in the first year of life, from the 1998 birth cohort, in Table 2. As a brief description, most infants had high Apgar scores, were males, singleton births, weighed between 3,000 and 3,500 grams at birth, were term, and were delivered vaginally (even though a very high percentage of infants, 46.2%, were delivered by cesarean section). Most infants who had race or color recorded were white, but 66.3% of the infants did not have this information recorded. Most women did not have any prior losses, had more than seven prenatal care visits (but the percentage is not overwhelming since 32.4% of women had less than 7 visits), delivered their first child, were in the age group 20 to 24 and had only incomplete elementary school. The educational level of these moth-ers may be considered low: even though 79.1% of all mothers were at least 20 years old, an age by which every person, theoreti-cally, could have finished secondary school, 37% of all mothers were illiterate or did not have an elementary school degree.
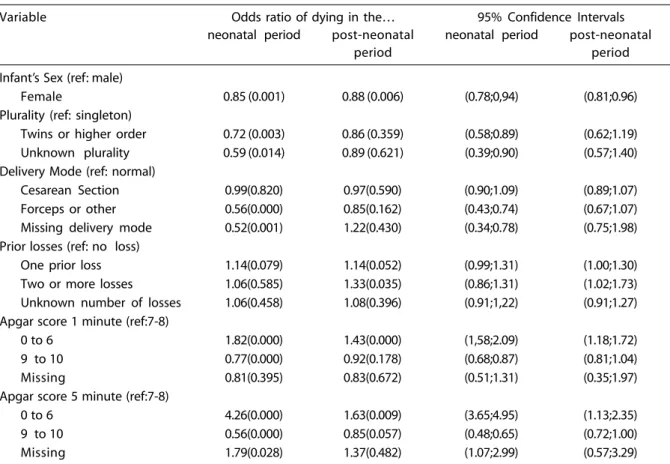
The results of the multivariate analysis are in Table 3.
As expected, female infants had a lower odds of dying in the neonatal and post-neonatal period, as compared to male in-fants (OR=0.85, p=0.001; OR= 0.88, p=0.006, respectively).
Non-singleton births had a significantly lower odds of death in the neonatal period, but not in the post-neonatal period (OR=0.72, p =0.003). This finding is consistent with the idea that after the neonatal period other fac-tors play a role in determining infant health and mortality outcomes. The relative advan-tage of a twin as compared to a same size singleton birth tends to disappear with age. It is important to remember that after con-trolling for birth weight and gestational age, twins or higher order births are expected to have a better survival. 25 Infants with no
pe-Table 2 – Univariate description of infants, exposed to infant mortality.
Tabela 2 – Descrição univariada de nascidos vivos, expostos à mortalidade infantil.
Variable Distribution (percentages) of infants
exposed to infant death
Infant’s Sex Male 50.9
Female 49.1
Missing 0.0
Plurality Singleton 96.6
Twins or higher order 1.9
Missing 1.5
Delivery Mode Normal 49.2
Cesarean 45.4
Other 3.9
Missing 1.5
Prior Losses None 57.5
One 9.4
Two or more 2.9
Missing 30.2
Apgar score at 1 minute 0 to 6 7.6
7 and 8 49.9
9 and 10 38.0
Missing 4.5
Apgar score at 5 minutes 0 to 6 1.2
7 and 8 8.7
9 and 10 85.8
Missing 4.3
Weeks’ Gestation 27 weeks or less 0.5
28 to 36 weeks 5.2
37 to 41 weeks 87.4
42 weeks or more 1.1
Missing 5.8
Prenatal Visits None 2.1
1 to 6 visits 29.9
7 visits or more 34.9
Missing 33.1
Birth Weight 999 g or less 0.4
1000 to 1499 grams 0.8
1500 to 1999 grams 1.6
2000 to 2499 grams 6.0
2500 to 2999 grams 24.6
3000 to 3499 grams 41.2
3500 to 3999 grams 20.1
4000 to 4499 grams 3.7
4500 grams or higher 0.5
Missing 1.1
Parity None 35.2
One 24.6
Two or three 16.7
Four or more 4.1
Missing 19.4
Maternal Age 11 to 14 0.5
15 to 19 16.6
20 to 24 28.5
25 to 29 25.7
30 to 34 18.2
35 to 39 8.0
40 or higher 2.0
Table 3 – Adjusted odds ratios for neonatal and post-neonatal mortality, p-values (in parenthesis) and 95%
confidence intervals for the odds ratios.
Tabela 3 – Razões das chances para mortalidade neonatal e pós-neonatal, valores de p (entre parênteses) e intervalos de confiança
de 95% para as razões das chances.
Variable Odds ratio of dying in the… 95% Confidence Intervals
neonatal period post-neonatal neonatal period post-neonatal
period period
Infant’s Sex (ref: male)
Female 0.85 (0.001) 0.88 (0.006) (0.78;0,94) (0.81;0.96)
Plurality (ref: singleton)
Twins or higher order 0.72 (0.003) 0.86 (0.359) (0.58;0.89) (0.62;1.19)
Unknown plurality 0.59 (0.014) 0.89 (0.621) (0.39;0.90) (0.57;1.40)
Delivery Mode (ref: normal)
Cesarean Section 0.99(0.820) 0.97(0.590) (0.90;1.09) (0.89;1.07)
Forceps or other 0.56(0.000) 0.85(0.162) (0.43;0.74) (0.67;1.07)
Missing delivery mode 0.52(0.001) 1.22(0.430) (0.34;0.78) (0.75;1.98) Prior losses (ref: no loss)
One prior loss 1.14(0.079) 1.14(0.052) (0.99;1.31) (1.00;1.30)
Two or more losses 1.06(0.585) 1.33(0.035) (0.86;1.31) (1.02;1.73)
Unknown number of losses 1.06(0.458) 1.08(0.396) (0.91;1,22) (0.91;1.27) Apgar score 1 minute (ref:7-8)
0 to 6 1.82(0.000) 1.43(0.000) (1,58;2.09) (1.18;1.72)
9 to 10 0.77(0.000) 0.92(0.178) (0.68;0.87) (0.81;1.04)
Missing 0.81(0.395) 0.83(0.672) (0.51;1.31) (0.35;1.97)
Apgar score 5 minute (ref:7-8)
0 to 6 4.26(0.000) 1.63(0.009) (3.65;4.95) (1.13;2.35)
9 to 10 0.56(0.000) 0.85(0.057) (0.48;0.65) (0.72;1.00)
Missing 1.79(0.028) 1.37(0.482) (1.07;2.99) (0.57;3.29)
Table 2 – (continued)
Tabela 2 – (continuação)
Variable Distribution (percentages) of infants
exposed to infant death
Race/color White 23.1
Non-White 10.4
Missing 66.5
Maternal Education No schooling 1.4
Elementary, incomplete 35.5
Elementary, complete 17.3
Secondary 17.4
College 7.7
Unknown schooling 20.7
Community Development Low 38.5
Medium 41.1
High 20.4
Note: Weighted frequency for exposed to infant death: 201206 Nota: Freqüência ponderada dos expostos à mortalidade infantil: 201206 Source/Fonte: DATASUS www.datasus.gov.br - 2000
Table 3 – (continued)
Tabela 3 – (continuação)
Variable Odds ratio of dying in the… 95% Confidence Intervals
neonatal period post-neonatal neonatal period post-neonatal
period period
Weeks’gestation (ref:37-41 w)
Less 28 weeks 2.34(0.000) 1.05(0.830) (1.85;2.95) (0.66;1.68)
28 to 36 weeks 1. 37(0.001) 1.11(0.305) (1.14;1.65) (0.91;1.34)
42 weeks or more 1.21(0.489) 0.85(0.402) (0.70;2.10) (0.57;1.25)
Unknown weeks’ gestation 1.16(0.099) 0.91(0.480) (0.97;1.39) (0.70;1.18) Prenatal care visits (ref: 7or more)
No visits 1.07(0.627) 1.74(0.000) (0.82;1.40) (1.34;2.26)
1 to 6 visits 1.15(0.018) 1.06(0.379) (1.02;1.29) (0.93;1.20)
Unknown number of visits 1.16(0.045) 1.08(0.262) (1.00;1.35) (0.94;1.25) Birth Weight (ref: 3000 to 3500g)
999 g or less 62.1(0.000) 15.6(0.000) (49.3;78.4) (10.3;23.5)
1000 to 1499 g 21.0(0.000) 8.20(0.000) (16.9;26.0) (6.02;11.2)
1500 to 1999 g 7.21(0.000) 2.54(0.000) (5.96;8.73) (1.86;3.48)
2000 to 2499 g 2.83(0.000) 1.46(0.000) (2.40;3.34) (1.22;1.74)
2500 to 2999 g 1.42(0.000) 1.08(0.667) (1.25;1.61) (0.91;1.17)
3500 to 3999 g 1.05(0.458) 0.93(0.320) (0.92;1.21) (0.81;1.07)
4000 to 4499 g 0.86(0.301) 0.71(0.031) (0.65;1.14) (0.52;0.97)
4500 g or more 1.31(0.360) 1.00(0.997) (0.74;0.23) (0.57;1.77)
Missing birth weight 5.43(0.000) 1.08(0.816) (4.06;7.28) (0.55;0.21)
Race (ref: white)
Non-white 0.99(0.922) 1.19(0.025) (0.83;1.18) (1.02;1.39)
Missing race 1.03(0.576) 1.12(0.077) (0.92;1.16) (0.99;1.26)
Parity (exc. index child) (ref:zero)
One child 1.07(0.282) 1.05(0.468) (0.94;1.21) (0.92;1.21)
Two or three 1.06(0.463) 1.10(0.164) (0.90;1.26) (0.96;1.26)
Four or more 1.16(0.188) 1.34(0.041) (0.93;1.46) (1.01;1.78)
Unknown parity 0.97(0.741) 1.04(0.695) (0.79;1.18) (0.85;1.27)
Maternal Age (ref: 20 to 24)
11 to 14 1.53(0.035) 1.61(0.069) (1.03;2.26) (0.96;2.71)
15 to 19 1.16(0.011) 1.02(0.742) (1.04;1.30) (0.89;1.17)
25 to 29 1.01(0.898) 0.97(0.588) (0.89;1.14) (0.87;1.08)
30 to 34 0.87(0.066) 0.92(0.241) (0.75;1.01) (0.80;1.06)
35 to 39 0.87(0.101) 0.85(0.188) (0.73;1.03) (0.67;1.08)
40 or higher 0.62(0.003) 1.01(0.935) (0.44;0.85) (0.75;1.37)
Maternal age unknown 3.08(0.000) 0.30(0.030) (1.78;5.32) (0.10;0.89)
Maternal education (ref:el incom)
No schooling 1.22(0.221) 1.26(0.297) (0.89;1.66) (0.82;1.93)
Elementary, complete 1.05(0.509) 1.10(0.105) (0.92;1.20) (0.98;1.24)
Secondary 0.92(0.243) 1.00(0.952) (0.79;1.06) (0.87;1.14)
College 0.93(0.579) 0.85(0.159) (0.73;1.19) (0.67;1.07)
Unknown schooling 1.19(0.019) 0.97(0.685) (1.03;1.37) (0.84;1.12)
Community development (ref: high)
Medium 1.33(0.000) 1.17(0.080) (1.15;1.55) (0.98;1.40)
Low 1.60(0.000) 1.35(0.004) (1.37;1.86) (1.10;1.65)
riod that were 41% lower and 11% lower. Therefore, more difficult deliveries associ-ated with the delivery of non-singleton births are possibly related to the non-recording of such information.
Cesarean section did not exert any effect on neonatal or post-neonatal death as com-pared to vaginal deliveries. Another method of delivery substantially reduced the odds of neonatal mortality and marginally reduced the odds of post-neonatal death (OR=0.56, p=0.000 and OR=0.85, p=0.162, respectively). Infants whose mothers had one prior loss had an increased odds of death. The odds were 14% higher in both the neonatal and post-neonatal period (OR=1.14, p=0.079). The odds of death were also 6 and 33 percent higher in the neonatal and in the post-neonatal period, respectively, (OR=1.06, p=0.585 and OR=1.33, p=0.035, respectively) if the mother had more than one loss, but this finding was significant only for post-neonatal mortality.
As compared to infants with Apgar scores 7 and 8 at one minute, infants with lower Apgar scores at one minute had an odds of dying that were respectively, 82 and 43% higher in the neonatal and in the post-neonatal period (OR=1.82, p=0.000 and OR=1.43, p=0.000, respectively). Infants with scores at one minute 9 and 10 had odds of dying that were 23% and 8% lower in the neonatal and post-neonatal period respec-tively, (OR=0.77, p=0.000 and OR=0.92, p=0.178, respectively) but the finding was only marginally significant for post-neonatal mor-tality. Infants with low Apgar scores at five minutes, compared to infants with scores 7 to 8 had an odds of death in the neonatal and post-neonatal period, respectively 4.3 and 1.6 times higher (OR=4.26, p=0.000 and OR=1.63, p=0.000, respectively). Infants with the high-est five-minute scores had an odds of death in the neonatal and in the post-neonatal pe-riod that were, respectively, 44% and 15% lower as compared to the reference group (OR=0.56, p=0.000 and OR=0.85, p=0.057, respectively). Infants with Apgar score miss-ing at five minutes had an odds of death that were 79% higher than the reference group,
indicating that this group more heavily com-prises infants who were assigned low scores (OR=1.79, p=0.028)
Preterm infants (28 to 36 weeks), and very preterm infants (less than 28 weeks), had higher odds of death in the neonatal period. Very preterm infants had odds of death 2.3 times higher than their term counterparts (OR=2.34, p=0.000), and those born between 28 to 36 weeks’ gestation were 1.4 times more likely to die than their term counterparts (OR=1.37, p=0.001). For the post-neonatal period, the findings for prematurity were not significant. Post-maturity, on the other hand, was associated neither with neonatal death nor post-neonatal death. Finally, infants with missing information had a higher odds of death in the neonatal period (OR=1.16, p=0.099), but not in the post-neonatal pe-riod (OR=0.91, p=0.480). Therefore, we have some evidence that preterm infants mostly comprised this group.
If a mother had no prenatal care visits, her infant was at increased odds of neonatal and post-neonatal death, as compared to infants of mothers who had 7 or more pre-natal visits. Infants of mothers with 1 to 6 visits had also higher odds of death in the neonatal and in the post-neonatal period as compared with women with the highest number of visits, but the finding was signifi-cant for the neonatal period only (OR=1.15, p =0.018, OR=1.06, p =0.379, respectively). Having a missing value for number of pre-natal care visits was associated with higher odds of neonatal death and post-neonatal death, but the latter finding was not signifi-cant (OR=1.16, p 0.045; OR=1.08, p= 0.262, respectively). It seems then that these infants were more highly represented in such a group of infants.
OR=0.71, p=0.031, respectively) but the ef-fect was significant only for post-neonatal mortality. Heavier infants appeared to be at increased odds of death, but the coefficient did not reveal significance. Infants with miss-ing information on birth weight had odds of dying in the neonatal period 5.4 times higher as compared to infants in the reference group (OR=5.43, p=0.000). This indicates a higher percentage of low birth weight infants in this category.
There was no significant effect of parity on the odds of dying in the neonatal period, except for a marginal increase in the odds of death for fifth children (OR=1.16, p=0.188). In the post-neonatal period, the significance of this effect was more pronounced: infants who were the fifth child had 34% increased odds of dying in the post-neonatal period as compared to first born-children counter-parts (OR=1.34, p=0.041). The effect of being a third to fourth child was marginally signifi-cant (OR=1.10, p=0.164) and increased the odds of post-neonatal death. Also, the di-rection and magnitude of the odds ratio in-creased from lower to higher parities, which suggests that the higher the number of sib-lings the higher the risk of post-neonatal death. Lack of information on parity was not associated with neonatal or post-neonatal mortality.
Infants of young adolescent mothers had a 53% increased odds of dying in the neonatal period as compared to infants of mothers 20 to 24 and this figure was 62% in case of death in the post-neonatal period (OR=1.53, p=0.035 and OR=1.62, p=0.069, respectively). For neonatal death, infants of older adoles-cent mothers also had significantly higher odds of death (OR=1.161, p=0.011). For post-neonatal death, only a marginal significance of age 35 to 39 was noticed in decreasing the odds of neonatal death relative to age 20 to 24 (OR=0.85, p=0.188). This finding suggests that in the presence of most proximate fac-tors, infants of older mothers do better. Since a very low weighed percentage of infants who died had missing information on maternal age, very high and very low odds ratios for missing maternal age category may be seen
as a result of instability of coefficients due to small numbers.
Regarding maternal education, having no information on schooling increased the odds of neonatal death only (OR=1.19, p=0.019). The magnitude of the odds ratio indicates that illiterate mothers or those with lower levels of schooling were more likely to be represented in this category.
Being a non-white newborn was signifi-cantly associated with post-neonatal mortal-ity but not with neonatal mortalmortal-ity. Non-white infants had an odds of dying in the neonatal period 19% higher compared to their white counterparts (OR=1.19, p=0.025). This effect was found in the post-neonatal period and not in the neonatal period and we may infer that socioeconomic determinants over and above those included in the model that lead to the disadvantage of non-white infants were behind such increased odds of death. Infants with missing information on race/color had significantly higher odds of dying in the post-neonatal period only (OR=1.12, p=0.077), sug-gesting that non-white infants were more highly represented among infants with miss-ing race/color category.
Having a mother live in a highest devel-oped community reduced the odds of neonatal and post-neonatal death. After con-trolling for all factors, living in a community with medium development increased the odds of neonatal and post-neonatal death, respectively, by 33 and 17% as compared to living in a highest developed community. The effect of living in a lowest developed com-munity as compared to a highest developed one was to increase the odds of neonatal and post-neonatal death by 60 and 35%, respec-tively. The result suggests that other proxi-mate determinants or other indicators of socioeconomic status of the mother re-mained uncontrolled for, or a net effect, over and above proximate factors of community development.
Discussion and Conclusions
de-terminants of infant mortality in the City of São Paulo, Brazil. Even though we could not achieve a one-to-one relationship for every death record, we could do so for most death records (over 65%). We stress the importance and the need to conduct further studies us-ing probabilistic matchus-ing and to make use of the available data from SINASC and SIM in a combined way. Another drawback of our study is the high percentage of missing information on some variables, such as prior losses, parity, race/color and maternal edu-cation. Distortions may indeed have hap-pened in the odds ratios estimations for such variables. For example, for neonatal death, in the case of maternal education, if all or almost all mothers with the lowest level of schooling were misclassified as mothers with unknown level of schooling our conclusions would possibly be slightly different. We would conclude, more certainly, that low levels of schooling would exert a deleterious effect on neonatal mortality, but not on post-neonatal mortality. However, we considered that including a missing category rather than imputing data would be more appropriate in order to find out the particularities of in-fants with no recording of information.
Considering the substantive results, as compared to mothers 20 to 24, being an ado-lescent mother increased the odds of neonatal and post-neonatal mortality. In the post-neonatal period, being 11 to 14 de-creased the odds of survival. In the neonatal period the effect of older motherhood was to increase the chances of survival. We sug-gest that after controlling for proximate fac-tors that were associated with disadvantages of infants of older mothers, such as number of prior losses, method of delivery and pre-natal care utilization, infants of older moth-ers have a better chance of neonatal sur-vival. Indeed, though much is assumed about the disadvantage of teenage mothers, moth-erhood in the early twenties is also likely to be disadvantageous as compared to older
motherhood26. Older mothers are more likely
to be married, and to have less mistimed pregnancies. A pathway may be suggested: women with intended pregnancies tend to
be older and more likely to either initiate breastfeeding and also to continue breastfeeding, as compared to mothers with unintended pregnancy, who tended to be
younger 26. Older mothers may also be more
likely to highly value continuity of prenatal care and comprehensive care, more than
young mothers27 and are more likely to
at-tend more prenatal care visits, which reduces morbidities throughout the pregnancy pe-riod.
A marginal effect of college education for post-neonatal mortality was found (OR=0.845; p=0.159) suggesting that college exerts a protective effect on post-neonatal survival. This maybe the case because as sec-ondary education expanded in recent years in Brazil, and has (especially grades 7 to 9) become mass education. As a consequence, students from previously ‘excluded’ socio-economic strata are entering the secondary
educational system28. But college mothers
are still a very selective group of Brazilian society, and it is reasonable to assume that the chance of death of their infants would be lower as well.
There was no effect of cesarean section on infant mortality in our data. In the neonatal period, the use of forceps, as com-pared to vaginal delivery, increased the odds of survival. This finding makes sense, since in the hands of a skilled and experienced physician the use of forceps can hasten the delivery and alleviate possible fetal distress. Its use, then, is ultimately beneficial to infant survival.
The same factors that led to fetal losses for these mothers may have been conducive to the post-neonatal death of their infants.
Birth weight, gestational age, and Apgar scores were the most important predictors of neonatal survival, as expected. For post-neonatal mortality, birth weight and Apgar scores were the most important predictors. Community development remained sig-nificant in the presence of all variables used in this study. Our community variable can be seen as an index that comprises overall quality, income level and investment level in the community, as well as education of the household head. It also measures the aver-age household density. More developed communities are more likely to be better
served by sanitation connections which im-prove infant survival. Community
infrastruc-ture may also improve hygienic practices29.
Interactions between friends and neighbors in communities may also lead to change in behavior regarding infant care and in this sense better off communities may benefit from an overall level of community educa-tion. These are all suggested pathways through which community development may affect infant survival that were not cap-tured through our variables and may all be reflected in the community variable. Quali-tative studies may be a next step in order to understand and minimize health disparities among children of different communities in this population.
References
1. Rutstein SO. Factors associated with trends in infant and child mortality in developing countries during the 1990s. Bull World Health Organ 2000; 78: 1256-70.
2. Diamond I. Child mortality – the challenge now. Bull World Health Organ 2000; 78: 1174.
3. Moss W, Darmstadt GL, Marsh DR, Black RE,
Santosham M. Research priorities for the reduction of perinatal and neonatal morbidity and mortality in developing countries. J Perinatol 2002; 22: 484-95.
4. De Hart MP. Racial differences in Apgar scores and mortality and morbidity in low birthweight infants. [Sc.D. dissertation] Baltimore (MD): Johns Hopkins University; 1994.
5. Guo G. Use of sibling data to estimate mortality effect in Guatemala. Demography 1993; 30: 15-32.
6. Wells JCK. Natural selection and sex differences in morbidity and mortality in early life. J Theor Biol 2000; 202: 65-76.
7. Machado CJ. Early Infant Morbidity and Infant Mortality in the City of São Paulo, Brazil: A Probabilistic Record Linkage approach. [Ph.D. dissertation] Baltimore (MD): Johns Hopkins University; 2002.
8. Clark S, Blum J, Blanchard K, Galvao L, Fletcher H, Winikoff B. Misoprostol use in obstetrics and gynecology in Brazil, Jamaica, and the United States. Int J Gynaecol Obstet 2002; 76: 65-74.
9. Villar J, Bergsjo P. Scientific basis for the content of routine antenatal care. I. Philosophy, recent studies, and power to eliminate or alleviate adverse maternal outcomes. Acta Obstet Gynecol Scand 1997; 76: 1-14.
10. Barros FC, Victora CG, Horta BL. Ethnicity and infant health in Southern Brazil. A birth cohort study. Int J Epidemiol 2001; 30: 1001-8.
11. Hobcraft J. Women’s education, child welfare and child survival: a review of the evidence. Health Trans Rev 1993; 3: 159-75.
12. Haaga JG. Mechanisms for the association of maternal age, parity, and birth spacing with infant health. In: Contraceptive use and controlled fertility. Washing-ton, DC: National Academy Press; 1989. p. 96-139.
13. Curtis SL, Diamond I, McDonald JW. Birth interval and family effects on postneonatal mortality in Brazil. Demography 1993; 30: 33-43.
14. Cowden AJ, Funkhouser E. Adolescent pregnancy, infant mortality, and source of payment for birth: Alabama residential live births, 1991-1994. J Adolesc Health 2001; 29: 37-45
15. Bianco A, Stone J, Lynch L, Lapinski R, Berkowitz G, Berkowitz RL. Pregnancy outcome at age 40 and older. Obstet Gynecol 1996; 87: 917-22.
16. Mosley WH, Chen LC. An analytical framework for the study of child survival in developing countries. Popul Dev Rev 1984; 10 Suppl: 25-45.
17. Bai J, Wong FWS, Bauman A, Mohsin M. Parity and pregnancy outcomes. Am J Obstet Gynecol 2002; 186: 274-8.
19. Mahy M. Perceptions of child mortality and their effects on fertility intentions in Zimbabwe. [Sc.D. dissertation] Baltimore (MD): Johns Hopkins Univer-sity; 1999.
20. Filmer D, Pritchett LH. Estimation wealth effects without expenditure data – or tears: An Application of educational enrollment in the State of India. Demogra-phy 2001; 38: 115-32
21. Sposati, A. (Ed) Mapa da exclusão/inclusão social da cidade de São Paulo. São Paulo: Educ; 1996.
22. Sposati, A. (Ed) Mapa da exclusão/inclusão social da cidade de São Paulo – Dinâmica social dos anos 90. São Paulo: Educ; 2000.
23. Hosmer DW, Lemeshow S. Applied Logistic Regression. New York: Wiley and Sons; 1989.
24. Liang KY, Zeger SL Regression analysis for correlated
data. Annu Rev Public Health 1993; 14: 43-68
25. Hobcraft J, Kiernan K Childhood poverty, early motherhood and adult social exclusion. Br J Sociol 2001; 52: 495-517.
26. Taylor JS, Cabral HJ Are women with an unintended pregnancy less likely to breastfeed? J Fam Pract 2002; 51: 431-6.
27. O’Malley AS, Forrest CB Beyond the examination room: primary care performance and patient-physician relationship for low income women. J Gen Intern Med 2002; 17: 66-74.
28. Castro CM. Secondary schools and the transition to work in Latin America and the Caribbean. Technical Paper Series/Sustainable Development Department. Washington DC: Inter-American 2000; Development Bank. 26 p.
29. Sastry N. (1996) Community characteristics, individual and household attributes, and child survival in Brazil. Demography 1996; 33: 211-29.