BY
Licença Creative Commom
Rev Bras
Cineantropom
Hum
DOI: http://dx.doi.org/10.5007/1980-0037.2016v18n3p297
original article
1 São Paulo State University. Department of Physical Education, Physical Activity, Sport and Health Center. Rio Claro, SP. Brazil.
2 Federal Institute of Education. Science and Technology of South of Minas Gerais. Muzambinho, MG. Brazil.
3 Pontif Catholic University of Parana. Department of Physical Education. Research Group of Physical Activity and Quality of Life. Curitiba, PR. Brazil.
4 University of California.
Department of Family and Preventive. San Diego. USA.
Received: 28 July 2015
Accepted: 23 March 2016
Association between private and public places
and practice of physical activity in adults
Associação entre locais públicos e privados e prática de
atividade física em adultos
Priscila Missaki Nakamura1,2
Inaian Pignatti Teixeira1
Adriano Akira F Hino3
Jacqueline Kerr4
Eduardo Kokubun1
Abstract – here are some studies that showed the relationship between built environment with practice of physical activity during leisure-time and active transportation in the adult population. However, this relationship may be inluence by type and intensity of physical activity. he aim of this study was to verify association between public and private places for engaging in diferent types of physical activity in adults of Rio Claro City, Brazil. Cross sectional study with representative sample of 1588 adults with a mean age of 45.7±17.0 years completed the IPAQ-long form. Geographic Information System data were employed to assess the built environment. he time to diferent physical activity types were divided in actives (≥10 min/week) and inactive (<10 min/week). Poisson Multilevel Regression Analysis was performed in the Stata version 12.0. After adjusting for confounders, walking during leisure-time was positively associated with São Paulo’s Social Vulnerability Index (SSVI) categories of 1 (PR=2.77) through 5 (PR=1.94) and negatively associated with population density higher than 68 km/m2 (PR=0.70). Vigorous intensity physical activity was negatively associated with distance greater than 596 meters of private places to practice physical activity (PR=0.50). Total leisure time physical activity was positively associated with SSVI 1 (PR=2.48) and 5 (RP=1.89). Moderate intensity physical activity was not associated with built environment factors. here were diferents associations between the built environment factors with leisure time PA except to moderate intensity physical activity.
Key words: Adults; Environment; Epidemiology; Physical activity.
Resumo – Há diversos estudos que veriicaram a relação entre ambiente construído e a prática de atividade física no lazer e no transporte ativo na população adulta. Entretanto, essa relação parece ser inluenciada pelo tipo e intensidade da atividade física. Objetivou-se veriicar a associação entre locais públicos e privados para a prática de atividade física com diferentes tipos de atividade física em adultos da cidade de Rio Claro-SP/Brasil. Estudo transversal com amostra representativa de 1.588 adultos (45,7±17,0 anos) que responderam o IPAQ versão longa. Dados do sistema de informação geográica foram utilizados para avaliar o ambiente construído. O tempo dos diferentes tipos de atividade física foi dividido em ativo (≥10 min/sem) e inativo (<10 min/sem). Foi realizada a regressão multinivel de Poisson no Stata versão 12.0. Depois de ajustado pelas variáveis de confusão, a caminhada no lazer foi associada positivamente com o Indice de Vulnerabilidade Social de São Paulo (IPVS) da categoria 1 (RP=2,77) à 5 (RP=1,94) e, negativamente, associado com densidade populacional maior que 68 km/m2 (RP=0,70). Atividade física vigorosa de lazer foi associada negativamente com distâncias maiores que 596 metros de locais privados para atividade física (RP=0,50). Atividade física total foi possitivamente associado com o IPVS 1 (RP=2,48) e 5 (RP=1,89) e, atividade física moderada não foi associada com nenhuma variável do ambiente construído. Houve associações distintas entre o ambiente construído e os tipos de atividades físicas, exceto para atividades de intensidade moderada.
INTRODUCTION
Many cross sectional studies have shown the relationship between availability (number of the facilities) and accessibility (distance to facilities) of physical activity (PA) facilities with practice of physical activity during leisure-time and active transportation in the adult population1,2. Studies
have shown that the presence of places for PA are positively associated with higher levels of walking during leisure-time3,4, increased use of facilities5
and higher frequency of exercise6.
McComarck et al.5 demonstrated that for each additional private and
public place to practice PA in the neighborhood there was an increase of 51% and 12% in the use of these places, respectively. Additionally, people who used these places showed more prevalence of moderate and vigorous intensity PA than people who did not use these places4. Further, the
Halonen et al.7 study showed that an increase distance to a facility was
associated with decrease in MET hour in adults. However, studies that evaluate availability and accessibility through objective instruments have been shown less consistent reporting8 and weak associations9.Futhermore,
the association between built environment and PA may be diferent for each PA domain (leisure, transport, occupation and home) and type1.
Study performed in Brazil show that the presence of a gym (private places) was associated with a higher prevalence of people who met the PA recommendations in relation to walking, moderate and vigorous intensity of PA10. However, international and nationals studies that demonstrate this
relationship were carried out in cities with more than 500,000 inhabitants (large city)11-14, such as Curitiba, which has more than one million
inhabitants. In Brazil, larger cities have diferent cultural and environment characteristics in comparison to mediun and small cities. Further, most of them Brazilian studies used subjective instruments to assess the built environment only two studies used objective instruments to assessment built environment10,15. McCormack et al.16 study suggests that the perceptions
of the built enviroment are not well correlated with the objective measures of the built environment (e.g presence of parks, PA facilities, amenities, walking times and distance to several diferent destinations). hus, the aim of this study was to verify the association between public and private places and PA types in adults of a medium sized city -Rio Claro-SP city Brazil- using objective measures of the built environment. From the results of this study, we hope to better understand the association between built environment and practice of PA in adults of a medium sized city.
METHODOLOGICAL PROCEDURES
he study was performed in the Rio Claro city that is situated in the Southeast of São Paulo state with territorial area of 1,498 km², a population of 187,63717 and a Human Development Index of 0.825. Rio Claro is a medium
Rev Bras Cineantropom Desempenho Hum 2016, 18(3):297-310
Subjects
A process of random sampling stratiied by census tracts was used to select adult residents in the urban area of Rio Claro-SP. he city has 200 census tracts and in the present study all odd census (100) tracts were selected. In total, 1464 households were randomly selected. Of these, only 66% (960) were eligible for the study and the others had enrolment problems. he total number of households interviewed was 800 (83%), and approximately 1700 individuals aged 20 years or older were part of the data collection, with 17% of refusals (individuals who did not respond the questionnaire; reported lack of time; were not found in ive attempts by the interviewers; presented health problems).
Dependent Variables
he IPAQ- long form was used to assess the frequency (per week) and duration of more than 10 minutes per week of walking, moderate intensity PA, vigorous intensity PA and total leisure time PA performed in the last week before the interview. he total leisure time PA was calculated using the equation suggestion by Hallal et al.19. he walking time during leisure
time, moderate and vigorous intensities of PA and total PA in leisure time were classiied into < 10 min/week (inactive) and ≥ 10 min/week (active) and were analyzed separately11-13.
Independent variables
he 1.588 participants were geocoded by their residential address in ArcGIS version 10.0. he geographic information layers were obtained in two phases. First, we purchased the Google database of Rio Claro city that contains geographic information about streets, avenues and census tracts. Second, cycle paths, banks, churchs, schools, bus stations and private and public place to practice PA were geocoded using addresses obtained through the Departament of Planning Development and Environment, National Institute of Education Studies and Research, City Department of Education and Rio Claro Sports Department and internet sites.
he built environment indicators were classiied to relect availability and acessibility. he availability was determined by the number of facilities inside a 500 meters bufer from the participant’s house10. Acessibilty was determined
as the shortest distance in meters between the participant’s house to a place to practice PA, both private (places that need paid fees, eg. itness academy, recreation center and school sport) and public (places that do not need paid fees, eg. parks, churchs, school and public centers). Population density, i.e. inhabitants per square meter of each bufer of 500 meters, and São Paulo’s Social Vulnerability Index (SSVI) were matched at the census tract level only. he SSVI provides a life’s and poverty municipal conditions overview, geographic poverty distribution and a tool for policy evaluation in 645 cities of the State of São Paulo. his index was developed by the SEADE Foundation.
dichotomized in < 594 meters and ≥ 595 meters and to public places was < 617 meters and ≥ 618 meters based on the mean distance from locations for this city. heses variables were dichotomized because the data were highly skewed. he population density was classiied into quartiles based on the city level distribution and the SSVI was categorized from 1 (low vulnerability) to 6 (high vulnerability)20.
Covariates
Sex, age (20-39, 40-59 and ≥ 60 years of old), marital status (single, married, widowe/divorced), educational level (≥ 11, 8-10 and ≤ 7 years) and number of cars per home (0 and ≥ 1) were evaluated by questionnaire. Body Mass Index (BMI) (≤ 24.9, 25-29,9 and ≥ 30 kg/m2) was calculated using self
reported height and weight. hese were entered as covariates in the analyses. hese covariates were used because some studies showed the association between these variables with practice of PA in Brazil10,12,14.
Statistical Analysis
To verify the relationship between physical activity in each type of physical activity and built environment variable was carried out the Poisson Mixed Regression Analysis and used a random efects. he individual characteristics of participants were added to the irst model and in the second model the built environment variables were added. All analyses were performed through the Stata program version 12.0.
RESULTS
he total sample consisted of 1,588 participants, 57.7 % women, 40.3% of people with 20 to 39 years, 64.6 % married, 44.6% of the participants have more than 7 years of education, 64.8% have more than 1 car per home; 48.3 % with BMI ≤ 24.9. Related to the built environment the average of de population density (inhabitants/km2) was 0.93; private places and pubic
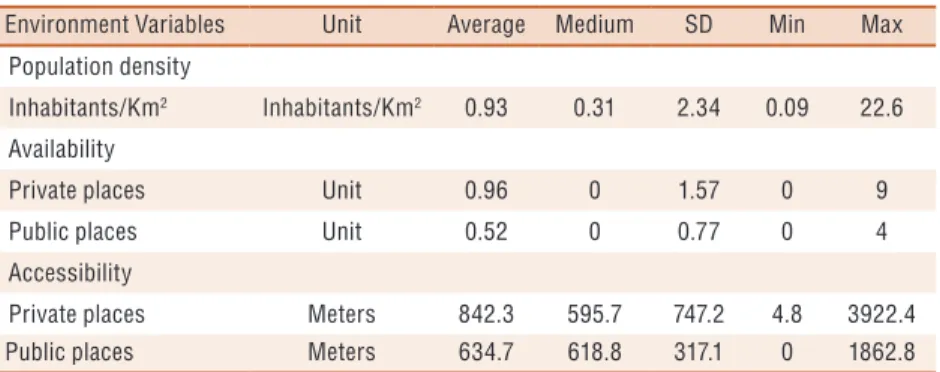
places were 0.96 and 0.52 (unit), respectively. Acessibility to private and public places were 842.3 and 634.7 meters, respectively (Table 1).
Table 1. Characteristcs of built environment. Rio Claro, Brazil (2007-2008)
Environment Variables Unit Average Medium SD Min Max
Population density
Inhabitants/Km2 Inhabitants/Km2 0.93 0.31 2.34 0.09 22.6
Availability
Private places Unit 0.96 0 1.57 0 9
Public places Unit 0.52 0 0.77 0 4
Accessibility
Private places Meters 842.3 595.7 747.2 4.8 3922.4
Public places Meters 634.7 618.8 317.1 0 1862.8
Rev Bras Cineantropom Desempenho Hum 2016, 18(3):297-310
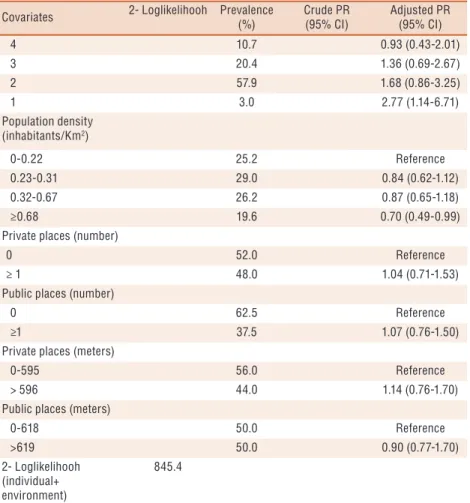
he individual level variables associated positively with walking during leisure time were: people who had more than 60 years of age had a 34% greater prevalence of walking than younger people (< 39 years old), widower or divorced had 42% more chance to do this exercise than single participants, and those over 11 years of schooling had a 54% greater likelihood of walking than people who had less than 7 years of schooling. Residents of SSVI categories of 1 (PR[95% Conidence Interval] 2.77[1.14-6.71]) and 5 (1.94[1.02-3.73]) showed higher prevalence of walking than people who lived in areas with SSVI 6. People who lived in areas with a population density higher than 0.68 km/m2 (0.70[0.49-0.99]) showed lower
prevalence of walking than people who lived in areas with less than 0.22 km/m2 population densities. Further, the private and public variables were
not associated with walking during leisure time (Table 2).
Table 2. Association of individual and built environment characteristcs with walking during leisure
time. Rio Claro, Brazil (2007-2008).
Covariates 2- Loglikelihooh Prevalence
(%)
Crude PR (95% CI)
Adjusted PR (95% CI)
First Level
Sex
Women 57.9 Reference Reference
Men 42.1 0.97 (0.78-1.20) 0.98 (0.79-1.22)
Age (years)
20-39 33.2 Reference Reference
40-59 40.5 1.25 (0.96-1.63) 1.16 (0.89-1.53)
≥60 26.0 1.64 (1.20-2.49) 1.34 (0.95-1.90)
blank 0.30
Marital Status
Single 14.5 Reference Reference
Married 63.3 1.31 (0.94-1.82) 1.38 (0.90-2.11)
Widower/divo. 15.2 1.37 (0.89-2.08) 1.42 (1.01-1.98)
Education (years)
≤ 7 51.7 Reference Reference
8-10 17.2 1.31 (0.94-1.82) 1.28 (0.92-1.79)
≥ 11 31.1 1.74 (1.33-2.27) 1.54 (1.16-2.04)
Quantity of car per home
0 29.0 Reference Reference
≥ 1 68.0 1.14 (0.89-1.45) 1.06 (0.83-1.36)
blanks 3.0
BMI (kg/m2)
≤ 24.9 42.6 Reference Reference
25.0-29.9 39.4 1.20 (0.95-1.52) 1.22 (0.96-1.54)
≥ 30 16.9 1.06 (0.79-1.44) 1.08 (0.80-1.47)
blanks 1.1
2- Loglikelihooh (individual)
855.06
Second Level
SSVI
6 3.2 Reference
5 4.8 1.94 (1.02-3.73)
Covariates 2- Loglikelihooh Prevalence (%)
Crude PR (95% CI)
Adjusted PR (95% CI)
4 10.7 0.93 (0.43-2.01)
3 20.4 1.36 (0.69-2.67)
2 57.9 1.68 (0.86-3.25)
1 3.0 2.77 (1.14-6.71)
Population density (inhabitants/Km2)
0-0.22 25.2 Reference
0.23-0.31 29.0 0.84 (0.62-1.12)
0.32-0.67 26.2 0.87 (0.65-1.18)
≥0.68 19.6 0.70 (0.49-0.99)
Private places (number)
0 52.0 Reference
≥ 1 48.0 1.04 (0.71-1.53)
Public places (number)
0 62.5 Reference
≥1 37.5 1.07 (0.76-1.50)
Private places (meters)
0-595 56.0 Reference
> 596 44.0 1.14 (0.76-1.70)
Public places (meters)
0-618 50.0 Reference
>619 50.0 0.90 (0.77-1.70)
2- Loglikelihooh (individual+ environment)
845.4
PR: prevalence ratio; * Adjusted for sex, age group, marital status, education, quantity of car per home and BMI.
he individual level variables which were positively associated with moderate intensity PA were males (1.40[1.11-1.79]), individuals with 8 to 10 years of schooling (1.91[1.35-2.72]), and individuals with over 11 years of schooling (1.59[1.07-2.36]). Individuals over 60 years old demonstrated lower prevalence of moderate intensity PA (0.63 [0.40-0.96]) than individuals younger than 39 years of old. he private and public variables were not associated with moderate intensity PA (Table 3).
Table 3. Association between individual and built environment characteristic with moderate
intensity of physical activity. Rio Claro, Brazil (2007-2008).
Covariates 2- Loglikelihooh Prevalence
(%)
Crude PR (95% CI)
Adjusted PR (95% CI)
First Level
Sex
Women 47.0 Reference Reference
Men 53.0 1.40 (1.10-1.77) 1.40 (1.11-1.79)
Age (years)
20-39 51.3 Reference Reference
40-59 35.9 0.90 (0.68-1.19) 0.85 (0.64-1.13)
≥60 12.5 0.73 (0.49 -1.10) 0.63 (0.40-0.96)
blanks 0.3
Rev Bras Cineantropom Desempenho Hum 2016, 18(3):297-310
Covariates 2- Loglikelihooh Prevalence
(%)
Crude PR (95% CI)
Adjusted PR (95% CI)
Marital Status
Single 27.0 Reference Reference
Married 63.5 0.93 (0.69-1.25) 0.98 (0.72-1.34)
Widower/divo. 9.5 0.78 (0.48-1.27) 0.82 (0.50-1.33)
Education (years)
≤ 7 61.8 Reference Reference
8-10 18.4 1.64 (1.11-2.43) 1.59 (1.07-2.36)
≥ 11 19.7 2.08 (1.49-2.92) 1.91 (1.35-2.72)
Quantity of car per home
0 27.0 Reference Reference
≥ 1 69.1 1.15 (0.88-1.52) 1.11 (0.84-1.47)
blanks 3.9
BMI (kg/m2)
≤ 24.9 52.6 Reference Reference
25.0-29.9 33.2 0.96 (0.74-1.24) 0.96 (0.74-1.25)
≥ 30 12.8 0.81 (0.57-1.16) 0.80 (0.56-1.16)
blanks 1.3
2- Loglikelihooh (individual)
733.59
Second Level
SSVI
6 4.5 Reference
5 6.3 1.43 (0.74-2.78)
4 15.5 1.17 (0.53-2.54)
3 19.1 1.32 (0.67-2.60)
2 53.3 1.12 (0.57-2.22)
1 1.3 1.00 (0.27-3.69)
Population density (inhabitants/Km2)
0-0.22 21.7 Reference
0.23-0.31 27.6 1.00 (0.71-1.43)
0.32-0.67 25.0 1.04 (0.73-1.49)
≥0.68 25.7 1.10 (0.76-1.60)
Private places (number)
0 51.0 Reference
≥ 1 49.0 1.06 (0.68-1.65)
Public places (number)
0 19.3 Reference
≥1 18.9 1.05 (0.72-1.54)
Private places (meters)
0-595 56.3 Reference
> 596 43.7 0.92 (0.63-1.34)
Public places (meters)
0-618 49.4 Reference
>619 50.6 0.87 (0.55-1.38)
2- Loglikelihooh (individual+ environment)
729.93
PR: prevalence ratio; *Adjusted for sex, age group, marital status, education, quantity of car per home and BMI.
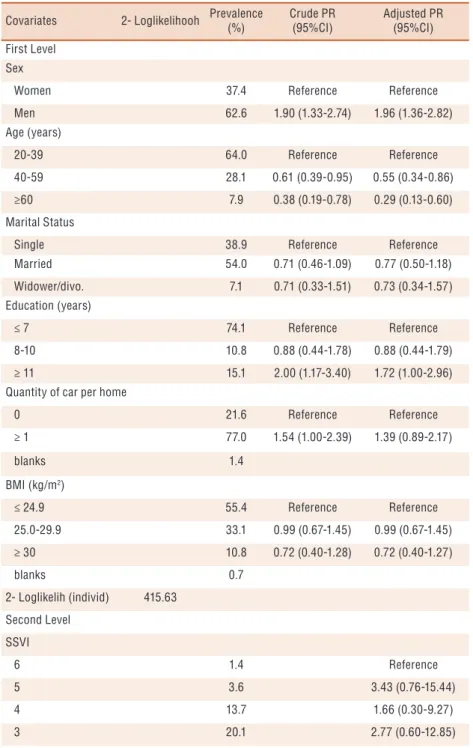
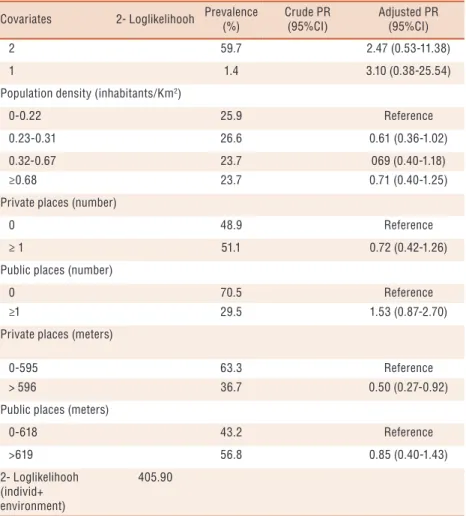
Only men (1.96[1.36-2.82]) and those with over 11 years of schooling (1.72[1.00-2.96]) were positively associated with vigorous intensity PA. Individuals between the age of 40 and 59 (0.55[0.34-0.86]) and ≥ 60 years old (0.29[0.13-0.60]) showed less prevalence of vigorous intensity PA than individuals who were less than 39 years old. People who lived at a distance greater than 596 meters of private places to practice of PA (0.50[0.27-0.92]) showed lower prevalence of vigorous intensity PA than people who lived nearer to the private places to practice PA (Table 4).
Table 4. Association between individual and built environment characteristic with vigorous intensity
of physical activity. Rio Claro, Brazil (2007-2008).
Covariates 2- Loglikelihooh Prevalence (%)
Crude PR (95%CI)
Adjusted PR (95%CI)
First Level Sex
Women 37.4 Reference Reference
Men 62.6 1.90 (1.33-2.74) 1.96 (1.36-2.82)
Age (years)
20-39 64.0 Reference Reference
40-59 28.1 0.61 (0.39-0.95) 0.55 (0.34-0.86)
≥60 7.9 0.38 (0.19-0.78) 0.29 (0.13-0.60)
Marital Status
Single 38.9 Reference Reference
Married 54.0 0.71 (0.46-1.09) 0.77 (0.50-1.18)
Widower/divo. 7.1 0.71 (0.33-1.51) 0.73 (0.34-1.57)
Education (years)
≤ 7 74.1 Reference Reference
8-10 10.8 0.88 (0.44-1.78) 0.88 (0.44-1.79)
≥ 11 15.1 2.00 (1.17-3.40) 1.72 (1.00-2.96)
Quantity of car per home
0 21.6 Reference Reference
≥ 1 77.0 1.54 (1.00-2.39) 1.39 (0.89-2.17)
blanks 1.4
BMI (kg/m2)
≤ 24.9 55.4 Reference Reference
25.0-29.9 33.1 0.99 (0.67-1.45) 0.99 (0.67-1.45)
≥ 30 10.8 0.72 (0.40-1.28) 0.72 (0.40-1.27)
blanks 0.7
2- Loglikelih (individ) 415.63
Second Level
SSVI
6 1.4 Reference
5 3.6 3.43 (0.76-15.44)
4 13.7 1.66 (0.30-9.27)
Rev Bras Cineantropom Desempenho Hum 2016, 18(3):297-310
Covariates 2- Loglikelihooh Prevalence (%)
Crude PR (95%CI)
Adjusted PR (95%CI)
2 59.7 2.47 (0.53-11.38)
1 1.4 3.10 (0.38-25.54)
Population density (inhabitants/Km2)
0-0.22 25.9 Reference
0.23-0.31 26.6 0.61 (0.36-1.02)
0.32-0.67 23.7 069 (0.40-1.18)
≥0.68 23.7 0.71 (0.40-1.25)
Private places (number)
0 48.9 Reference
≥ 1 51.1 0.72 (0.42-1.26)
Public places (number)
0 70.5 Reference
≥1 29.5 1.53 (0.87-2.70)
Private places (meters)
0-595 63.3 Reference
> 596 36.7 0.50 (0.27-0.92)
Public places (meters)
0-618 43.2 Reference
>619 56.8 0.85 (0.40-1.43)
2- Loglikelihooh (individ+ environment)
405.90
PR: prevalence ratio; *Adjusted for sex, age group, marital status, education, quantity of car per home and BMI.
For total leisure time PA the individual level variables positively associated were: men (1.27[1.07-1.51]), people who had from 8 to 10 years of schooling (1.38[1.05-1.80]) and over 11 years of schooling (1.69[1.34-2.13]). For built environment variables, people who lived in areas with SSVI 1 (2.48[1.18-5.23]) and 5 (1.89[1.20-3.19]) showed higher prevalence of leisure time PA than people who lived in areas with SSVI 6. However, the private and public variables were not associated with total leisure time PA (Table 5).
Table 5. Association between individual and built environment with total leisure time physical
activity. Rio Claro, Brazil (2007-2008).
Covariates 2- Loglikelihooh Prevalence (%)
Crude PR (95% CI)
Adjusted PR (95% CI)
First Level
Sex
Women 50.4 Reference Reference
Men 49.6 1.25 (1.06-1.48) 1.27 (1.07-1.51)
Age (years)
20-39 42.6 Reference Reference
40-59 37.1 1.02 (0.83-1.25) 0.96 (0.78-1.18)
≥60 20.1 1.18 (0.92-1.53) 0.98 (0.74-1.30)
blanks 0.2
Covariates 2- Loglikelihooh Prevalence (%)
Crude PR (95% CI)
Adjusted PR (95% CI)
Marital Status
Single 22.0 Reference Reference
Married 64.5 1.01 (0.80-1.27) 1.05 (0.84-1.34)
Widower/divo. 13.5 1.01 (0.74-1.40) 1.05 (0.76-1.46)
Education (years)
≤ 7 57.1 Reference Reference
8-10 17.3 1.40 (1.07-1.84) 1.38 (1.05-1.80)
≥ 11 25.6 1.86 (1.49-2.32) 1.69 (1.34-2.13)
Quantity of car per home
0 28.5 Reference Reference
≥ 1 68.2 1.13 (0.94-1.37) 1.07 (0.88-1.30)
blanks 3.3
BMI (kg/m2)
≤ 24.9 47.4 Reference Reference
25.0-29.9 36.3 1.07 (0.89-1.29) 1.08 (0.90-1.30)
≥ 30 15.3 0.97 (0.76-1.23) 0.96 (0.76-1.23)
blanks 1.0
2-
Loglikelihooh (individual)
1101.95
Second Level
SSVI
6 3.3 Reference
5 6.0 1.89 (1.20-3.19)
4 13.8 1.29 (0.71-2.35)
3 19.1 1.65 (0.97-2.81)
2 55.4 1.53 (0.90-2.61)
1 2.3 2.48 (1.18-5.23)
Population density (inhabitants/Km2)
0-0.22 24.0 Reference
0.23-0.31 28.2 0.88 (0.70-1.13)
0.32-0.67 25.3 0.91 (0.72-1.17)
≥0.68 22.5 0.87 (0.69-1.13)
Private places (number)
0 51.4 Reference
≥ 1 48.6 0.95 (0.71-1.12)
Public places (number)
0 61.9 Reference
≥1 38.1 1.06 (0.81-1.38)
Private places (meters)
0-595 57.1 Reference
> 596 42.9 0.88 (0.65-1.21)
Public places (meters)
0-618 50.1 Reference
>619 49.9 0.89 (0.69-1.16)
2-
Loglikelihooh (individual+ environment)
1092.97
PR: prevalence ratio; *Adjusted for sex, age group, marital status, education, quantity of car per home and BMI.
Rev Bras Cineantropom Desempenho Hum 2016, 18(3):297-310
DISCUSSION
he results of this study showed that built environment variables were associated with PA, however this association was diferent for each type of PA. he SSVI is an index that helps to identify census tracts that have populational segments that are more vulnerable to poverty evaluated by socioeconomic status and familial life cycle. he economic status of a census tract is very important because it has been associated with mortality21,
general health22 and cardiovascular diseases23. In the presente study, it was
veriied that people who live in places with SSVI 1 and 5 showed higher total leisure time PA and SSVI 1 showed higher prevalence of walking during leisure time when compared with people who lives in SSVI 6 areas. People from SSVI 1 and 5 living in families with head of household elderly and without children while people from SSVI 6 living in families with head of household young with children20. hus, these people can do more
physical activity during leisure time when compared with people who have a children24. Also, people who live in SSVI 6 have lower neighborhood
socioeconomic level. Boone-Heinonen et al.25 performed a longitudinal
study to verify the association between neighborhood socioeconomic level with PA. hey used data from 5115 adults who participated in the Coronary Artery Risk Development in Young Adults (CARDIA) study. After adjusting for sex, individual economic level, educational level, number of children and marital status it was found that low economic neighborhoods showed less practice of leisure time PA in the USA. In the Gerber et al.26
study they showed that patients with myocardial infarction who live in areas with low socioeconomic level engaged in less leisure time PA.
People who lived in areas with higher population density showed less prevalence of walking during leisure time. his result is the opposite from the results found in the international literature that shows that higher population density is associated with higher prevalence of PA2. he land
use mix of rich countries is likely very diferent to Latin America countries. According to your data, the regions that had higher population density (≥0.68) showed higher prevalence of high vulnerability (41.04%) than compared with regions that had lower population density (≤0.31) (13.57%). In Brazil, regions with high vulnerability have high prevalence of violence20.
According to Arango et al.27 low perception of security is associated with
low prevalence of PA during leisure-time. hus, the high vulnerability and the low perception of security in regions with high population density may be explaining the diference between results from rich countries compared with results from Brazil.
People who lived nearer to the private places for practice of PA showed a higher prevalence of vigorous intensity PA, a similar result to the McComarck et al. studies2,5, and Hino et al10 studies. he Hino et al.10
might explain the lack of association between public places and PA6,10.
However, the better quality of equipments of private places to PA might explain the association with vigorous exercise, because these equipments help to do this kind of exercise.
he results also did not agree with the Sallis et al.6 study that showed
that the number of private places to practice PA was more important than the distance from these places. his diference could be due to diferences in the regions size. Rio Claro is a midsize city (498.008 km2) and San
Diego is a large city (964.5 km2) and the quantity of private places in
Rio Claro is lower than the large cities. In this way, the distance may be more important than availability in small city. According to Gogel28 the
perceived space become lower when increases the distance of observation. hus, people who live in small and midsize cities may also have diferences in the perception of distance when compared with people who live in large cities. In this way, people who live in midsize cities may be more inluenced by acessibility than availability of places to practice PA.
In the present study, moderate intensity PA was the only type that did not show an association with built environment factors (Table 3). his result is in agreement with Oliver et al29 that did not found any association
between moderate physical activity and built environment. his lack of association can be because we evaluated only the presence of the places to practice physical activity and may be necessary assessing detail about these places (aesthetics or quality). McComarck & Shiell2 study easy
access to places for PA was positively associated with moderate PA among women. Having many shops and places within walking distance of homes was also positively associated with moderate PA among women however; reporting sidewalks on most neighborhood streets, and crime rate in the neighborhood were negatively correlated with moderate PA. his diference between the results can be explained by the use of diferent instruments to evaluate the built environment. In the present study and the Oliver et al.29
study, objective instruments were used whereas in the McComarck et al.30
Rev Bras Cineantropom Desempenho Hum 2016, 18(3):297-310
CONCLUSION
here were associations between the built environment factors with leisure time PA except to moderate intensity PA. Furthermore, people who live far from private places to practice PA showed less prevalence to practice vigorous intensity PA. hus, public policies need to consider how the built environment inluences PA to create interventions that can promote PA during each type of PA during leisure time.
REFERENCES
1. Van Holle V, Deforche B, Cauwenberg JV, Goubert L, Maes L, Weghe NV.
Relationship between the physical environment and different domains of Physical Activity in European adults: a systematic review. BMC Public Health 2012;12(807):1-17.
2. McCormack GR, Shiell A. In search of causality: a systematic review of the
relationship between the built environment and Physical Activity among adults. Int J Behav Nutr Phys Act 2011;8(125):1-11.
3. Giles-Corti B, Broomhall MH, Knuiman M, Collins C, Douglas K, Ng K, et al.
Increasing walking: how important is distance to attractiveness and size of public open space? Am J Prev Med 2005;28(Suppl 2):169-76.
4. Sugiyama T, Neuhaus M, Cole R, Cole R, Giles-Corti B, Owen N. Destination
and route attributes associated with adults’ walking: a review. Med Sci Sports Exerc 2012;44(7):1275-86.
5. McCormack GR, Giles-Corti B, Bulsara M. Correlates of using neighborhood
recreational destinations in physically active respondents. J Phys Act Health 2007;4(1):39-53.
6. Sallis JF, Hovell MF, Hofstetter CR, et al. Distance between homes and exercise
facilities related to frequency of exercise among San Diego residents. Public Health Rep 1990;105(2):179-85.
7. Halonen JI, Stenholm S, Kivimäki M, Pentti J, Subramanian SV, Kawachi I, et
al. Is change in availability of sports facilities associated with change in physical activity? A prospective cohort study. Prev Med 2015;73:10-14.
8. Hoehner CM, Brennan Ramirez LK, Elliott MB, Handy SL, Brownson RC.
Perceived and objective environmental measures and physical activity among urban adults. Am J Prev Med 2005;28(suppl 2):105–16.
9. Karusisi N, homas F, Meline J, Chaix B. Spatial accessibility to speciic sport
facilities and corresponding sport practice: the RECORD Study. Int J Behav Nutr Phys Act 2013;10(48):1-10.
10. Hino AA, Reis RS, Sarmiento OL, Parra DC, Brownson RC. The built
environment and recreational Physical Activity among adults in Curitiba, Brazil. Prev Med 2011;52(6):419-22.
11. Florindo AA, Salvador EP, Reis RS, Guimarães VV. Perception of the environment
and practice of Physical Activity by adults in a lowsocioeconomic area. Rev Saude Publica 2011;45(2):302-10.
12. Gomes GAO, Reis RS, Parra DC, Ribeiro I, Hino AA, Hallal PC, et al. Walking
for leisure among adults from three Brazilian cities and its association with perceived environment attributes and personal factors. Int J Behav Nutr Phys Act 2011;8(111):1-8.
13. Parra DC, Hoehner CM, Hallal PC, Ribeiro IC, Reis R, Brownson RC,
et al. Perceived environmental correlates of Physical Activity for leisure and transportation in Curitiba, Brazil. Prev Med 2011;52(3-4):234-8.
14. Hallal PC, Reis RS, Parra DC, Hoehner C, Brownson RC, Simões EJ. Association
CORRESPONDING AUTHOR Priscila Missaki Nakamura. São Paulo State University Rio Claro-SP Brazil- Department of Physical Education- Physical Activity, Sport and Health Center. Av: 24 A, 1515 Bela Vista Rio Claro-SP/Brazil
CEP: 13506900.
E-mail: pri_nakamura@yahoo. com.br.
15. Hino AA, Reis RS, Sarmiento OL, Parra DC, Brownson RC. Built environment
and physical activity for transportation in adults from Curitiba, Brazil. J Urban Health 2014;91(3):446-62.
16. McCormack GR, Cerin E, Leslie E, Toit LD, Owen N. Objective versus perceived
walking distances to destinations: Correspondence and predictive validity. Environ Behav 2008;40(3):401-25.
17. Brazilian Institute of Geography and Statistics. Synopsis of the results of the 2010
Census. Distribution of population by sex according to age groups Rio Claro-SP. 2010; Available from: <www.censo2010.ibge.gov.br/sinopse/webservice/default. php?cod1=35&cod2=354390&cod3=35&frm> [2015 jun 01].
18. Brazilian Institute of Geography and Statistics. Tentativa de classiicação das
cidades brasileiras. Rev Bras Geograia 1946;8(3):283-316.
19. Hallal PC, Victora GC, Wells JCK, Lima RC. Physical inactivity: Prevalence and
associated variables in Brazilian adults. Med Sci Sports Exerc 2003;35(11):1894-900.
20. Ferreira MP. Dini NP, Ferreira SP. Espaços e dimensões da pobreza nos municípios
do estado de São Paulo: Índice Paulista de Vulnerabilidade Social – IPVS. São Paulo Perspec 2006;20(1):5-17.
21. Subramanian SV, Chen JT, Rehkopf DH. United Nation Program for Development.
2005. Available from: <www.pnud.org.br/atlas/tabelas/index.php> [2015 jun 01].
22. Do DP. he dynamics of income and neighborhood context for population health: do
long-term measures of socioeconomic status explain more of the black/white health disparity than single-point-in-time measures? Soc Sci Med 2009;68(8):1368-75.
23. Hull WE, Rofey DL, Robertson RJ, Nagle EF, Otto AD, Aaron DJ. Inluence
of marriage and parenthood on physical activity: A 2-year prospective analysis. J Phys Act Health 2010;7(5):577-83.
24. Diez Roux AV, Merkin SS, Arnet D, Chambless L, Massing M, Nieto FJ, et al.
Neighborhood of residence and incidence of coronary heart disease. N Engl J Med 2001;345(2):99-106.
25. Boone-Heinonen J, Rouxb AVD, Kief CI, Lewis CE, Guilkey DK, Gordon-Larsen
P. Neighborhood socioeconomic status predictors of Physical Activity through young to middle adulthood: he CARDIA study. Soc Sci Med 2011;72(5):641-9.
26. Gerber Y, Myers V, Goldbourt U, Benjamini Y, Drory Y, Israel Study Group
on First Acute Myocardial Infarction. Neighborhood socioeconomic status and leisure-time Physical Activity after myocardial infarction: A longitudinal study. Am J Prev Med 2011;41(3):266-73.
27. Arango CM, Páez DC, Reis RS, Brownson RC, Parra DC. Association between
the perceived environment and Physical Activity among adults in Latin America: a systematic review. Int J Behav Nutr Phys Act 2013;10(122):1-9.
28. Gogel WC. he analysis of perceived space. In: Masin SC editor. Foundations of
perceptual theory. Amsterdam: Elsevier; 1993, p. 113-82.
29. Oliver L, Schuurman N, Hall A, Hayes M. Assessing the inluence of the built
environment on Physical Activity for utility and recreation in suburban metro Vancouver. BMC Public Health 2011;11(959):1-9.
30. McCormack GR, Spence JC, Berry T, Doyle-Backer PK. Does perceived behavioral