411 411 411 411 411 Mem Inst Oswaldo Cruz, Rio de Janeiro, Vol. 93(3): 411-415, May/Jun. 1998
Quantitation of HIV-1 RNA Viral Load Using Nucleic Acid
Sequence Based Amplification Methodology and
Comparison with other Surrogate Markers for Disease
Progression
Roberta Sitnik , João Renato Rebello Pinho*/
+Bioquímico Jardim Paulista, Av. Brigadeiro Luiz Antônio 4701, 01401-002 São Paulo, SP, Brasil *Serviço de Virologia, Instituto Adolfo Lutz, Av. Dr. Arnaldo 355, 01246-902 São Paulo, SP, Brasil
In this study, HIV-1 viral load quantitation determined by Nucleic Acid Sequence Based Amplifica-tion (NASBA) was compared with other surrogate disease progression markers (antigen p24, CD4/CD8 cell counts and b-2 microglobulin) in 540 patients followed up at São Paulo, SP, Brazil. HIV-1 RNA
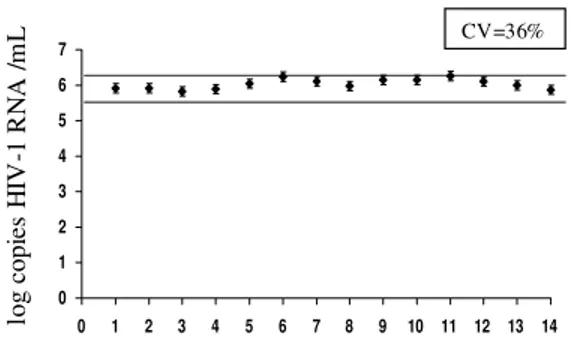
detection was statistically associated with the presence of antigen p24, but the viral RNA was also detected in 68% of the antigen p24 negative samples, confirming that NASBA is much more sensitive than the determination of antigen p24. Regarding other surrogate markers, no statistically significant association with the detection of viral RNA was found. The reproducibility of this viral load assay was assessed by 14 runs of the same sample, using different reagents batches. Viral load values in this sample ranged from 5.83 to 6.27 log (CV = 36%), less than the range (0.5 log) established to the determination of significant viral load changes.
Key words: human immunodeficiency virus type 1 (HIV-1) - viral load -nucleic acid sequence based amplifica-tion (NASBA) - surrogate markers
The natural history of human immunodefi-ciency virus type 1 (HIV-1) infection is highly variable. In adults, the average time between in-fection and development of AIDS is 10 to 11 years, but a significant proportion of individuals (~20%) rapidly progresses to AIDS within five years of infection (Mellors et al. 1996). This variable course causes uncertainty for the infected person and com-plicates decisions about when antiretroviral therapy should begin.
Many clinical and laboratory markers have been used for prognosis in HIV-1 infection: circulating CD4 and CD8 T cell counts, p24 antigen and ß-2 microglobulin quantification (Jurriaans et al. 1994, Mellors et al. 1997). Among these markers, previ-ous studies showed that the single best predictor of progression to AIDS was the percentage or ab-solute number of circulating CD4 lymphocytes (Jurriaans et al. 1994, Mellors et al. 1997).
Direct HIV-1 RNA quantitation has recently become a useful method for assessing and moni-toring HIV-1 disease progression. Viral RNA in plasma or serum directly reflects the titer of
HIV-+Corresponding author. Fax:+55-11-8533505. E-mail:
[email protected] Received 11 March 1998 Accepted 16 April 1998
1 during infection and is a better marker to predict the subsequent risk of AIDS or death than the other markers cited above (Mellors et al. 1996). As a direct measurement of circulating virus, HIV-1 viral load is expected to give complementary in-formation to other markers that monitor the im-munological status, as lymphocytes subsets cell counts and seric ß-2 microglobulin levels. Besides, viral load has enabled physicians to monitor the efficacy of antiretroviral therapies before clinical monitoring becomes possible, since it has been shown that the efficacy of treatment seems to be correlated with a rapid and dramatic decrease in the HIV-1 RNA level (Coste et al. 1996).
In the present study, we have investigated the
value of nucleic acid sequencebased
amplifica-tion (NASBA) HIV-1 quantitaamplifica-tion system (Orga-non Teknika Boxtel, Netherlands) for evaluating the quantitation of HIV-1 RNA and compared the results with four surrogate markers: CD4 and CD8 cell counts, p24 antigen and ß–2 microglobulin.
MATERIALS AND METHODS
412 412 412 412
412 HIV-1 Viral Load Using NASBA R Sitinik, JRR Pinho
One sample with a high viral load was aliquoted and tested 14 times on different days and with dif-ferent batches of reagents to test the reproducibil-ity of the method. Each sera aliquot was stored at -20ºC for a maximal period of four months and thawn only once immediately before use. The co-efficient of variation (CV) was calculated to deter-mine the inter-assay variance.
HIV-1 RNA quantitation - NASBA assay was carried out according to manufacturers instructions, as summarized bellow. HIV-1 RNA was extracted from 1.0 ml of serum using a lysis buffer contain-ing Guanidine Thiocyanate. Three synthetic RNA
calibrators (Qa, Qb, Qc) of known high (106),
medium (105), and low (104) concentrations (in
copies/ml), respectively, were added. Each calibra-tor contained a short unique sequence differing from the HIV-1 wild type. RNA was extracted by using acidified silica, according to the procedure described by Boom et al. (1990). HIV-1 and cali-brator RNA sequences were co-amplified by incu-bation of the extraction product with the primers and the enzyme mixture (Reverse Transcriptase, RNase H and T7 RNA Polymerase) at 41°C for 90 min. The RNA concentration of HIV-1, Qa, Qb and Qc amplicons were measured in four separated tubes. In each tube, the amplified RNA was cap-tured with a biotin-labeled oligonucleotide bound to streptavidin-coated magnetic beads acting as the solid phase, and then hybridized with a specific ruthenium-labeled probe complementary to the HIV-1, Qa, Qb or Qc specific sequence. The mag-netic beads carrying the hybridized amplicon-probe complex were captured on the surface of an elec-trode by means of a magnet. Voltage applied to the electrode triggered the eletroluminescence reaction, in the presence of a buffer containing Tripropylamine. The light emitted by the rutheniumlabeled complex, measured by a photo -multiplier valve, was proportional to the amount of amplicon. Calculation of the relative amount of the four amplicons revealed the amount of HIV-1 RNA in the sample.
Surrogate disease progression markers - p24 antigen, ß2-microglobulin, and CD4 and CD8 T cell counts assays were carried out according to the manufacturers instructions. The utilized meth-ods and number of patients analized for each marker were: (1) p24 antigen: Vidas, BioMérieux (Marcy-l´Etoile, France); 180 patients; (2) ß-2 microglobulin: Vidas, BioMérieux (Marcy-l´Etoile, France) or Immulite, DPC (Los Angeles, Califor-nia, USA); 145 patients; (3) CD4 and CD8 counts: immunofluorescence with monoclonal antibodies, Dako (Glostrup, Denmark); 254 patients. The number of patients tested for surrogate disease progression markers varied depending on availabil-ity of sample for the study.
Statistical analysis- The c2 and t-student test were used for comparing viral load and surrogate
disease progression markers. c2 test was used for
comparing the distribution of the results obtained with surrogate disease progression markers with
viral load results, while t-student test was used for
comparing the mean values obtained with these tests.
RESULTS
Analysis of the CV of the NASBA method - The analysis of the same sample by NASBA in several different runs is shown in Fig. 1. The CV was 36%, with values ranging from 5.83 to 6.27 log, i.e., less than 0.5 log of difference between all of them. It is noteworthy that even after four months of storage at -20ºC, the viral load value obtained with these samples did not decrease.
Fig. 1: determination of viral load by NASBA in the same sample in 14 different times and using different batches of reagents.
Distribution of viral load - Patients were sepa-rated in two groups according to the viral load: group 1 [more than 400 HIV-1 RNA copies/ml – 365 patients (67.6%)] and group 2 [below detec-tion limit (<400 RNA copies/ml) – 175 patients (32.4%)].
Distribution of viral load among patients of group 1 is illustrated in Fig. 2. Viral load values were normally distributed over a range of 2.6 to 7.0 log copies/ml with 73% of the samples pre-senting values between 3.6 and 5.0 log HIV-1 RNA copies/ml.
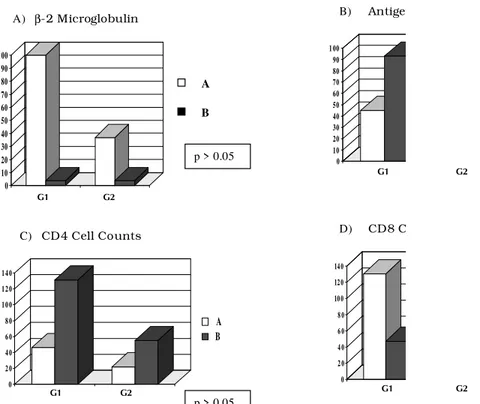
Comparison of surrogate disease progression markers - Results comparing viral load and
surro-gate markers are illustrated in Fig. 3. The c2 test
was used for comparing the distribution of each surrogate marker in relation to the viral load. There was a significant association only with p24 anti-gen (p<0.001), but HIV-1 RNA was detected in 68% of p24 negative patients, showing the higher sensitivity of HIV-1 RNA detection. The linear regression test showed no statistical correlation between viral load values and any of the surro-gate markers tested.
0 1 2 3 4 5 6 7
0 1 2 3 4 5 6 7 8 9 10 11 12 13 14
413 413413 413413 Mem Inst Oswaldo Cruz, Rio de Janeiro, Vol. 93(3), May/Jun. 1998
DISCUSSION
We evaluated the performance of one commer-cially available procedure for HIV-1 quantitation, the NASBA system. Our results were reproduc-ible with less than 0.5 log difference between dif-ferent assays carried out on difdif-ferent days and us-ing different batches of reagents. In previous stud-ies, data on the reproducibility within-runs of the NASBA assay in a high level plasma ranged from 13-62% (Coste et al. 1996), or 15-57% (Vandamme et al. 1996) with a reported inter-batch CV of 37% (Coste et al. 1996), results very similar to those obtained in the present study. Since differences of less than 0.5 log are not considered clinically sig-nificant (Saag et al. 1996), these results were sat-isfactory, confirming that the NASBA system is a reliable method for assessing viral load. How-ever, it is noteworthy that the determination of this 0.5 log range has been based mostly on studies using bDNA and PCR assays (Coombs et al. 1996, O´Brien et al. 1996).
When the results of HIV-1 RNA levels and surrogate markers were compared, it was observed that viral RNA was detected in all the p24 antigen positive samples, as well as in the majority of p24 antigen negative samples. The lower sensitivity of
Fig. 3: distribution of surrogate markers results according to the detection of HIV-1 RNA.
Y - Absolute number of patients; X - G1: patients with detectable HIV-1 RNA (>400 copies/ml) and G2: patients with viral load bellow detection limit (<400 copies/ml).
A) b2 microglobulin - A: >1 x upper normal limit, B: < 1 x upper normal limit; B) p24 antigen - A: p24 positive, B: p24 negative; C) CD4 cell counts - A: <500 cells/mm3, B: >500 cells/ mm3; D) CD8 cell counts - A: >400 cells/ mm3, B: <400 cels/mm3.
The comparison among the mean of viral load values and surrogate markers results for patients with detectable HIV-1 RNA (group 1) is shown in Table. Higher viral load mean values were obtained
in patients with <500 CD4 cells/mm3, >400 CD8
cells/mm3, detectable p24 antigen and raised ß-2
microglobulin levels, but these differences were
not statistically significant (t- student test).
0 10 20 30 40 50 60 70 80 90 1 00
2 .6 -3 .0 3 .6 -4 .0 4 .6 -5 .0 5 .6 -6 .0 6 .6 -7 .0
log (copies/ml) N u m b er of pa ti en ts
Fig. 2: frequence distribution of HIV-1 RNA viral load in 365 samples with detectable virus.
β-2 Microglobulin
0 10 20 30 40 50 60 70 80 90 1 00 G1 G2 A B 0 10 20 30 40 50 60 70 80 90 1 00 G 1 Antigen 0 2 0 4 0 6 0 8 0 1 0 0 1 2 0 1 4 0
G 1 G 2
A
B CD4 Cell Counts
0 2 0 4 0 6 0 8 0 10 0 12 0 14 0 G1 p > 0.05
p > 0.05
A) B)
C) D) CD8 C
G1 G2
G1 G2
414 414 414 414
414 HIV-1 Viral Load Using NASBA R Sitinik, JRR Pinho
TABLE
Comparison of viral load (mean ± standard deviation ) and surrogate markers in patients with detectable HIV-1-RNA (>400 copies/ml)
Group A Group B
CD4 countsa 151063,9 ± 874143,1 80909,6±226921,1
CD8 countsb 281076±1423731 72513,3±164842,8
p24 antigenc 271492,7±1382587 77316,9±193636,5
ß-2 microglobulind 169528,6±1005970 37876,7±55536,5
a: group A- CD4 <500 cels/mm3, group B CD4>500 cels/mm3; b: group A- CD8 >400 cels/mm3 and group B: CD8 <400 cels/mm3; c: group A- p24 positive, group B: p24 negative; d: group A >1 x upper normal limit, group B < 1 x upper normal limit.
p24 antigenemia has already been reported by many other authors (Winters et al. 1993, Lin et al. 1994, van Karkhoven et al. 1994, Coste et al. 1996). These results clearly showed the higher sensivity of viral load determination in comparison with p24 antigen detection. This point raises doubts about the usefulness of HIV-1 p24 antigenemia for moni-toring HIV-1 infected patients, especially consid-ering some reports of false-positive results obtained with p24 assays (Vincent et al. 1995).
No association was found among viral load and CD4 and CD8 cell counts or ß-2 microglobulin, confirming to previously published data (Mellors et al. 1996). Conversely, other authors previously reported an inverse correlation between CD4 counts and HIV-1 RNA level (Winters et al. 1993, Lin et al. 1994, van Karkhoven et al. 1994, Coste et al. 1996). ß-2 microglobulin did not provide additional prognostic information and was found to be a non-specific marker of immune activation (Mellors et al. 1997).
Our results corroborate other studies which showed the importance of viral load determination in HIV-1 infected patients and the usefulness of the NASBA methodology for this purpose. Al-though HIV-1 replication is related to immune im-pairment, predicting the rate of decrease in CD4 cell counts and progression to AIDS and death, no direct correlation between viral load and immuno-logical markers are found in isolated samples. While viral load determinations evaluate the cause of the disease (i.e., the viral burden), CD4 cell counts monitor the consequences of the viral in-fection in the immunological system at a particu-lar time (Ho 1996, Coombs et al. 1996, Mellors et al. 1997). In conclusion, combined measurement of HIV-1 RNA and CD4 cell counts, which con-stitute complementary markers, should be routinely performed for the follow up of HIV infected pa-tients.
REFERENCES
Boom R, Sol CJA, Salimans MMM, Jansen CL, Wertheim van Dillen PME, Van der Noordaa 1990. Rapid and simple method for purification of nucleic acids. J Clin Microbiol28: 495-503.
Coombs RW, Welles SL, Hooper C, Reichelderfer PS, D´Aquila RT, Japour AJ, Johnson VA, Kuritzkes DR, Richman DD, Kwok S, Todd J, Jackson JB, DeGruttola V, Grumpacker CS, Kahn J 1996. Asso-ciation of plasma human immunodeficiency virus type 1 RNA level with risk of clinical progression in patients with advanced infection. J Inf Dis174: 704-712.
Coste J, Montes B, Reynes J, Peeters M, Segarra C, Vendrell JP, Delaporte E, Segondddy M 1996. Com-parative evaluation of three assays for the quantitation of human immunodeficiency virus type 1 RNA in plasma. J Med Virol 50: 293-302. Ho DD 1996. Viral counts count in HIV infection.
Sci-ence 272: 1124-1125.
Ho DD, Neumann AU, Perelson AS, Chen W, Leonard JM, Markowitz M 1995. Rapid turnover of plasma virions and CD4 lymphocytes in HIV-1 infection. Nature 373: 123-126.
Jurriaans S, VanGemen B, Weverling GJ, Van Strijp D, Nara P, Coutinho R, Koot M, Schuitemaker H, Goudsmit J 1994. The natural history of HIV-1 in-fection: virus load and virus phenotype independent determinants of clinical course? Virology204: 223-233.
Lin HJ, Myers LE, Yen-Lieberman B, Hollinger FB, Henrard D, Hooper CJ, Kokka R, Kwok S, Rasheed S, Valey M, Winters MA, McQuay LJ, Nera PL, Reicheldelfer P, Coombs RW, Jackson JB 1994. Multicenter evaluation of quantitation method for plasma human immunodeficiency virus type 1 RNA. J Inf Dis170: 553-562.
Mellors JW, Rinaldo Jr CRR, Gupta P, White RMW, Todd JA, Kingsley LA 1996. Prognosis in HIV-1 infection predicted by the quantity of virus in plasma. Science 272: 1167-1170.
Mellors JW, Muñoz A, Giorgi JV, Margolick JB, Tassoni CJ, Gupta P, Kingsley L, Todd, JA, Saah AJ, Detels R, Phair JP, Rinaldo CR 1997. Plasma viral load and CD4 Lymphocytes as prognostic markers of HIV-1 infection. Ann Int Med 126: 946-954.
415 415415 415415 Mem Inst Oswaldo Cruz, Rio de Janeiro, Vol. 93(3), May/Jun. 1998
A, Benoit S, Rubin M, Simberkoff MS, Hamilton JD 1996. Changes in plasma HIV-1 RNA and CD4+ lymphocyte counts and the risk of progression to AIDS. N Engl J Med 334: 426-431.
Saag MS, Holodniy M, Kuritzkes DR, O’Brien WA, Coombs R, Poscher ME, Jacobsen DM, Shaw GM, Volberding PA 1996. HIV viral load markers in clini-cal practice. Nat Med 2: 625-629.
Vandamme AM, Schmit JC, VanDooren S, VanLaethem K, Gobbers E, Kok W, Goubau P Witurouw M, Peetermans W, DeClercq E, Demyter J 1996. Quan-tification of IV-1 RNA in plasma: comparable re-sults with the NASBA HIV-1 RNA QT and the AMPLICOR HIV Monitor test. J Acq Imun Def Syndr Hum Retr 13: 127-139.
Van Karckhoven I, Fransen K, Peeters M, de Beenhouwer
H, Piot P, van der Groen G 1994. Quantitation of human immunodeficiency virus in plasma by RNA PCR, viral culture and p24 antigen detection. J Clin Microbiol32: 1669-1673.
Vincent F, Raynal N, Francois A, Belec L, Duboust A, Glotz D, Bariety J 1995. False-positive p24 antigenaemia detected in renal allograft recipients: possible role of rabbit antithymocyte globulins. Transplant Proc 27: 1738.
416 416 416 416