A Robust GWSS Method to Simultaneously
Detect Rare and Common Variants for
Complex Disease
Chung-Feng Kao1☯, Jia-Rou Liu1,2☯, Hung Hung1,3‡
*, Po-Hsiu Kuo1,3‡ *
1Department of Public Health, Institute of Epidemiology and Preventive Medicine, National Taiwan University, Taipei, Taiwan,2Department of Public Health, Chang Gung University, Taoyuan,Taiwan,
3Research Center for Genes, Environment and Human Health, National Taiwan University, Taipei, Taiwan ☯These authors contributed equally to this work.
‡These authors also contributed equally to this work.
*[email protected](PHK);[email protected](HH)
Abstract
The rapid advances in sequencing technologies and the resulting next-generation sequenc-ing data provide the opportunity to detect disease-associated variants with a better solution, in particular for low-frequency variants. Although both common and rare variants might exert their independent effects on the risk for the trait of interest, previous methods to detect the association effects rarely consider them simultaneously. We proposed a class of test statistics, the generalized weighted-sum statistic (GWSS), to detect disease associations in the presence of common and rare variants with a case-control study design. Information of rare variants was aggregated using a weighted sum method, while signal directions and strength of the variants were considered at the same time. Permutations were performed to obtain the empiricalp-values of the test statistics. Our simulation showed that, compared to the existing methods, the GWSS method had better performance in most of the scenarios. The GWSS (in particular VDWSS-t) method is particularly robust for opposite association directions, association strength, and varying distributions of minor-allele frequencies. It is therefore promising for detecting disease-associated loci. For empirical data application, we also applied our GWSS method to the Genetic Analysis Workshop 17 data, and the re-sults were consistent with the simulation, suggesting good performance of our method. As re-sequencing studies become more popular to identify putative disease loci, we recom-mend the use of this newly developed GWSS to detect associations with both common and rare variants.
Introduction
The search for common variants (CVs) that are reproducibly associated with complex human diseases has benefited from large-scale genome-wide association (GWA) studies. However, previously identified CVs only account for a small proportion of the trait variation [1,2], i.e. OPEN ACCESS
Citation:Kao C-F, Liu J-R, Hung H, Kuo P-H (2015) A Robust GWSS Method to Simultaneously Detect Rare and Common Variants for Complex Disease. PLoS ONE 10(4): e0120873. doi:10.1371/journal. pone.0120873
Academic Editor:David Meyre, McMaster University, CANADA
Received:September 3, 2014
Accepted:January 26, 2015
Published:April 16, 2015
Copyright:© 2015 Kao et al. This is an open access article distributed under the terms of theCreative Commons Attribution License, which permits unrestricted use, distribution, and reproduction in any medium, provided the original author and source are credited.
Data Availability Statement:The manuscript contains two parts of data. We first simulated data to evaluate power for different statistical approaches. Detailed parameter settings are provided in the Methods section. In addition, we used sequencing data from the Genetic Analysis Workshop 17 (GAW17) and presented association results for comparisons of different approaches. Data were obtained from (http:// www.gaworkshop.org/gaw17), and requests for access to these data can be sent to Professor Jean W. MacCluer ([email protected]).
missing heritability [1]. Even with meta-analyses to combine large GWA datasets, similar situa-tions occur [2]. It is suggested that a certain proportion of the missing heritability might come from rare variants (RVs), which have low frequency in the population to increase the risk of de-veloping complex diseases [3–5]. Unfortunately, RVs are poorly covered in GWA studies [1], and the power of detecting their individual effects is low even in large scale studies [6]. A larger sample size, say more than 10,000 subjects, is required to detect disease-associated variants with minor-allele frequency (MAF) less than 0.01 [7]. Recently, there is increasing evidence in support of the contributions of RVs to the risk of diseases, such asCLEC16Agene for type-1 diabetes and
ANGPTLgene for metabolism traits [8,9]. With the advancement of high-throughput sequencing technologies, large amounts of sequencing data would be rapidly produced in the future years, which provides a unique opportunity to detect disease associated variants, in particular for RVs.
There are two main hypotheses underlying complex human diseases, the common-disease common-variant (CDCV) and the common-disease rare-variant (CDRV), and they are not mutually exclusive in many cases. The combination of CVs and RVs may exert their effects through synthetic association (i.e., synergetic effect) or have independent effects on the trait [10]. For instance, Ionita-Lazaet al[11] uncovered six CVs (p-value = 0.03~1×10⁻⁴) and one
RV (p-value = 1.7×10⁻⁷) inNOD2that affect the risk of developing Crohn disease. Wesselet al
[12] identified both common and rare variants atCHRNB2andCHRNA5to exhibit significant associations with nicotine dependence. Nejentsevet al[13] found four RVs (p-value = 1.3× 10⁻³~2.1×10⁻¹⁶) and one CV (p-value = 9.5×10⁻¹⁷) in theIFIH1gene to be protective against
type-1 diabetes. In addition, one review article reported that both common and rare genetic variants in two genes (LPLandAPOA5) play roles in the development of hypertriglyceridemia [14]. In prior statistical approaches to identify rare variants (which we describe below), very few of them deal with both common and rare genetic variants. Since both types of genetic markers in the same gene may exert their effects for disease traits, we propose a new method in the present study to identify common variants as well as rare variants for complex diseases.
In the last decade, several association tests have been developed for identifying RVs [9,11,15–25]. These methods may have limited power to detect the true signals under certain conditions. In particular, various collapsing and weighting schemes have impacts on the per-formance of association testing as described below. Firstly, some test methods, including weighted sum-test (WSS) [19], variable-threshold (VT) [23], andwSSU [15], sum over RVs where rare information were weighted by MAFs. Under this condition, a rarer (common) vari-ant is always corresponding to a larger (smaller) weight. Moreover, these methods and kernel-based adaptive cluster (KBAC) [9], Sum Test [22] and the combined multivariate and collaps-ing (CMC) [17] do not take association directions into account. This could result in power loss in detecting associations, especially in the presence of CVs and/or in the presence of both harmful and protective influences. Secondly, methods that adopt a weighting scheme based on MAF, such as WSS [19], VT [23], sequence kernel association test (SKAT), where two types of weighting schemes (the beta density weight function, SKATb; and the equal weigh function, SKAT1) are suggested [24], the optimal test of the SKAT (SKAT-O) [25], andwSSU [15], may misclassify signal CVs as noise variants (orvise versa), during the collapsing procedure. In ad-dition, the rarer allele frequencies do not always imply the higher associations. Thus, these methods might be sometimes difficult to identify a signal RV, in particular when the RV is even rarer in normal population than in affected samples [26]. We noticed that Ionita-Laza et al [11] further modified the SKAT [24] to detect both CVs and RVs, which considered the weighted sum as the test statistic (named SKAT-A and SKAT-C). The SKAT-A and SKAT-C combine SKAT tests with adaptive sum test [27] and sum test [22], respectively, for the joint ef-fects of RVs and CVs. Thirdly, methods that adopt a weighting scheme using odds ratio (OR), such as OR weighted sum test (ORWSS) [16], often suffer from the problem of unstable
102-2628-M-002-005-MY2) and National Health Research Institute (NHRI-EX102-9918NC) grants to Dr. P-H Kuo (PI). The authors would also like to acknowledge the GAW grant, R01 GM031575. Preparation of the Genetic Analysis Workshop 17 Simulated Exome Data Set was supported in part by NIH R01 MH059490 and used sequencing data from the 1000 Genomes Project (www.1000genomes.org). The funders had no role in study design, data collection and analysis, decision to publish, or preparation of the manuscript.
estimation due to sparse or empty cells in the tables for estimating OR for genetic effects, even after the adjustment in adding 0.5 to each cell of contingency table, especially when only RVs are present (this phenomenon is also observed in our simulation results). Finally, KBAC [9] clusters variants together based on combinations of genotypes. However, the number of combi-nations will be largely increased if too many variants are present, and it is difficult to specify which combinations are causal.
In this study, we reviewed recently proposed methods for the detection of disease associa-tions for both CVs and RVs for comparisons. To overcome aforementioned methodological limitations, we also proposed a class of new methods based ont-statistic, to account for associa-tion direcassocia-tions, the magnitude of associaassocia-tion, and the presence of noise variants. In addiassocia-tion, we utilized a“filtering algorithm”with or without a threshold to collapse information of rare variants collectively in detecting disease associated variants. In the cases where rare and com-mon variants altogether contribute to the etiology of complex traits, our new methods had higher power in detecting signal variants. We conducted a series of simulations to evaluate de-tection power in different scenarios, including linkage disequilibrium (LD) structure among variants, association directions, MAF distribution of RVs, and the ratio of signal and noise vari-ants. In addition, we applied our method to the Genetic Analysis Workshop 17 (GAW17) data-set to evaluate the performance of our method.
Methods
The GWSS Method
One major aim of this research is to propose a robust test method to overcome the difficulties en-countered by existing methods. In view of the robustness, we aim to extend the idea of WSS with-out specifying any distributional assumption, which includes two core components. First, a weighted sum of RVs is used to aggregate the rare information. Commonly used weights include MAF and OR, but they will suffer the problem of low power as mentioned in the previous sec-tion. Second, with the aggregated variants, a summary measure is adopted to obtain the final ge-netic scores and the correspondingp-values. From these two considerations, we propose a generalized weighted sum statistic (GWSS), which includes various existing methods as special cases. Note that most of existing methods need a predetermined value for MAF to define“rare variants”. We believe that a data-driven approach for defining rare variants is more suitable, es-pecially in the presence of signal CVs. We thus also incorporate the idea of VT [23] into GWSS (see Step 3 of the GWSS algorithm below). It is the data-driven weighting scheme that makes GWSS possible to simultaneously consider the effects of CVs and RVs. To formally describe GWSS, we consider a case-control study that examineskvariants withnsubjects (n1cases andn0 controls). For subjecti, letGij2{0,1,2} be the number of minor allele in variantjandDi2{1,0} be the disease status (yes/no). For variantj, letqjbe its adjusted MAF [19] in the control group, and letORjbe its estimated odds ratio. The algorithm of GWSS is described below.
GWSS Algorithm:
1. Given a thresholdθof MAF, obtaining the aggregated genotype for each subjecti
asGiðyÞ ¼ Xk
j¼1
fwjIðqjyÞgGij, wherewjis one of the following four possible weights:
• wMAF
j ¼
1
ffiffiffiffiffiffiffiffiffiffiffiffiffiffiffiffi n0qjð1 qjÞ
p
• wOR
j ¼logðORjÞ
• wD
j ¼signðw OR
• wDW
j ¼wDj wMAFj ¼f
IðORj>1Þ IðORj<1Þg
ffiffiffiffiffiffiffiffiffiffiffiffiffiffiffiffi n0qjð1 qjÞ
p
2. Based onfGiðyÞ;Digni¼1, calculate the summary statisticSθusing one of the following two
summary measures:
• rank-sum: X
i2fDi¼1g
rankfGiðyÞg
• t-sum: jmeanfGiðyÞjDi¼1g meanfGiðyÞjDi¼0gj
ffiffiffiffiffiffiffiffiffiffiffiffiffiffiffiffiffiffiffiffiffiffiffiffiffiffiffiffiffiffiffiffiffiffiffiffiffiffiffiffiffiffiffiffiffiffiffiffiffiffiffiffiffiffiffiffiffiffiffiffiffiffi VarfGiðyÞjDi¼1g=n1þVarfGiðyÞjDi¼0g=n0
p
3. Ifθis known a priori, defineS=Sθ. Otherwise, repeat Steps 1–2 for allθ2Θand calculate S= supθ2ΘSθas the summary statistic, whereΘis a predetermined set of possible values ofθ.
4. Obtain the empiricalp-value ofSvia randomly permuting the disease status, while keeping the case/control ratio constant.
The robustness nature of GWSS is threefold as described below:
1. The weightwMAF
j , which has been used in constructing WSS [19], implicitly assumes that
RVs are more likely to be associated with disease. However,wMAFj is limited to detect only harm-ful association but ignores the protective one. Further, Feng et al. [16] proposed ORWSS, which used the weightwORj to estimate association strength and directions simultaneously. Un-fortunately,wOR
j suffers the problem of instability in estimating the association strength of RVs.
It therefore motivates us to propose the weightwDj, which is a special case of aSum when setting the cutoff as 1 [27,28], that considers the direction of OR but ignores the information of strength. The information of strength, however, does play a role in affecting the testing perfor-mance. In view of this point, instead of using the unstably estimated OR directly, we propose the weightwDWj that incorporates the information of strength in a robust manner. To see this, we prove that |OR-1| and |log(OR)| are both decreasing functions of the MAF of the control group under the assumption of rare disease (seeS1 Appendixfor the proof). This result implies that
wMAF
j can be used as a surrogate for the association strength. As a result, the weightwDWj ¼
wDj wMAFj provides a more robust estimation in both association strength (i.e.,wMAFj ) and di-rection (i.e.,wD
j), and is able to detect the signal variants with both harmful and protective
asso-ciations. We note that any weight function can be used in our GWSS. For example, we can also use the beta density weight function of SKAT [24] as wj.
2. In Step 2, based on the aggregated genotypeGi(θ) for each subjecti, two summary measures offGiðyÞgni¼1, the“rank-sum”and“t-sum”, are considered. The“rank-sum”statistic, which
borrows the idea of the Wilcoxon rank-sum statistic, is robust against model assumptions, but at the cost of being less efficient when the distributional assumption is valid. Thus, when the sample size is moderate (i.e., the normal assumption is approximately hold), we suggest to use the more efficient“t-sum”to summarize information.
3. Before implementing WSS, a thresholdθfor defining RVs should be determined. The same idea is also used in GWSS, which involves the indicator functionI(qjθ) in Step 1 of GWSS algorithm. This indicator function, however, ignores all variants with MAF>θ, which will lose detection power in the presence of signal CVs. Needless to say, it is also hardly the case that researchers have prior knowledge about the value of suchθ. It turns out that a data-driven approach for determiningθis preferable. We thus follow the idea of VT to use the maximum value ofSθamong possible values ofθ(see Step 3) as the summary
sta-tistic, which is able to adapt to various situations of signal/noise RVs and CVs (i.e., is more robust than using a predetermined thresholdθ).
and ORWSS,“D”denotes the method usingwD
j and“DW”denotes the method usingw DW
j in
Step 1,“t”denotes the method usingt-sum in Step 2, and“V”denotes the method that taking maximum overθin Step 3.
Simulation Studies
Simulation Settings
We conducted simulation studies to compare the performance of the proposed GWSS with ex-isting methods. Assume that a study examineskSNPs with 500 cases and 500 controls. Two settings for MAF (denoted byMAFj) of RV were considered. For the case of identical distribu-tion, signal and noise RVs were both generated from Uniform(0.001, 0.01). For the case of dif-ferent distributions, signal and noise RVs were generated from Uniform(0.001, 0.005) and Uniform(0.001, 0.01), respectively, i.e. the MAFs of signal variants are lower than noise vari-ants [28]. CVs are generated from Uniform(0.01, 0.1) in both cases. Conditional onMAFj, let the latent vectorZið‘Þ¼ ðZð
‘Þ
i1;. . .;Z
ð‘Þ
ikÞ T
; ‘¼1;2;be independent and follow a multivariate normal distribution with mean zero andCovðZðiu‘Þ;Z
ð‘Þ
iv Þ ¼rju vj, and
defineGij¼X
2
‘¼1
IfZijð‘Þ F 1
ðMAFjÞg, whereρis a LD measure index [29] andF() represents
the cumulative distribution function of standard normal. The positions of signal/noise RVs/ CVs are also randomly specified (the same assumption was adopted in Basu & Pan, 2011). Fi-nally, the disease statusDiis generated from the logistic regression model
LogitfPrðDi¼1jGÞg ¼Logitð0:05Þ þ ð
X
4
j¼1
logðORjÞ GijÞ þlogð3Þ Ið
X
8
j¼5
Gij>0Þ:
This regression model is designed so that the background disease prevalence is 0.05 with 8 sig-nal variants andk−8 noise variants. The effects of SNP 1–4 are additive, and the effects of
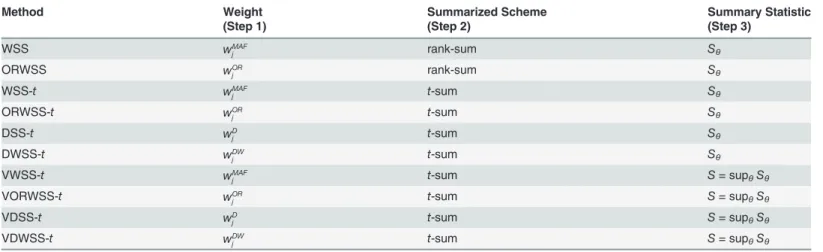
SNP 5–8 are non-additive. As to SNP 5–8, the effect is 3 if any of the SNP 5–8 has mutation. We note that the non-additive effect of multi-markers may be jointly incorporated in haplo-types [30] to capture the combined effects of variants signals, and this setting is to reflect a situ-ation where no specific mutation is necessary but any of them is sufficient to increase the risk of disease. We consider different combinations of the following situations: (1)ρ= 0 or 0.7 for Table 1. Various test methods of the generalized weighted sum statistic (GWSS).
Method Weight Summarized Scheme Summary Statistic
(Step 1) (Step 2) (Step 3)
WSS wMAF
j rank-sum Sθ
ORWSS wOR
j rank-sum Sθ
WSS-t wMAF
j t-sum Sθ
ORWSS-t wOR
j t-sum Sθ
DSS-t wD
j t-sum Sθ
DWSS-t wDW
j t-sum Sθ
VWSS-t wMAF
j t-sum S= supθSθ
VORWSS-t wOR
j t-sum S= supθSθ
VDSS-t wD
j t-sum S= supθSθ
VDWSS-t wDW
j t-sum S= supθSθ
LD between markers; (2)ORjfor (RVs, CVs) is (2, 1.5) or (1/2, 1/1.5); (3)
ðnRV
true;nCVtrue;nRVnoise;nCVnoiseÞ ¼(8, 0, 0, 0), (8, 0, 8, 0), (8, 0, 4, 4), (7, 1, 8, 0) and (7, 1, 4, 4), wherenRVtrue, nCV
true,nRVnoiseandnCVnoiserepresents the number of signal RVs, signal CVs, noise RVs, and noise CVs,
respectively, andk¼nRV trueþn
CV trueþn
RV noiseþn
CV
noise; and (4) same or different MAF distribution for
signal and noise RVs. For all methods, the empiricalp-values are calculated based on 500 per-mutations. The detection power is calculated as the proportion of test statistic attained signifi -cance level of 0.05 over 1000 simulation datasets.
Results
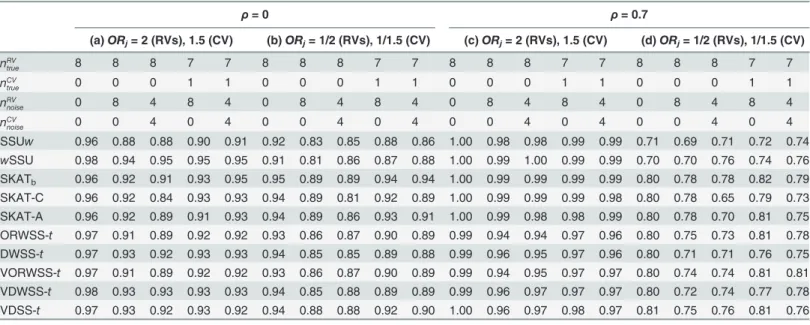
S1 Tableshows that the type I errors of all methods under each setting are controlled at the level of 0.05, except for the CMC method. Thus, we used the empiricalp-value for CMC statis-tic instead in the following simulation. We only present methods with better performance in the Tables, including five existing methods (SSUw,wSSU, SKATb, SKAT-C, SKAT-A) and five tests of our GWSS method (ORWSS-t, DWSS-t, VORWSS-t, VDWSS-tand VDSS-t). The re-sults of comparisons with other methods are listed in the Supporting Tables.Table 2andS2 Tabledemonstrate detection power for identical MAF distributions of signal and noise RVs. Details are described below under different scenarios.
Harmful Association Direction Without LD (
ρ
= 0)
InTable 2andS2 Table(column (a)), when there are only RVs, detection powers of almost all methods are larger than 95%. Among methods, Sum test, KBAC, WSS and WSS-thave the best performance. When there are noise variants, MAF-based methods such aswSSU, VT, WSS-t, and VWSS-thave better performances than others, since the noise CVs are down-weighted by the value of MAF in these methods. In contrast, the detection powers of SSU, Sum Test, KMR, C-alpha, SKAT1(SKAT with equal weight) and DSS-tdecrease dramatically, suggesting that some underlying assumptions in these methods are inappropriate in the presence of noise CVs. Comparing WSS with WSS-tfor which one uses“rank-sum”and the other uses“t-sum”,
WSS-thas better performance than WSS, especially when noise CVs are present. The same pattern
Table 2. Detection power for identical MAF distributions of signal and noise rare variants (only list methods with better performance).
ρ=0 ρ= 0.7
(a)ORj= 2 (RVs), 1.5 (CV) (b)ORj= 1/2 (RVs), 1/1.5 (CV) (c)ORj= 2 (RVs), 1.5 (CV) (d)ORj= 1/2 (RVs), 1/1.5 (CV)
nRV
true 8 8 8 7 7 8 8 8 7 7 8 8 8 7 7 8 8 8 7 7
nCV
true 0 0 0 1 1 0 0 0 1 1 0 0 0 1 1 0 0 0 1 1
nRV
noise 0 8 4 8 4 0 8 4 8 4 0 8 4 8 4 0 8 4 8 4
nCV
noise 0 0 4 0 4 0 0 4 0 4 0 0 4 0 4 0 0 4 0 4
SSUw 0.96 0.88 0.88 0.90 0.91 0.92 0.83 0.85 0.88 0.86 1.00 0.98 0.98 0.99 0.99 0.71 0.69 0.71 0.72 0.74 wSSU 0.98 0.94 0.95 0.95 0.95 0.91 0.81 0.86 0.87 0.88 1.00 0.99 1.00 0.99 0.99 0.70 0.70 0.76 0.74 0.76 SKATb 0.96 0.92 0.91 0.93 0.95 0.95 0.89 0.89 0.94 0.94 1.00 0.99 0.99 0.99 0.99 0.80 0.78 0.78 0.82 0.79
SKAT-C 0.96 0.92 0.84 0.93 0.93 0.94 0.89 0.81 0.92 0.89 1.00 0.99 0.99 0.99 0.98 0.80 0.78 0.65 0.79 0.73 SKAT-A 0.96 0.92 0.89 0.91 0.93 0.94 0.89 0.86 0.93 0.91 1.00 0.99 0.98 0.98 0.99 0.80 0.78 0.70 0.81 0.75 ORWSS-t 0.97 0.91 0.89 0.92 0.92 0.93 0.86 0.87 0.90 0.89 0.99 0.94 0.94 0.97 0.96 0.80 0.75 0.73 0.81 0.78 DWSS-t 0.97 0.93 0.92 0.93 0.93 0.94 0.85 0.85 0.89 0.88 0.99 0.96 0.95 0.97 0.96 0.80 0.71 0.71 0.76 0.75 VORWSS-t 0.97 0.91 0.89 0.92 0.92 0.93 0.86 0.87 0.90 0.89 0.99 0.94 0.95 0.97 0.97 0.80 0.74 0.74 0.81 0.81 VDWSS-t 0.98 0.93 0.93 0.93 0.93 0.94 0.85 0.88 0.89 0.89 0.99 0.96 0.97 0.97 0.97 0.80 0.72 0.74 0.77 0.78 VDSS-t 0.97 0.93 0.92 0.93 0.92 0.94 0.88 0.88 0.92 0.90 1.00 0.96 0.97 0.98 0.97 0.81 0.75 0.76 0.81 0.76
exists between ORWSS and ORWSS-t. This observation suggests that, in the presence of noise CVs and with moderate sample size, using“t-sum" to obtain the summary score is able to ex-tract more information and, hence, is more efficient than using“rank-sum”.
As mentioned in the Introduction section, OR provides information of both association strength and directions, but OR-based weighting scheme might result in loss of power due to the unstable estimation of association strength with sparse data in tabulated genotypic data (i.e. a contingency table). Taking two special cases of GWSS, ORWSS-t(using the weightwOR
j ) and
DSS-t(using the weightsignðwOR
j Þ) to exemplify. When there are only RVs involved, we observe
that DSS-tsuffices to have better performance than ORWSS-t. On the other hand, when noise CVs exist, ORWSS-tand DWSS-thave better performances than DSS-t, indicating that the strength of association can assist the detection process when it can be estimated well. More-over, we can observe that VDSS-thas a better performance than DSS-tin the presence of CVs. It indicates that, whether the CVs exist or not, the VT approach is able to improve the detection power even we do not estimate the association strength directly.
Opposite Association Directions Without LD (
ρ
= 0)
Simulation results are provided inTable 2andS2 Table(column (b)). It can be seen that vari-ants protectively associated with disease can be detected by SSU, KBAC, KMR, C-alpha, and SKAT-type methods (including SKAT1, SKATb, SKAT-C and SKAT-A) if there is no noise CV. In the presence of noise CVs, SSUw(assuming the variance of each variant does not equal to one),wSSU (assigning small weight to noise CVs), SKATb(SKAT using beta(1,25) density function evaluated atqjas the weight) and SKAT-C/A (using an optimal weight for combining CV and RV test statistics) perform better as expected. As to the class of GWSS methods, ORWSS-t, DWSS-t, VORWSS-t, VDWSS-tand VDSS-tperform well uniformly in all situa-tions. These results reveal that using OR-based weighting (wOR
j ,w DW
j ) is able to detect
associa-tions for both harmful and protective effects. Besides, when the weight itself has the ability to identify association directions, the corresponding VT-version methods (e.g. VORWSS-t, VDWSS-t, and VDSS-t) still have improved performances. In contrast, we observe power losses in Sum Test, CMC-p (cutoff-point is fixed at 0.01), WSS-tand VWSS-twhen opposite associa-tion direcassocia-tions are present. The failure to detect associaassocia-tions using Sum Test and CMC-p is due to the offset of harmful and protective effects during the summation process. The power losses in WSS-tand VWSS-tare because the weightwMAF
j has no ability to assist identifying protective
associations. Comparing with WSS-t, WSS using rank-sum is less affected by the presence of RVs with opposite directions and has a higher detection power than using“t-sum”, which is a benefit of using the more robust“rank-sum”summary measure.
With LD (
ρ
= 0.7)
S2 Tablecolumn (c)). On the other hand, when both harmful and protective variants exist si-multaneously, the signals become weaker and are not easy to be detected (Table 2andS2 Table column (d)), due to the offset of opposite association effects.
Different MAF Distributions of Signal/Noise RVs
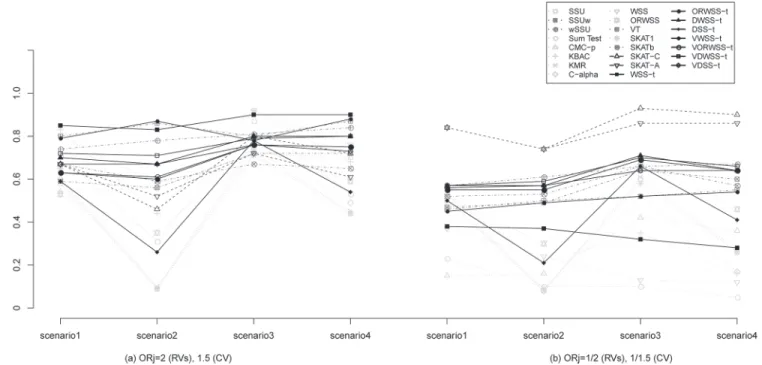
S3 Tabledemonstrates the Type I errors and detection powers under different MAF distribu-tions between signal and noise RVs. Comparing to the scenarios (Fig 1andS3 Table) with identical MAF distribution (please see results inTable 2andS2 Table), we found almost the same patterns in all methods. Moreover, we found that VT and WSS-tusing MAF-based weighting scheme outperform other methods in OR>1 scenario (S3 Tablecolumn (a)), since the noise variants are down-weighted by MAF. Although both SKAT-C and SKAT-A perform worse than GWSS andwSSU in the scenarios of different MAF distribution across CVs and RVs with OR>1(S3 Tablecolumn (a)), they outperform other methods in OR<1 scenario (S3 Tablecolumn (b)). It reveals the non-robustness of SKAT-C/A, whose performances will be heavily affected by the varying situations. As expected, the detection powers of VT and WSS-t
for detecting signal CVs with protective associations are low. On the other hand, the proposed DWSS-tand VDWSS-ttake into account the association strength and direction as well as the MAF distributions of RVs, and are detected to perform well in all situations. Notably, in com-parison with the scenarios of identical MAF distribution for both noise and signal RVs (see Table 2andS2 Tablecolumns (a), (b)), all methods encounter a dramatically decline in power (Fig 1andS3 Tablecolumns (a), (b)). One reason is that the MAF distributions of signal RVs Fig 1. Detection power (ρ= 0) for different MAF distributions of signal and noise rare variants.The left panel considers ORj= 2 for rare variants (RVs)
and 1.5 for common variant (CV), and the right panel considers ORj= 1/2 for RVs and 1/1.5 for CV. Each panel considers four scenarios: scenario1 considers
8 signal RVs and 8 noise RVs; scenario2 considers 8 signal RVs, 4 noise RVs and 4 noise CVs; scenario3 considers 7 signal RVs, 1 signal CV and 8 noise RVs; and scenario4 considers 7 signal RVs, 1 signal CV, 4 noise RVs and 4 noise CVs. The results were based on 1000 subjects (500 cases and 500 controls). All empiricalp-values were calculated from 500 permutations. The detection power is defined as the proportion of test statistic attained significant level 0.05 over 1000 simulations. CMC method use 0.01 as a threshold for rare variants. SKAT1and SKATbrepresents SKAT using equal weight and using
beta(1,25) density function evaluated atqjas the weight, respectively. SKAT-C and SKAT-A combined SKAT and sum test and adaptive sum test, respectively.
in the scenario of different MAF distributions (i.e. MAF~Uniform(0.001,0.005)) are rarer than those in the scenario of identical MAF distributions (i.e. MAF~Uniform(0.001,0.01)), and thus, the signals are more difficult to be identified.
Summary of Simulation Studies
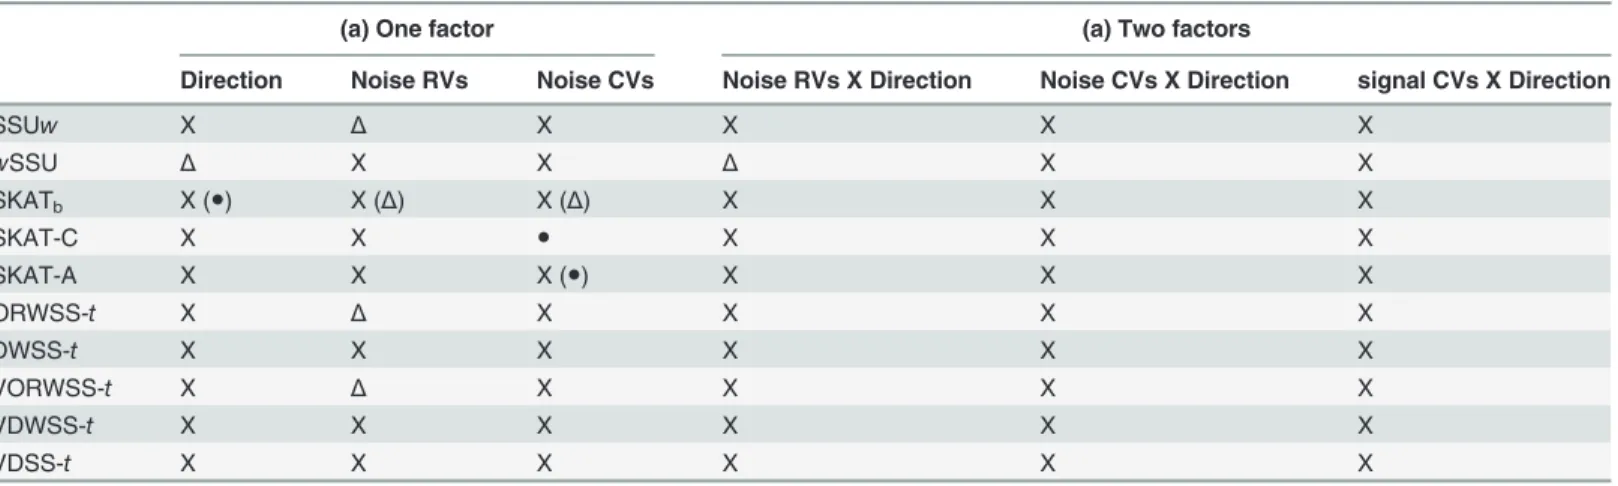
We summarize the simulation results for the performances of all methods under different sce-narios inTable 3andS4 Table. The power differences across all methods in different scenarios are first calculated. We classify a method to be sensitive (●), slightly sensitive (Δ), or non-sensi-tive (X) if the difference is larger than 0.1, between 0.05 and 0.1, or less than 0.05, respecnon-sensi-tively. We found that the decline in power is mainly caused by opposite association directions and the presence of noise CVs, followed by the presence of noise RVs (Table 3andS4 Tablecolumn (a)). We also evaluate the influences of two factors simultaneously (association directions and the existence of noise variants) inTable 3andS4 Tablecolumn (b). For instance, KBAC is less sensitive in the presence of opposite directions and noise CVs, but it has worse performance when both factors exist simultaneously. Moreover, the MAF distributions of signal and noise variants have impacts on the detection power. For example, ORWSS and SKAT are robust to the presence of opposite directions for identical MAF distributions, but are not robust for dif-ferent MAF distributions. It is also found that the performance of SKAT is sensitive to the se-lection of the weight function, since SKAT1and SKATbhave totally different behaviors. SKAT-C and SKAT-A are also sensitive to the existence of noise variants, MAF distributions, the association directions, and the chosen weight function. In general, the performances of DWSS-t, VDWSS-t, andwSSU are robust against the association directions and the presence/ absence of signal /noise CVs.
It can be seen thatwSSU and VDWSS-thave comparable performances, and are the best performers among all methods. We should emphasize thatwSSU assumes the validity of a lo-gistic regression model, and thus a good performance is expected under our simulation set-tings. On the other hand, VDWSS-tis totally nonparametric tests that does not require any model specification, and is robust to various situations of MAF and signal /noise variants. As a result, VDWSS-tis expected to be more applicable in practice since it is rarely the case that we know what the true model is.
Table 3. Robustness of all methods in situations of identical/different MAF distributions of signal and noise rare variants (only list methods with better performance).
(a) One factor (a) Two factors
Direction Noise RVs Noise CVs Noise RVs X Direction Noise CVs X Direction signal CVs X Direction
SSUw X Δ X X X X
wSSU Δ X X Δ X X
SKATb X (●) X (Δ) X (Δ) X X X
SKAT-C X X ● X X X
SKAT-A X X X (●) X X X
ORWSS-t X Δ X X X X
DWSS-t X X X X X X
VORWSS-t X Δ X X X X
VDWSS-t X X X X X X
VDSS-t X X X X X X
Application
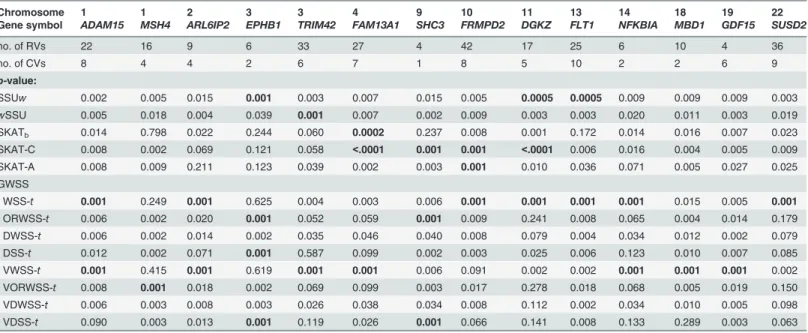
To evaluate the performance of our GWSS method, we used the GAW17 mini-exome dataset (http://www.gaworkshop.org/gaw17, without true answers). The GAW17 dataset consists of 697 unrelated individuals, each of whom provided genotypes (in total 24,487 SNPs assigned to 3,205 genes) that were sequenced from the 1000 Genomes Project (http://www.1000genomes. org). The simulated phenotypes used binary disease status that was generated for each individ-ual (Almasy et al., 2011). We calculated association p-values for disease affected status based on 1000 permutations. We compared our GWSS method to a few commonly implemented methods, including SSUw, WSS, ORWSS, VT, and SKAT-type methods (results are shown in Table 4andS5 Table).
To conduct the association tests of the GAW17 data, only genes that (1) had significantp -value0.001 detected in at least one of the GWSS, SSUwand SKAT-C/A methods, and (2) con-sisted of at least one RV and CV were considered. We listed fourteen genes that showed signifi-cantly aggregated signals to the disease affected status inTable 4andS5 Table. Eight genes
(ARL6IP2,TRIM42,SHC3,FRMPD2,NFKBIA,MBD1,GDF15andSUSD2) had the smallestp
-value detected by one of our GWSS method (i.e., WSS-t, ORWSS-t, VWSS-tand VDSS-t). The
p-values of the other six genes (ADAM15,MSH4,EPHB1,FAM13A1,DGKZandFLT1) were also ranked in the top three among all methods. We found that SKAT-type methods performed well (p-values0.001) in seven genes, but completely failed to detect signals for three genes
(APL6IP2,TRIM42andNFKBIA). Notably, three genes (ARL6IP2,NFKBIAandMBD1) can
only be detected by our WSS-tand VWSS-t. These results suggested that our GWSS method had good performance among all methods. Taken together, we concluded that our GWSS method robustly showed good performance under different scenarios.
Discussion
Various statistical testing strategies have been developed for identifying associations between RVs and complex disease traits [9,15–19,21,23,24]. With noted limitations in existing methods, we developed a robust GWSS method to identify rare and common disease-related variants Table 4. Effects of disease liability using the Genetic Analysis Workshop 17 data (only list methods with better performance).
Chromosome 1 1 2 3 3 4 9 10 11 13 14 18 19 22
Gene symbol ADAM15 MSH4 ARL6IP2 EPHB1 TRIM42 FAM13A1 SHC3 FRMPD2 DGKZ FLT1 NFKBIA MBD1 GDF15 SUSD2
no. of RVs 22 16 9 6 33 27 4 42 17 25 6 10 4 36
no. of CVs 8 4 4 2 6 7 1 8 5 10 2 2 6 9
p-value:
SSUw 0.002 0.005 0.015 0.001 0.003 0.007 0.015 0.005 0.0005 0.0005 0.009 0.009 0.009 0.003
wSSU 0.005 0.018 0.004 0.039 0.001 0.007 0.002 0.009 0.003 0.003 0.020 0.011 0.003 0.019 SKATb 0.014 0.798 0.022 0.244 0.060 0.0002 0.237 0.008 0.001 0.172 0.014 0.016 0.007 0.023
SKAT-C 0.008 0.002 0.069 0.121 0.058 <.0001 0.001 0.001 <.0001 0.006 0.016 0.004 0.005 0.009 SKAT-A 0.008 0.009 0.211 0.123 0.039 0.002 0.003 0.001 0.010 0.036 0.071 0.005 0.027 0.025 GWSS
WSS-t 0.001 0.249 0.001 0.625 0.004 0.003 0.006 0.001 0.001 0.001 0.001 0.015 0.005 0.001
ORWSS-t 0.006 0.002 0.020 0.001 0.052 0.059 0.001 0.009 0.241 0.008 0.065 0.004 0.014 0.179 DWSS-t 0.006 0.002 0.014 0.002 0.035 0.046 0.040 0.008 0.079 0.004 0.034 0.012 0.002 0.079 DSS-t 0.012 0.002 0.071 0.001 0.587 0.099 0.002 0.003 0.025 0.006 0.123 0.010 0.007 0.085 VWSS-t 0.001 0.415 0.001 0.619 0.001 0.001 0.006 0.091 0.002 0.002 0.001 0.001 0.001 0.002 VORWSS-t 0.008 0.001 0.018 0.002 0.069 0.099 0.003 0.017 0.278 0.018 0.068 0.005 0.019 0.150 VDWSS-t 0.006 0.003 0.008 0.003 0.026 0.038 0.034 0.008 0.112 0.002 0.034 0.010 0.005 0.098 VDSS-t 0.090 0.003 0.013 0.001 0.119 0.026 0.001 0.066 0.141 0.008 0.133 0.289 0.003 0.063
simultaneously. The proposed GWSS method works well under most of the simulated scenari-os. Comparing with existing methods, GWSS can correctly control the type-I error rate and achieve high detection powers under harmful and/or protective association settings, when LD structures among variants are absent (i.e.ρ= 0) or present (i.e.ρ= 0.7) (Table 2andS2 Table).
Many existing methods suffer from low to moderate power loss when noise variants (rare or common) are present. The presence of noise variants can dramatically decrease the detection powers and increase the false positive results, which further complicate the interpretations of the analysis results. Importantly, by incorporating the idea of VT, our GWSS method can sepa-rate signal variants from noise ones in a data-driven approach. In practice, noise may also be introduced from calling rare variants and using imputed genotypes [7]. Methods like our GWSS can help to combine information from both RVs and CVs and further provide a basis to enhance our understanding of complex trait genetics.
Power loss may also occur when using methods assuming the same effect direction of vari-ants, since in reality both risk and protective variants are present [31]. It is easy to see that risk effects are neutralized by protective effects in Sum Test and CMC-p methods. Similarly, meth-ods using MAF as a weighting scheme, such as VT, WSS-t, and VWSS-tignore associations with protective effects (i.e. OR<1), also encounter power loss. Although the protective associa-tions can be detected by using OR as the weighting scheme, the unstable estimation of OR arises another difficulty. The newly proposed VDWSS-texhibits a more robust estimation in both association strength and direction, which are more applicable in many situations.
The power of association testing also depends on the pattern of LD among markers [32], since noise variants may be associated with a signal variant due to LD. High LD among RVs and CVs often makes it difficult to detect which variants are the true association signals, and causes loss in detection power. In particular, when high LD exists among RVs (including both harmful and protective variants), a huge loss in power is observed due to restricted signals [15]. This situation is also found in our simulation studies. A dramatic power loss can be found in opposite association directions when noise variants are additionally present (Table 2andS2 Tablecolumn (d)). The comprehensive influences of LD structures among variants in RVs de-tection need further studies.
It is found that WSS-tand ORWSS-tperformed better than WSS and ORWSS, suggesting that the use of“t-sum”is beneficial especially when CVs are present. One reason is that“t -sum”utilizes more information than“rank-sum”, through considering both the mean shift and variation. In particular, when only RVs are involved and all variants have harmful effects, most of the genotypes are common homozygotes (i.e.Gij= 0) and the aggregated genotypes (i.e.
Gi(θ)) close to zero in most of the subjects, forming a right-skewed distribution. In this situa-tion,“rank-sum”is more appropriate due to its robustness against the normality assumption. Similarly, when the assumption of the same association direction among variants was violated, both WSS and WSS-thad poor performance, while the rank-sum slightly improved the detec-tion power. In contrast, when CVs are involved (i.e. fewer cells with zero value show in tables of genotyping data) with moderate sample size, the distribution of aggregated genotypes would approximately follow the normal distribution, so using“t-sum”is suitable.
distribution (Table 2andS2 Table), but SKAT is not a good performer under different MAF distribution (Fig 1). We should emphasize that our GWSS adopts a robust weight function that is able to adapt to various situations, which is more applicable in practice. Additionally, the cal-culation of GWSS is not time-consuming. In fact, GWSS without using varying threshold val-ues has very similar computational time to WSS. For one simulation data used in our
Simulation section, it costs about 2 minutes to obtainp-values. When a varying threshold method is implemented, the calculation can still be completed within 6 minutes.
Due to the nonparametric nature of GWSS, however, currently there is no simple method to adjust for the effects of potential covariates, except the stratification method where one can im-plement GWSS within the strata. It is of great interest to extend GWSS to accommodate to in-clude potential covariates.
In conclusion, our results demonstrated that the newly proposed GWSS method is able to deal with variants with bidirectional effects and association strength successfully. The GWSS can aggregate information from both CVs and RVs automatically even there is no prior knowl-edge. The GWSS also takes into account different LD patterns, numbers of signal/noise vari-ants, and association directions. The GWSS can be applied to genome-wide sequence data to assist with the identification of signals of both common and rare variants, and to enhance our understanding of complex trait genetics.
Supporting Information
S1 Appendix.(DOC)
S1 Table. Type I error (significant level = 0.05). (DOC)
S2 Table. Detection power for identical MAF distributions of signal and noise rare variants (other methods).
(DOC)
S3 Table. Type I error (significant level = 0.05) and detection power (ρ= 0) for different
MAF distributions of signal and noise rare variants. (DOC)
S4 Table. Robustness of all methods in situations of identical/different MAF distributions of signal and noise rare variants (other methods).
(DOC)
S5 Table. Effects of disease liability using the Genetic Analysis Workshop 17 data (other methods and details of the GWSS method).
(DOC)
Acknowledgments
Author Contributions
Conceived and designed the experiments: PHK HH CFK JRL. Performed the experiments: CFK JRL PHK HH. Analyzed the data: JRL CFK. Contributed reagents/materials/analysis tools: JRL CFK. Wrote the paper: CFK JRL. Revised manuscript critically for important intel-lectual content: PHK CFK HH JRL.
References
1. Manolio TA, Collins FS, Cox NJ, Goldstein DB, Hindorff LA, Hunter DJ, et al. Finding the missing herita-bility of complex diseases. Nature. 2009; 461: 747–753. doi:10.1038/nature08494PMID:19812666
2. Maher B. Personal genomes: the case of the missing heritability. Nature. 2008; 456: 18–21. doi:10.
1038/456018aPMID:18987709
3. Ahituv N, Kavaslar N, Schackwitz W, Ustaszewska A, Martin J, Hebert S, et al. Medical sequencing at the extremes of human body Mass. Am J Hum Genet. 2007; 80: 779–791. PMID:17357083
4. Walsh T, McClellan JM, McCarthy SE, Addington AM, Pierce SB, Cooper GM, et al. Rare structural var-iants disrupt multiple genes in neurodevelopmental pathways in schizophrenia. Science. 2008; 320: 539–543. doi:10.1126/science.1155174PMID:18369103
5. Azzopardi D, Dallosso AR, Eliason K, Hendrickson BC, Jones N, Rawstorne E, et al. Multiple rare non-synonymous variants in the adenomatous polyposis coli gene predispose to colorectal adenomas. Cancer Research. 2008; 68: 358–363. doi:10.1158/0008-5472.CAN-07-5733PMID:18199528
6. Visscher PM, Goddard ME, Derks EM, Wray NR. Evidence-based psychiatric genetics, AKA the false dichotomy between common and rare variant hypotheses. Mol Psychiatry. 2012; 17: 474–485. doi:10.
1038/mp.2011.65PMID:21670730
7. Asimit J, Zeggini E Rare variant association analysis methods for complex traits. Annu Rev Genet. 2010; 44: 293–308. doi:10.1146/annurev-genet-102209-163421PMID:21047260
8. Ionita-Laza I, Buxbaum JD, Laird NM, Lange C. A new testing strategy to identify rare variants with ei-ther risk or protective effect on disease. PLoS Genet. 2011; 7: 1–6.
9. Liu DJ, Leal SM. A novel adaptive method for the analysis of next-generation sequencing data to detect complex trait associations with rare variants due to gene main effects and interactions. PLoS Genet. 2010; 6: 1–14.
10. Wang K, Dickson SP, Stolle CA, Krantz ID, Goldstein DB, Hakonarson H. Interpretation of association signals and identification of causal variants from genome-wide association studies. Am J Hum Genet. 2010; 86: 730–742. doi:10.1016/j.ajhg.2010.04.003PMID:20434130
11. Ionita-Laza I, Lee S, Makarov V, Buxbaum JD, Lin X. Sequence kernel association tests for the com-bined effect of rare and common variants. Am J Hum Genet. 2013; 92: 841–853. doi:10.1016/j.ajhg.
2013.04.015PMID:23684009
12. Wessel J, McDonald SM, Hinds DA, Stokowski RP, Javitz HS, Kennemer M, et al. Resequencing of nic-otinic acetylcholine receptor genes and association of common and rare variants with the Fagerstrom test for nicotine dependence. Neuropsychopharmacology. 2010; 35: 2392–2402. doi:10.1038/npp.
2010.120PMID:20736995
13. Nejentsev S, Walker N, Riches D, Egholm M, Todd JA. Rare variants of IFIH1, a gene implicated in anti-viral responses, protect against type 1 diabetes. Science 2009; 324: 387–389. doi:10.1126/science.
1167728PMID:19264985
14. Evans D, Aberle J, Beil F-U. The relative importance of common and rare genetic variants in the devel-opment of hypertriglyceridemia. Expert Rev Cardiovasc Ther. 2011; 9: 637–644. doi:10.1586/erc.11. 53PMID:21615327
15. Basu S, Pan W. Comparison of statistical tests for disease association with rare variants. Genetic Epi-demiology. 2011; 35: 606–619. doi:10.1002/gepi.20609PMID:21769936
16. Feng T, Elston RC, Zhu X. Detecting rare and common variants for complex traits: sibpair and odds ratio weighted sum statistics (SPWSS, ORWSS). Genetic Epidemiology. 2011; 35: 398–409. doi:10.
1002/gepi.20588PMID:21594893
17. Li B, Leal SM. Methods for detecting associations with rare variants for common diseases: application to analysis of sequence data. Am J Hum Genet. 2008; 83: 311–321. doi:10.1016/j.ajhg.2008.06.024 PMID:18691683
18. Liu D, Ghosh D, Lin X. Estimation and testing for the effect of a genetic pathway on a disease outcome using logistic kernel machine regression via logistic mixed models. BMC Bioinformatics. 2008; 9: 292.
19. Madsen BE, Browning SR. A groupwise association test for rare mutations using a weighted sum statis-tic. PLoS Genet. 2009; 5: 1–11.
20. Morgenthaler S, Thilly WG. A strategy to discover genes that carry multi-allelic or mono-allelic risk for common diseases: A cohort allelic sums test (CAST). Mutation Research. 2007; 615: 28–56. PMID: 17101154
21. Neale BM, Rivas MA, Voight BF, Altshuler D, Devlin B, Orho-Melander M, et al. Testing for an unusual distribution of rare variants. PLoS Genet. 2011; 7: 1–8.
22. Pan W. Asymptotic tests of association with multiple SNPs in linkage disequilibrium. Genetic Epidemiol-ogy. 2009; 33: 497–507. doi:10.1002/gepi.20402PMID:19170135
23. Price AL, Kryukov GV, de Bakker PIW, Purcell SM, Staples J, Wei L-J, et al. Pooled association tests for rare variants in exon-resequencing studies. Am J Hum Genet. 2010; 86: 832–838. doi:10.1016/j.
ajhg.2010.04.005PMID:20471002
24. Wu MC, Lee S, Cai T, Li Y, Boehnke M, Lin X. Rare-variant association testing for sequencing data with the sequence kernel association test. Am J Hum Genet. 2011; 89: 82–93. doi:10.1016/j.ajhg.2011.05. 029PMID:21737059
25. Lee S, Emond MJ, Bamshad MJ, Barnes KC, Rieder MJ, Nickerson DA, et al. Optimal Unified Approach for Rare-Variant Association Testing with Application to Small-Sample Case-Control Whole-Exome Se-quencing Studies. Am J Hum Genet. 2012; 91: 224–237. doi:10.1016/j.ajhg.2012.06.007PMID: 22863193
26. Zhang L, Pei Y-F, Hai R, Deng H-W. Testing rare variants for association with diseases: a Bayesian marker selection approach. Ann Hum Genet. 2012; 76: 74–85. doi:10.1111/j.1469-1809.2011.00684.x PMID:22034989
27. Han F, Pan W. A data-adaptive sum test for disease association with multiple common or rare variants. Hum Hered. 2010; 70: 42–54. doi:10.1159/000288704PMID:20413981
28. Pan W, Shen X. Adaptive tests for association analysis of rare variants. Genetic Epidemiology. 2011; 35: 381–388. doi:10.1002/gepi.20586PMID:21520272
29. Chang H, Chuang L, Chang Y, Cheng Y, Hung Y, Chen H, et al. LD2SNPing: linkage disequilibrium
plotter and RFLP enzyme mining for tag SNPs. BMC Genet. 2009; 10: 26. doi: 10.1186/1471-2156-10-26PMID:19500380
30. Su G, Christensen OF, Ostersen T, Henryon M, Lund MS. Estimating additive and non-additive genetic variances and predicting genetic merits using genome-wide dense single nucleotide polymorphism markers. PLoS One. 2012; 7: e45293. doi:10.1371/journal.pone.0045293PMID:23028912
31. Brisbin A, Jenkins GD, Ellsworth KA, Wang L, Fridley BL. Localization of association signal from risk and protective variants in sequencing studies. Front Genet. 2012; 3: 173. doi:10.3389/fgene.2012.
00173PMID:22973297