Analysis by RAPD of the genetic structure of
Astyanax altiparanae
(Pisces, Characiformes) in reservoirs on the Paranapanema River, Brazil
Maria Sueli Papa Leuzzi
1, Fernanda Simões de Almeida
1, Mário Luís Orsi
2and Leda Maria Koelblinger Sodré
11
Universidade Estadual de Londrina, Departamento de Biologia Geral, Laboratório de Marcadores
Moleculares em Peixes e Ecologia de Abelhas, Londrina, PR, Brazil.
2
Universidade Estadual de Londrina, Museu de Zoologia, Departamento de Biologia Animal e Vegetal,
Londrina, PR, Brazil.
Abstract
In this study, the RAPD technique was used to analyze the genetic structure of populations of the fishAstyanax altiparanae (Characidae, Tetragonopterinae) living in the lower, middle and upper Paranapanema River, Brazil. The aim was to assess this structure regarding fish handling and conservation programs. The genetic variability (P) was found to be 42.64%, 75% and 75% in the low, middle and upper reaches, respectively. The dendrogram of genetic similarity, obtained by comparative analysis of the sets of samples from the three sites, showed the formation of three clusters. All of the genetic parameters used indicate that the population in the lower Paranapanema is genetically different from those in the middle and upper sections. The theta P test shows that the low Paranapanema is highly differentiated from the middle (0.2813) and upper (0.2912) Paranapanema, while the differentiation between the last two is moderate (0.0895). The data obtained in the present work suggest that recolonization and conservation studies should not be focused on the speciesA. altiparanae as such, but on the conservation units, because they are the genetically differentiated populations.
Key words:Astyanax altiparanae, RAPD, genetic structure, genetic conservation, fish.
Received: Agust 6, 2003; Accepted: March 5, 2004.
Introduction
The construction of dams for hydroelectric power is one of the most serious environmental changes for species inhabiting either land or water. The reservoirs can cause modifications in the pattern of dispersion of various species of migratory fish (Agostinhoet al., 1992) and, under certain conditions, may lead to the extinction of species that cannot adapt to this kind of change (Godinho and Godinho, 1994). Reduction of dispersion and gene flow may in time alter the relative proportions of the intra- and inter-population com-ponents of diversity (Vrijenhoek, 1998).
The study of genetic variability is of prime impor-tance for genetic approaches to fish conservation or breed-ing, which depend on knowledge of the amount of variation existing in a local reproductive unit (Carvalho, 1993). Ac-cording to Haig (1998), the most important contribution that conservation geneticists can make to the assessment of the viability of populations is to determine the relative
amounts of genetic diversity within and among the popula-tions. Conservation genetics is emerging as a specialty of great value to professionals from other fields working in biodiversity conservation, and collaboration across the var-ious fields has a multiplying effect on the results achieved (Solé-Cava, 2001).
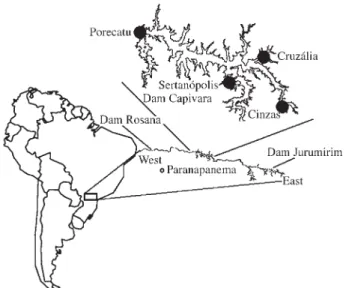
Over the last 50 years, the Paranapanema River, which begins in the east in the Paranapiacaba mountains, amid the virgin Atlantic rainforest and flows into the Paraná river to the west, has suffered enormous human in-tervention with the building of 10 hydroelectric dams, as follows: Piraju (2), Jurumirim, Chavantes, Salto Grande, Canoas I and II, Capivara, Taquaruçu and Rosana. The Capivara reservoir, situated in the middle section of the river, is formed by the Mackenzie Engineering School Hy-droelectric Plant dam and is the biggest on this river, cover-ing 515 km2and holding 10.5 billion cubic meters of water. Very little is known about the species of fish living in it.
Astyanax altiparanae(a species oflambari) is a fish found in the upper Paraná basin which, according to Garutti and Britski (2000), is one of the most important links in the food chain, forming a significant part of the diet of larger fishes as well as being consumed by humans.
www.sbg.org.br
Send correspondence to Leda Maria Koelblinger Sodré. Universi-dade Estadual de Londrina, Centro de Ciências Biológicas, Depar-tamento de Biologia Geral, Caixa Postal 6001, 86051-990 Londrina, PR, Brazil. E-mail: [email protected].
Random amplified polymorphic DNA (RAPD) anal-ysis is a technique based on the polymerase chain reaction (PCR) amplification of discrete regions of genome with short oligonucleotides primers of arbitrary sequence (Welsh and McClelland, 1990; Williamset al.,1990). The method is simple and quick to perform, and most impor-tantly,no priorknowledge of the genetic make-up of the or-ganism in question is required (Hadrys et al., 1992). In fishes, RAPD has been successfully used to supplement systematic and phylogenetic studies (Jayasankar and Dharmalingan, 1997; Callejas and Ochando, 1998; Almeidaet al., 2001; Prioli et al., 2002; Barmanet al.,
2003), in population structure analysis (Dergam et al.,
1998; Sekineet al.,2002; Hatanaka and Galetti Jr., 2003; Almeidaet al., 2003), in fishery management and conser-vation genetics of wild populations (Hatanaka and Galetti JR., 2003; Bártfaiet al.,2003).
The present study is part of an integrated project, the “Biologic characterization and genetic analysis of fish spe-cies from the Capivara Reservoir – Paranapanema river”, whose objective is to broaden the knowledge of biology and the effects of genetic variability on fish distribution to better understand how diversity, within and among popula-tions, is distributed.
The objective of this study was to employ RAPD markers, to gather information on the genetic structure ofA. altiparanaepopulations, at the Capivara Dam (middle) and also in the upper and lower Paranapanema, as an aid to con-servation and stock management of this species in this river.
Materials and Methods
Specimens were collected at four sites at the Capivara Dam, named Cinzas, Cruzália, Porecatu and Sertanópolis, as well as at the Jurumirim Dam (upper) and Rosana Dam (lower) of the Paranapanema river (for map of sites, see Figure 1). Muscle samples were removed from specimens immediately after capture and kept at -20 °C until use. The specimens used in this study are preserved and registered in the Zoology Museum at Londrina State University, Brazil.
DNA extraction and quantification, and Random Amplified Polymorphic DNA (RAPD) analysis
DNA was extracted from the muscle, following the procedure described by Almeidaet al., (2001). DNA was estimated in the fluorimeter DyNA Quant 200 (Hoefer). The 30 different decamer oligonucleotides used as random primers in the RAPD screening were purchased from Operon Technologies Ltd, and 10 of them (OPC: C02, C04, C05, C08, C10, C11, C12, C13, C15 and C16) were se-lected on the basis of the number of bands obtained and their ability to produce consistent fragment patterns. Am-plification reactions were performed in a total volume of 15µL containing 10-15 ng of template DNA, 0.25µmol
primer, 3.5 mM MgCl2, 250µmol dNTP, and 1 unit of Taq
DNA polymerase (Biotools) in the reaction buffer supplied. Control reactions were run, containing all components ex-cept genomic DNA. Reactions were carried out in a PTC-100 thermal cycler (MJ Research), during 40 cycles of 40 s at 92 °C, 90 s at 40 °C, and 120 s at 72 °C, after an initial de-naturation of 5 min at 92 °C. After the 40 cycles, one cycle of 5 min at 72 °C was performed.
The RAPD products were resolved by electrophoresis at 3 V cm-1 in 1.4% agarose gels, run with TBE buffer (0.89 M Tris, 0.89 M boric acid and 2 mM EDTA pH 8.3) diluted 1:20 (v:v). Gels were stained with ethidium bro-mide and photographed under ultraviolet light using T-Max Kodak film.
Data analysis
Data from the Capivara Dam were analysed for ge-netic variability within each of the four sites and for gege-netic differences between them to find out whether specimens of
A. altiparanaecollected from the separate sites represented subpopulations of a larger population or should be consid-ered as members of a single population. In both analyses, 12 individuals from each site were used. Inter-population comparative analysis was also carried out, by placing RAPD product samples from 16 individuals from the lower, middle and upper Paranapanema R. on the same electrophoretic gel.
The RAPD marker profiles were determined by direct comparison of the amplified DNA electrophoretic profiles and the data obtained were analyzed in the form of binary variables (band presence or absence). Each locus can be treated as a two-allele system, with only one of the alelle per locus being amplifiable by the PCR. We also assumed that marker alleles from different loci do not comigrate to the same position on a gel, and that populations are under the Hardy-Weinberg equilibrium (Lynch and Milligan, 1994).
Genotypic diversity among the populations was tested by applying the G-test to allele frequencies at the loci, using the population genetics package POPGENE 1.31 (Yehet al., 1999). To get a clearer picture of the G-test results, the significance proportion was estimated, by di-viding the number of RAPD loci with significant differ-ences in allele frequencies, according to the G-test (at 5% level), by the total number of polymorphic loci. The follow-ing calculations were carried out with TFPGA 1.3 software (Miller, 1997), with Lynch and Milligan’s (1994) correc-tion: estimation of genetic variability from the proportion of polymorphic loci (P), using the 95% criterion; Fisher’s exact test, applied to differences in marker frequencies be-tween pairs of populations (to calculate the standard error, 10 batches, 1000 permutations per batch and 1000 dememorization steps were used); Nei’s unbiased genetic identity (I) and genetic distance (D) (Nei, 1978); estimation of gene frequency divergence among the populations by the theta P, which is an estimator of FST (Miller, 1997),
per-forming 1000 iterations to generate the confidence interval (Jackknife estimate). To test the significance of results from the theta P, the formulaχ2= 2Nθ(k - 1), with (k - 1) (s - 1) degrees of freedom, was used, N being the number of individuals in the analysis, k the number of alleles and s the number of subpopulations considered for the gene locus. The number of migrants per generation (Nm), which repre-sents inter-population gene flow, was obtained from theta P test by means of the formulaNm= (1 - theta P) / (4 theta P). The formulae used to test the significance of theta P results and to obtain theNmwas suggested by Black (1997). Ge-netic similarity dendrograms among the populations of each river section were constructed by using the Jaccard (J) coefficient and the UPGMA cluster analysis algorithm in the NTSYS-PC (Rohlf, 1992) computer program.
Results
Genetic analysis ofA. altiparanaeat the Capivara Dam
The genetic diversity estimated from the proportion of polymorphic loci (P) at the Capivara Dam was 69.06%, 73.38%, 78.41% and 69.78% for Sertanópolis, Cinzas, Cruzália and Porecatu, respectively.
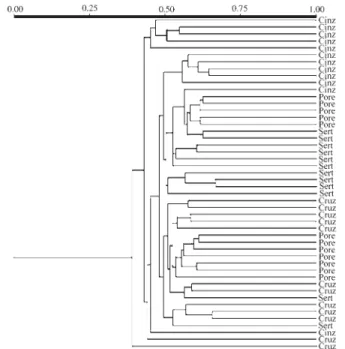
Ten RAPD primers were used in a comparative analy-sis of the four sites, resulting in 124 bands (loci) in all. In the genetic similarity dendrogram constructed from the comparative data (Figure 2), there was a large cluster (sub-divided into small clusters), in which similarity coefficients varied from 0.441 to 0.667, and a small one composed of five individuals from Cinzas. The inter-site genetic dis-tance and identity calculations (Table 1), based on Nei (1978), revealed that the largest distance was between specimens from Cinzas and Porecatu (0.0605) and that the greatest identity between those from Porecatu and Serta-nópolis (0.9657), confirming the pattern seen in the similar-ity dendrogram (Figure 2).
Results from Fisher’s exact test are displayed in Ta-ble 2, where it can be seen that only one probability (0.0437) showed a significant difference at the 5% level, namely that between samples at Cinzas and Porecatu. The genetic differentiation values obtained by the theta P test were significant for each pair of sites in the reservoir (Table 2). The estimates of gene flow (Nmin Table 2) show that Cinzas and Cruzália have the largest number of migrants per generation (2.53).
The G-test found the highest proportion of polymor-phic loci (criterion 95%) with significant differences in allelic frequencies between the Cinzas and Porecatu (21.73%) sites, Figure 3.
Genetic analysis of sites along the Paranapanema River
Genetic variability (P) was estimated for the lower, middle and upper reaches of the river, and these values were 42.64%, 75% and 75%, respectively.
Figure 2- Genetic similarity dendrogram generated with the Jaccard coef-ficient and UPGMA algorithm forA. altiparanaefrom the 4 study sites at the Capivara Dam on the Paranapanema R.. CINZ = Cinzas, CRUZ = Cruzália, PORE = Porecatu and SERT = Sertanópolis.
Table 1- Nei’s (1978) genetic distance (above diagonal) and genetic identity (below diagonal), with Lynch and Milligan correction (1994), betweenA. altiparanaesamples at 4 sites at the Capivara Dam.
Cinzas Cruzália Porecatu Sertanópolis
Cinzas ***** 0.0387 0.0605 0.0399
Cruzália 0.9621 ***** 0.0560 0.0497
Porecatu 0.9413 0.9456 ***** 0.0349
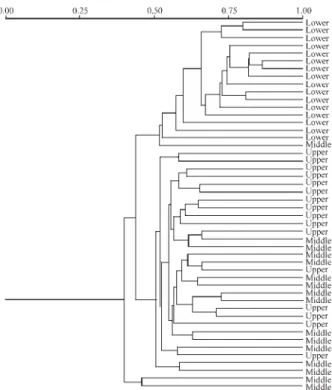
In the genetic similarity dendrogram (Figure 4), con-structed on the basis of comparative analysis of the 128 loci obtained with the 10 RAPD primers, three clusters can be seen: the first formed by 15 specimens from the lower Paranapanema, the second by all those from the upper, 14 from the middle and 1 from the lower river, and the third by 2 specimens from the middle. The genetic similarity be-tween the first two clusters is 0.429 and that bebe-tween the third and the first two is 0.397.
The Nei (1978) measures of genetic distance and identity between pairs of locations are given in Table 3 and indicate that the middle and upper river have the highest identity (0.9611), and the lower and upper the greatest ge-netic distance (0.1262).
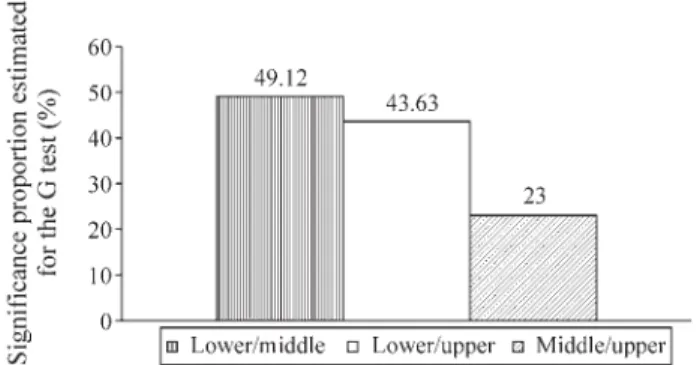
Fisher’s exact test results are displayed in Table 2, where significant probabilities are seen for differences be-tween the lower Paranapanema and the other two locations. The G-test gave analogous results (Figure 5), in which the biggest proportions of polymorphic loci (criterion 95%) with significant differences in allelic frequencies were found in comparisons between lower and middle (49.12%) and between lower and upper (43.63%) sites, while the
pro-Table 2- Theta P test, mean number of migrants per generation (Nm) and Fisher’s exact test between pairs ofA. altiparanaesamples from 4 sites at the Capivara Dam and samples from sites in the lower, middle and upper Paranapanema River.
Theta test Fisher’s exact test
Sites Theta P Jackknife χ2 Nm χ2 P
Cin/Cruz 0.0898 0.090 (0.0163) 4.310* 2.53 257.7685 0.8027
Cin/Por 0.1390 0.1394 (0.0260) 6.672* 1.54 319.5536 0.0437*
Cin/Sert 0.1032 0.1035 (0.0212) 4.953* 2.17 279.5464 0.4627
Cruz/Por 0.1248 0.1254 (0.0291) 5.990* 1.75 215.0900 0.9980
Cruz/Sert 0.1197 0.1202 (0.0246) 5.745* 1.83 262.8279 0.7347
Por/Sert 0.0921 0.0923 (0.0179) 4.420* 2.46 209.7597 0.9992
Lower/Middle 0.2813 0.2822 (0.0335) 9.001* 0.638 797.4506 0.0000*
Lower/Upper 0.2912 0.2924 (0.0390) 9.318* 0.608 799.6149 0.0000*
Middle/Upper 0.0895 0.0897 (0.0204) 2.864 2.54 269.0374 0.5394
*= statistically significant at 5%; ( ) standard deviation; df theta = 1; df Fisher = 278.
Figure 3- Proportion of RAPD polymorphic loci (95% criterion) with sig-nificant differences (by G-test) in allele frequencies between A. altiparanaesamples from each pair of sites at the Capivara Dam.
Figure 4- Genetic similarity dendrogram generated with the Jaccard coef-ficient and UPGMA algorithm, applied to RAPD data, forA. altiparanae from the lower, middle and upper Paranapanema River.
Table 3- Nei’s (1978) genetic distance (above diagonal) and genetic identity (below diagonal), with Lynch and Milligan correction (1994), between A. altiparanae samples from the lower, middle and upper Paranapanema River.
Low Middle Upper
Lower ***** 0.1202 0.1262
Middle 0.8867 ***** 0.0397
portion found between the middle and upper sites was only half these values (23%).
The theta P test for genetic diversity, applied to pairs of locations on the river, showed significant differentiation between the lower and middle (0.2813) and the lower and upper (0.2912) river. These results are shown in Table 2, where it can also be seen thatNmis highest between the middle and upper locations.
Discussion
Knowledge of the effects of genetic variability in spe-cies of fish is vitally important for an understanding of how diversity is distributed among populations. Genetic tech-niques of handling, conservation and breeding of fish, for instance, depend on knowing the amount of variation within each local reproductive unit (Carvalho, 1993). Fish are the only food-source caught directly from wild popula-tions and, for that reason, it is essential to have information on the structure of those populations, so as to plan natural resource management (Rymanet al., 1995).
On the basis of the observation that individuals that have lost heterozygosity through inbreeding usually exhibit a weakening of features of adaptation such as survival and fecundity, conservationists assume that a fall in genetic di-versity in a population could adversely affect its short-term viability (Leberg, 1990).
According to Haig (1998), the greatest contribution that conservation geneticists can make to the assessment of the viability of populations is to separate the component of genetic diversity inside the populations from that between them. Estimating the degree of structuring in a population is a crucial step in conservation genetics work, as it allows the channelling of conservation efforts tomakebetter use of available resources (cf. Solé-Cava, 2001). Thus, if a threat-ened species occupying a given area is shown to be struc-tured, the conservation strategy should endeavour to preserve its diversity in that area, since there might be local adaptations that would lose in competition with other popu-lations introduced into the area. On the other hand, if the
population of a species is homogeneous throughout its territory, then efforts to protect the species can be concen-trated on just one area, and individuals from that area may be used to restock other areas when necessary (Haig, 1998).
Genetic diversity and similarity
The genetic diversity estimates of around 70%, ob-tained forA. altiparanaebetween the four collection points at the Capivara Dam and between the middle and upper Paranapanema, may be considered high values compared to data from other freshwater fish species, the value of P ob-tained for lower Paranapanema is compatible with those described in the literature. Almeidaet al. (2003), working withPimelodus maculatus from the Paranapanema, esti-mated P to be about 60%; Chiari and Sodré (2001), in a comparative study of eight freshwater fish species, found the following values: Schizodon intermedius 45.5%, S. nasutus22.2%, Leporinus friderici46%,L. octofasciatus
55.5%, L. striatus 41%, L. amblyrhynchus 46.3%, L. elongatus27.8% andL. obtusidens48.5%.
According to Carvalho (1993), genetic diversity, ex-pressed inside and among populations, can enhance adapta-tion to a particular habitat and also expand the boundary of colonization and distribution, enabling a species to survive in a wide variety of conditions.A. altiparanaeexhibits eco-logical versatility, with the ability to colonize diverse fresh-water habitats, both lotic and lentic, including some that are partly degraded. This species also shows great flexibility in its feeding habits, which suggests the possibility of exploi-tation of varied microhabitats (cf. Orsi, 2001). The high values of genetic diversity estimated forA. altiparanaein the Paranapanema are undoubtedly related to this environ-mental versatility.
Analysis of the population structure ofAstyanax altiparanaeat the Capivara Dam
Garutti and Britski (2000) report that different popu-lations ofA. altiparanaeare not uniform in their morphol-ogy, probably because this species oflambariis found in a wide range of habitats. Thus, those that inhabit shallow wa-ter, such as the headwaters of a stream, have typically fewer scales along the lateral line, fewer scale series on the trans-verse body line and fewer rays on the anal fin. These au-thors also point out that specimens from these habitats possess a squatter body than those from deeper water, al-though obviously these traits are present to a lesser or greater degree in particular fish. Besides these variations in physique, A. altiparanae from headwaters have an ex-tended mating period, with several peaks of reproduction, while those from deeper river water tend to have a short pe-riod.
Regarding the populations at the four sites in Capi-vara Dam, analyses of the various parameters used to assess their genetic diversity gave the consistent result that the most widely differentiated sites were Cinzas and Porecatu
(Tables 1 and 2, Figure 3). The greatest genetic distance de-tected (0.0605) and, concomitantly, the smallest genetic identity (0.9413), were observed between these two sites, for which Fisher’s exact test gave the only significant result among all the inter-site comparisons. These sites also ex-hibited the highest proportion (21.73%) of polymorphic loci that differed significantly in allelic frequency (G-test), the largest gene divergence (0.1390) in the theta P test and the smallest gene flow (Nm= 1.54). Wright (1978, in Hartl and Clark, 1997) suggested that FSTcan be interpreted
qual-itatively as follows: values from 0 to 0.05 indicate low, from 0.05 to 0.15 medium, from 0.15 to 0.25 high and over 0.25 very high genetic differentiation. Hence, on the basis of the theta P test, which corresponds to FST estimates
(Miller, 1997), we considered these two sites moderately differentiated.
Wild populations do not often remain in a state of panmixia, which means that the probability of any two indi-viduals in a population mating and producing offspring is seldom uniform, but rather depends on biological and geo-graphical factors (Solé-Cava, 2001). Examining the map in Figure 1, it is clear that, within the reservoir, the sites at Cinzas and Porecatu are the most distant from each other, which could explain the relatively high level of genetic dif-ferentiation between their populations of A. altiparanae. Moreover, specimens from Cinzas were collected at the point of discharge of the River Cinzas and may therefore represent a truly differentiated group.
Hartl and Clark (1997) suggest that the structuring of populations occurs in almost all organisms. Many species organize themselves into natural subpopulations, such as herds, shoals, colonies and other types of aggregations. When a population is subdivided, some degree of differen-tiation is virtually inevitable in the acquisition of the allelic frequencies that vary in that population. What determines the structure of a population may be the system of repro-duction, natural selection favouring different genotypes in different populations, degree of endogamy, gene flow and/or genetic drift within and between populations. Ac-cordingly, in order to understand the dynamics of popula-tions, not only must their actual structures be quantified, but it is also relevant to study the circumstances that deter-mine them.
The theta P test results (Table 2) showed significant differences between all six pairs of sites in the reservoir and the values found varied from 0.0898 to 0.1390. Thus, ac-cording to the criteria suggested by Wright (1978) (cited in Hartl and Clark, 1997), these values indicate moderate ge-netic differentiation amongA. altiparanaeat the four sites, so that in terms of genetic structure these groups could be considered as subpopulations of the Capivara Dam popula-tion.
Gene flow is the main component of population struc-ture, as it governs to what extent each local population of a species is a separate evolutionary unit. If there is a lot of
gene flow between local populations, then that set of popu-lations evolve together, while if there is little gene flow, each population evolves practically alone (Slatkin, 1994).
Vrijenhoek (1998) reports the average rate of gene flow in river fish to beNm= 2.50 migrants in each genera-tion. According to this author, hierarchical ramifications in fluvial systems are quite complex, and this complexity must be taken into account when geographical isolation of groups is analysed. Various fish species may share the same hydrographic system, but the dispersal behaviour and life cycle of each can create different patterns of hierarchy and different rates of gene flow; comparative studies of species with parallel distribution but different life cycles could ver-ify this hypothesis.
The sites at Cinzas and Cruzália, the geographically closest pair (Figure 1), exhibited the highest rate of gene flow (Nm= 2.53) and the smallest theta (0.0898), Table 2, corroborating the result that the subpopulations at these two sites in the reservoir are those with the least genetic differ-entiation between them.
Analysis of the genetic structure ofAstyanax altiparanaein the Paranapanema River
In the comparative analysis of the genetic diversity of
A. altiparanaecollected at three sites (lower, middle and upper) along the Paranapanema, the same parameters were employed as those already referred to, and the results are displayed in Tables 2 and 3 and Figure 5.
The results obtained from the various tests were all in qualitative agreement. The highest values of genetic dis-tance between local groups were those relating the lower to the middle and upper sites; the observed differences in marker frequencies had significant probabilities (by Fisher’s exact test) only for those between the lower site and the other two; the G-test showed that the proportion of polymorphic loci with significant allelic frequency differ-ences between populations at the middle and upper sites was only half that calculated when the lower population was compared with either of the others. Finally, the theta P test indicated higher gene-frequency variance between the lower and middle (0.2813) and lower and upper (0.2912) than between the middle and upper populations (0.0895), while the estimated numbers of migrants between these pairs were 0.638, 0.608 and 2.54, respectively.
The above results demonstrate that the genetic differ-entiation between the A. altiparanae population in the lower river and those in the middle and upper reaches may be considered high, in terms of Wright’s criteria (referred to above), whereas that between the middle and upper river populations is considerably less and may be classed as moderate. In other words, the lower Paranapanema popula-tion of this species has its own genetic structure, distinct from those of the other two populations.
Parana-panema. According to Agostinhoet al.(1992), the dams modify the intensity, duration and epoch of high water, as well as creating very unstable thermal and hydrodynamic conditions downstream and intercepting the migratory paths of various species of fish. Besides, the Rosana Dam, which was the last one constructed on the lower Parana-panema, is near the point where it flows into the Paraná River, so that the population of this reservoir may even have genetic features influenced by the population in the Paraná. As already mentioned, Garutti and Britski (2000) have noted that the morphology of thislambariis not uni-form from population to population, probably because these fish inhabit a wide variety of microenvironments, and thus it is to be expected that the populations found at differ-ent points along a river should display genetic structuring. Moysés and Almeida-Toledo (2002) analysed restric-tion-fragment length polymorphism of mitochondrial DNA among five freshwater fish of the genusAstyanaxfrom Up-per Paraná and São Francisco hydrographic basins.In this study, nine different mtDNA haplotypes were detected in
A. altiparanae, eight of them population-specific. Similar results were obtained for the other species of this genus analysed.
Prioliet al.(2002) studied the genetic relatedness be-tween the non-endemicAstyanaxpopulation from the Igua-çu river and twoA. altiparanaepopulations from tributaries of the Paraná river basin, attempting to identify the origin of theAstyanaxpopulation in the Iguaçu river basin. In this study, RAPD markers corroborated the inference of high genetic similarity among the threeAstyanaxpopulations, as estimated from mtDNA sequences. The authors concluded that theAstyanaxpopulation from the Iguaçu river is not endemic and should be stated asA. altiparanae, and it was most likely recently introduced in the Iguaçu river basin, maintaining the ancestral genetic identity.
According to Garutti (1995), the genusAstyanaxhas a compartmentalised distribution, suggesting a remarkable endemism: there is a different form for each basin and within each basin, there are several different forms with rel-atively restricted geographical distribution.
On the other hand, one would expect the middle (Capivara Dam) and upper (Jurumirim Dam) populations to be more differentiated genetically, given that well before the first hydroelectric power station was built at Salto Grande on the Paranapanema, there existed a natural geo-graphical barrier, the Salto Grande waterfall, which was about 20 m high and without a doubt constituted a barrier to fish migration. The low genetic differentiation observed between these two populations might be due to a recent in-troduction of fish; it is possible that at some time the two reservoirs were restocked withA. altiparanaefry from the same source.
The restocking of reservoirs or rivers with fish can have a strong impact on the genetics of the local popula-tions (receiving stock). Competition, predation and
parasit-ism may contribute to this, but, when assessing the implica-tions of restocking, the importance of genetic diversity should be remembered. This refers to hereditary differ-ences between and within the populations, and to the fact that it is vital to maintain such genetic variation, so that the species will be able to adapt to changes arising in its sur-roundings. Each population of a given species possesses a different gene pool,i.e., a specific set of alleles adapted to local conditions. When a locale is restocked with individu-als bred in captivity which did not originate from the local population, alleles important for survival in that habitat may be diluted or lost and/or less well-adapted alleles fixed, possibly leading to the local extinction of that species (cf. Toledo-Filhoet al., 1992; Oliveira, 2001).
In light of the above, regarding the management of the speciesA. altiparanaein the reservoirs along the River Paranapanema, we recommend that the data obtained in this work be taken into account in handling and conserva-tion programs.
Acknowledgements
The authors would like to thank Dr Oscar Akio Shibatta, Edson Santana da Silva and Aparecido de Souza from the Universidade Estadual de Londrina for identifica-tion and collecidentifica-tion of the specimens. We would also like to thank Duke Energy International- Geração Paranapanema S/A, Universidade Estadual de Londrina, FAUEL and CA-PES for financial support received for the execution of this study.
References
Agostinho AA, Julio Jr HF and Borghetti JR (1992) Conside-rações sobre os impactos dos represamentos na ictiofauna e medidas para sua atenuação. Um estudo de caso: Reserva-tório de Itaipu. Rev Unimar 14:89-107.
Almeida FS, Fungaro MHP and Sodré LMK (2001) RAPD and isoenzyme analysis of genetic variability in three allied spe-cies of catfish (Siluriformes: Pimelodidae) from the Tibagi river, Brazil. J Zool Lond 253:113-120.
Almeida FS, Sodré LMK and Contel EPB (2003) Population structure analysis of Pimelodus maculatus (Pisces, Siluriformes) from the Tietê and Paranapanema rivers (Brazil). Genet Mol Biol 26:301-305.
Barman HK, Barat A, Yadav BM, Banerjee S, Meher PM, Reddy PVGK and Jana RK (2003) Genetic variation between four species of Indian major carps as revealed by random ampli-fied polymorphic DNA assay. Aquaculture 217:115-123. Bártfai R, Egedi S, Yue GH, Kovács B, Urbányi B, Tamás G,
Horváth L and Orbán L (2003) Genetics analysis of two common carp broodstocks by RAPD and microsatellite markers. Aquaculture 219:157-167.
Callejas SC and Ochando MD (1998) Identification of Spanish Barbel species using the RAPD technique. J Fish Biol 53:208-215.
Carvalho GR (1993) Evolutionary aspects of fish distribution: Ge-netic variability and adaptation. J Fish Biol 43:53-73. Chiari L and Sodré LMK (2001) Study of eight species of the
Anostomidae family (Pisces, Characiformes) by RAPD analysis. Acta Scient 23:445-451.
Dergam JA, Suzuki HJ, Shibatta AO, Duboc LF, Júlio Jr OF, Giuliano-Caetano L and Black IV WC (1998) Molecular biogeography of the neotropical fishHoplias malabaricus (Erythrinidae: Characiformes) in the Iguaçu, Tibagi and Paraná rivers. Genet Mol Biol 21:493-496.
Garutti V (1995) Revisão taxonômica dos Astyanax (Pisces, Characidae), com mancha umeral ovalada e mancha no pedúnculo caudal, estendendo-se à extremidade dos raios caudais medianos, das bacias do Paraná, São Francisco e Amazônica. Livre-Docência Thesis, Universidade Estadual Paulista, São José do Rio Preto.
Garutti V and Britski HA (2000). Descrição de uma espécie nova deAstyanax altiparanae(Teleostei, Characidae) da bacia do alto do rio Paraná e considerações sobre as demais espécies do gênero na bacia. Comum. Mus Ciênc Tecnol PUCRS 13:65-88.
Godinho HP and Godinho AL (1994). Ecology and conservation of fish in southeastern Brazilian river basins submitted to hydroelectric impoundments. Acta Limn Brasil 5:187-197. Hadrys H, Balick M and Schierwater B (1992) Applications of
random amplified polymorphic DNA (RAPD) in molecular ecology. Mol Ecol 1:55-63.
Haig SM (1998) Molecular contributions to conservation. Ecol-ogy 79:413-425.
Hartl DL and Clark AG (1997) Principles of Population Genetics. Sinauer, Canadá, 542 pp.
Hatanaka T and Galetti Jr PM (2003) RAPD markers indicate the occurrence of structured populations in a migratory freshwa-ter fish species. Genet Mol Biol 26:19-25.
Jayasankar P and Dharmaliangam K (1997) Potential application of RAPD and RAHM markers in genome analysis of scombroid fishes. Curr Sci 72:383-390.
Leberg PL (1990) Influence of genetic variability on population growth: Implications for conservation. J Fish Biol 37:193-195.
Lynch M and Milligan BG (1994) Analysis of population struc-ture with RAPD markers. Mol Ecol 3:91-99.
Miller MP (1997) Tools for population genetic analyses TFPGA 1.3: A windows program for the analysis of allozyme and molecular population genetic data. Department of Biologi-cal Sciences, Northern Arizona University. MPM2@jan. ucc.nau.edu, Computer software distributed by author.
Moysés CB and Almeida-Toledo LF (2002) Restriction fragment length polymorphisms of mitochondrial DNA among five freshwater fish species of the genus Astyanax (Pisces, Characidae). Genet Mol Biol 25:401-408.
Nei M (1978) Estimation of average heterozigosity and genetic distance from a small number of individual. Genetics 89:583-590.
Oliveira C (2001) Conservação Genética em Peixes. Bol Soc Bras Ictiol 63:5-6.
Orsi ML (2001) Biologia populacional deAstyanax altiparanae Garutti & Britski, 2000 (Teleostei, Characidae) da bacia do rio Paranapanema (baixo do rio Tibagi). Master Disserta-tion, Universidade Estadual Paulista, Botucatu.
Prioli SMAP, Prioli AJ, Júlio Jr HF, Pavanelli CS, Oliveira AV, Carrer H, Carraro DM anf Prioli LM (2002) Identification of Astyanax altiparanae(Teleostei, Characidae) in the Iguaçu River, Brazil, based on mitochondrial DNA and RAPD markers. Genet Mol Biol 25:421-430.
Rohlf FJ (1992) NTSYS-pc. Numerical taxonomy and multi-variate analysis system. Exeter software, Applied Bioestatistics, N.Y., 225 pp.
Ryman N, Utter F and Laikre L (1995) Protection of intraspecific biodiversity of exploited fishes. Review Fish Biol Fish 5:417-446.
Sekine ES, Prioli AJ, Prioli SMAP and Júlio JR HF (2002) Ge-netic differentiation among populations of Pseudoplatystoma corruscans (Agassiz, 1892) (Osteichthyes, Pimelodidae) isolated by the Guaíra Falls in the Paraná River. Acta Scient 24:507-512.
Slatkin M (1994) Gene flow and population structure. In: Real, LA (ed) Ecological Genetics. 1st edition. Princeton Univer-sity Press, pp 3-17.
Solé-Cava AM (2001) Biodiversidade molecular e genética da conservação. In: Matioli SR (ed) Biologia Molecular e Evo-lução. 1st edition. Holos, Ribeirão Preto, pp 172-192. Toledo-Filho SA, Almeida-Toledo LF, Foresti F, Galhardo E and
Donola E (1992) Conservação genética de peixes em proje-tos de repovoamento e reservatórios. Cadernos de Ictio-genética 1. Universidade de São Paulo, São Paulo. Vrijenhoek RC (1998) Conservation genetics of freshwater fish. J
Fish Biol 53:394-412.
Welsh J and McClelland M (1990) Fingerprinting genomes using PCR with arbitrary primers. Nucl Acids Res 18:7213-7218. Williams JGK, Kubelik AR, Livak KJ, Rafaeski JA and Tingey S
(1990) DNA polymorphism amplified by arbitrary primers are useful as genetic markers. Nucl Acids Res 18:6531-6535.
Yeh FC, Yang R and Boyle T (1999) POPGENE version 3.1: Microsoft Windows-based freeware for population genetic analysis. University of Albert and Center for International Forestry Research.