http://dx.doi.org/10.1590/s2175-97902017000116050
*Correspondence: E. Dinç. Department of Analytical Chemistry, Faculty of Pharmacy, Ankara University, 06100 – Tandoğan, Ankara, Turkey. E-mail: [email protected]
Continuous wavelet transform methods for the simultaneous
determinations and dissolution profiles of valsartan and
hydrochlorothiazide in tablets
Erdal Dinç*
1, Özgür Üstündağ
1, Günseli Yüksel Tilkan
2, Berna Türkmen
2, Nurten Özdemir
21
Department of Analytical Chemistry, Faculty of Pharmacy, Ankara University, Tandoğan, Ankara, Turkey, 2
Department of Pharmaceutical Technology, Faculty of Pharmacy, Ankara University, Tandoğan, Ankara, Turkey
Continuous wavelet transform (CWT) was proposed for the simultaneous determination and dissolution proiles of valsartan (VAL) and hydrochlorothiazide (HCT) in tablets, without the use of a chemical separation procedure. The CWT approach was applied to the original UV spectra and their ratio spectra in the optimal wavelength ranges. After testing several wavelet families, Mexican hat function-CWT and Daubechies7-CWT (mexh-CWT and db7-CWT, respectively) were found to be suitable for the transformation of the original UV spectra. In the following procedure, mexh-CWT and Coilets3-CWT (coif3-CWT) were found to be appropriate for the signal analysis of ratio spectra (RS) of VAL/HCT and HCT/VAL. Calibration graphs for VAL and HCT were obtained by measuring db7-CWT and mexh-CWT amplitudes in the transformation of the original absorption spectra and RS-coif-CWT and RS-mexh-CWT amplitudes in the transformation of the ratio spectra. The validity and applicability of the proposed CWT methods were evaluated through the analysis of an independent set of synthetic binary mixtures consisting of VAL and HCT. The proposed signal processing methods were then successfully applied to the simultaneous quantitative evaluation and simultaneous dissolution proiles of the related drugs in commercial tablets, with good agreement reported for the experimental results.
Uniterms: Spectral Continuous Wavelets Transform. Valsartan. Hydrochlorothiazide. Binarymixture/ tablets.
INTRODUCTION
The simultaneous analysis and simultaneous dissolution testing of combined pharmaceutical formulations are key issues in contemporary analytical chemistry and pharmaceutical technology due to the interference of the spectral bands within the same region, or due to unresolved chromatographic peaks of compounds that have similar chemical and physical properties. In experimental applications, the aforementioned problems have been solved through the use of several analytical techniques such as derivative spectrophotometry and high performance liquid chromatography (HPLC). In some cases, a classical derivative technique – or its modiied version – may not yield successful outcomes due to the presence of overlapping spectral bands, the interference
of the main band with noise peaks, and the complexity caused by the matrix efect of commercial samples. On the other hand, HPLC and its hyphenated approaches are more speciic than classical derivative spectrophotometry, but they are also more expensive. In addition, determining optimal experimental conditions in HPLC analysis is time consuming and requires the excessive use of a reactive. In this study, we propose that new analytical methods such as powerful signal processing and chemometric calibrations are able to overcome the analytical problems involved in multicomponent analysis without the introduction of any separation step. In this context, wavelets are powerful tools that can eliminate the drawbacks of classical analytical methods.
the resolution of overlapping spectral characteristics, and baseline correction. The development and application of the CWT approaches has extensively increased the potential power of spectral analysis methods for resolving multicomponent mixtures (Shao, Zhuang, 2004). Very recently, the CWT method combined with the zero-crossing technique and ratio signal treatments has been reported to yield positive results for the simultaneous quantitative analysis of multicomponent pharmaceutical preparations and other samples (Dinç, Baleanu, Üstündağ,
2003; Dinç, Baleanu 2007; Pektaş, Dınç, Baleanu, 2009).
In signal transformation, wavelets provide a higher signal/ noise ratio than the classical derivative approach with zero-crossing. Another advantage of the wavelet transform method over the derivative technique is that it contains rich wavelet families for the resolution of overlapping spectral bands (Dinç, Baleanu, Üstündağ, 2003; Dinç, Baleanu, 2007).
The combination of VAL and HCT has been widely used in commercial pharmaceuticals due to their respective antihypertensive and diuretic properties. The combination of valsartan (an angiotensin II type 1 [AT(1)] receptor blocker) and hydrochlorothiazide (a thiazide diuretic), administered once daily, has been evaluated in the treatment of patients with hypertension in clinical trials ranging in duration from 8 weeks to 3 years. These studies showed that combination treatment with valsartan 80mg or 160 mg and hydrochlorothiazide 12.5 mg or 25 mg induced signiicant reductions from baseline systolic blood pressure (SBP) and diastolic blood pressure (DBP) in patients with mild to severe hypertension. Clinical trials have demonstrated that the combination of valsartan 80 mg/160 mg with hydrochlorothiazide 12.5 mg/25 mg is significantly more effective than the administration of either drug alone (Wellington et al., 2002).
Several analytical methods have been adopted for the quantitative estimation of VAL and its combination with other drugs in pharmaceuticals and biological luids, including spectrophotometry (Dinç, Uslu, Özkan, 2004; Mohamed, 2011; Gupta et al., 2010; Ramachandran,
Mandal, Navalgund, 2011), multivariate calibration
(Dinç, Uslu, Özkan, 2004), HPLC (Carlucci, Carlo, Mazzeo, 2000; Tian et al., 2008; Zarghi et al., 2008;
Sudesh, Uttamrao, 2009; Vinzuda, Saılor, Sheth, 2010;
Vignaduzzo, Castellano, Kaufman, 2011; Rao, Nıkalje, 2014), UPLC (Antil et al., 2013), TLC (Ramadan,
Al-Akraa, Maktabi, 2014), HPTLC (Shah et al., 2009),
voltammetry (Erden et al., 2014) and LC-MS (Li et al.,
2007). Additionally, the use of CWT methods has been reported for the determination of other mixtures (Ashour
et al., 2015; Abbasi, 2016).
The main aim of this study is to develop and apply new signal processing methods for the simultaneous spectral determination and simultaneous dissolution tests of VAL and HCT drugs in tablets. In the application of CWT to the original UV spectra and the corresponding ratio spectra, various wavelet families at diferent scale factors (a), were tested. Here, the use of db7-CWT
(a=240) and mexh-CWT (a=100) for the transformation of the original UV spectra was found to be suitable for VAL and HCT analysis. In addition, RS-coif3-CWT (a=290 for VAL and a=360 for HCT) and
RS-mexh-CWT (a=56 for both VAL and HCT) were found to
be optimal for the transformation of the ratio spectra of related drugs. As a comparison method, traditional derivative spectrophotometry was subjected to analysis and dissolution assays. All of the proposed methods were validated through the use of various synthetic binary mixtures and the standard addition technique. The satisfactory results obtained through the application of the proposed signal processing tools to the simultaneous quantitative prediction and simultaneous dissolution monitoring of the target drugs are reported.
MATERIAL AND METHODS
Instruments and Software
The UV spectra was performed on a Shimadzu UV-160 double beam UV–Vis spectrophotometer possessing a ixed slit width (2 nm) connected to a computer loaded with Shimadzu UVPC software. Spectral data processing, statistical calculations and spectral transformation procedure were performed using MS Excel and the wavelet toolbox in Matlab software.
The USP paddle method (Apparatus II) was used for the dissolution rate studies at 37±0.5 ºC (AYMES dissolution test apparatus, Aymes Ind., Umraniye, Istanbul, Turkey). The dissolution rate test was performed at 50 rpm in a 900 mL phosphate buffer solution at pH 6.8 (USP 27). All formulations were tested for 20 minutes. Sink conditions were maintained during all measurements. The dissolution test procedure was performed through the use of six experiments. The absorption spectra of the samples were plotted between 200 nm and 360 nm. The proposed signal processing CWT methods were applied to the absorption spectra of the related dissolution samples.
Commercial tablet
the Co-Diovan ilm-coated tablet (NOVARTIS Pharm. Ind., Istanbul, Turkey), consisting of 80 mg VAL and 12.5 mg HCT per tablet. Active compounds VAL and HCT were kindly denoted from national pharm. industry irms in Turkey.
Standard calibration solutions
The standard stock solutions of VAL and HCT were prepared by dissolving 25 mg of each drug in 100 mL of the phosphate bufer solution, consisting of KH2PO4 at pH= 6.8 (USP 30, 2008). The solvent type used as an analytical blank to zero for the spectrometer was a phosphate bufer solution consisting of KH2PO4 at pH= 6.8 (USP 30, 2008). The calibration solutions of VAL and HCT, in the range of 1.0-33.0 µg/mL and 1.0-26.0 µg/mL, were obtained from the prepared stock solutions. Method applicability and validity testing of the proposed methods were carried out using a validation sample set consisting of VAL and HCT in the aforementioned linear concentration ranges prepared using the same stock solutions.
RESULTS AND DISCUSSION
The absorption spectra of the calibration solutions of VAL and HCT in the concentration ranges 1-33 µg/mL and 1-26 µg/mL were recorded between 200-360 nm, respectively. The absorption spectra of samples were plotted in the same way. The overlapping absorption spectra of VAL and HCT compounds and their tablet sample are depicted in Figure 1, which demonstrates that conventional spectrophotometric approaches do not allow for the simultaneous quantitative analysis and simultaneous dissolution tests of VAL and HCT in their tablets. This is due to the strong overlapping of spectral bands. In this case, a chromatographic method or a separation procedure must be used for the quantitative resolution of a two-component mixture. Given the expensive two-components and time-consuming nature of the chromatographic separation techniques, we focused primarily on the development and application of the new signal processing method - wavelets - for rapid, precise, accurate and economic analysis and dissolution testing of tablets containing VAL and HCT drugs without the use of a separation step.
Here, the CWT approach combined with the zero-crossing technique and ratio treatments of signals were improved for the quantiication and dissolution proiles of VAL and HCT in the commercial tablets. In order to compare the results provided by CWT methods, the irst derivative spectrophotometry (DS1) was subjected to the
same problem.
CWT-zero crossing method
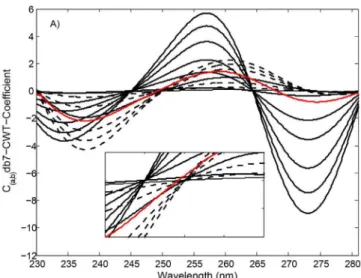
In the application of the CWT signal processing tool, the standard calibration solutions of pure VAL and pure HCT substances between 1.0-33.0 µg/mL and 1.0-26.0 µg/ mL were separately prepared in 25 mL calibrated lasks through the use of the phosphate bufer solution consisting of KH2PO4 (pH= 6.8). The UV spectra of the standard calibration solutions of the subjected compounds with their corresponding tablet solutions were recorded (see Figure 1). The one-dimensional data vectors of the UV spectra of the calibration and samples were then transferred into Microsoft Excel. The transferred absorbance data vectors were processed using the wavelet toolbox in Matlab 7.10. Next, several continuous wavelet families at diferent scale parameters (a) were tested to determine the optimal CWT method for achieving the best recovery in the analysis of the related compounds. As part of this process, the selectivity and sensitivity of the analysis were measured by changing the spectral region (200-360 nm). We concluded that db7-CWT (a=240) and mexh-CWT
(a=100) provided optimal signal transformation of the original UV spectra to obtain the highest recovery results. In addition, db7-CWT and mexh-CWT were applied to the VAL and HCT absorption spectra for the analysis and dissolution tests of both compounds, consisting of 512 data points and corresponding to wavelength ranges of 230.0-281.1 nm and 235.0-286.1 nm, respectively. In the following step, db7-CWT and mexh-CWT spectra were obtained by plotting the CWT-coeicients (C(a,b)) against the wavelengths. The CWT spectra of FIGURE 1 - The UV spectra of VAL (----) : 1.0, 3.0, 9.0, 15.0,
Ratio spectra-CWT method
The UV absorption spectra of VAL and HCT in the calibration series of 1.0-33.0 µg/mL and 1.0-26.0 µg/mL were recorded against a blank (phosphate bufer solution, pH= 6.8). This procedure was then repeated for the samples (see Figure 1). A total of 1,024 data points in the spectral region of 220.0-322.3 nm were considered for the CWT application.
For the VAL ratio spectra treatments, the standard FIGURE 2A - db7-CWT spectra of VAL (----) : 1.0, 3.0, 9.0, 15.0,
21.0, 27.0, 33.0 µg/mL and HCT () : 1.0, 6.0, 11.0, 16.0, 21.0, 26.0 µg/mL and tablet sample () containing 2.50 µg/mL of VAL and 16.0 µg/mL of HCT.
FIGURE 2B - mexh-CWT spectra of VAL (----) : 1.0, 3.0, 9.0,
15.0, 21.0, 27.0, 33.0 µg/mL and HCT () : 1.0, 6.0, 11.0, 16.0, 21.0, 26.0 µg/mL and tablet sample () containing 2.50 µg/mL of VAL and 16.0 µg/mL of HCT.
TABLE I - Linear least square analysis and statistical results
db7-CWT mexh-CWT RS-coif3-CWT RS-mexh-CWT
DS1 a= 240 a= 240 a= 100 a= 100 a= 290 a= 360 a= 56 a= 56
VAL HCT VAL HCT VAL HCT VAL HCT VAL HCT
λ(nm) 244.7 273.7 256.8 270.4 242.0 320.0 242.3 325.0 265.8 242.5
Range 1.0-33.0 1.0-26.0 1.0-33.0 1.0-26.0 1.0-33.0 1.0-26.0 1.0-33.0 1.0-26.0 1.0-33.0 1.0-26.0
m -0.0666 -0.3456 0.1357 0.5042 2.0707 2.2904 1.8116 0.7124 -0.0100 0.0242
n -0.0160 0.0232 0.0268 -0.0512 0.6038 -0.0331 0.8209 -0.0477 -0.0015 0.0064
r 0.9990 0.9992 0.9996 0.9989 0.9999 0.9999 0.9999 0.9999 0.9999 0.9997
SE(m) 0.0020 0.0079 0.0016 0.0116 0.0118 0.0191 0.0117 0.0061 0.0001 0.0003
SE(n) 0.0376 0.1207 0.0314 0.1357 0.2261 0.3050 0.2249 0.0968 0.0192 0.0316
SE(r) 0.0581 0.1658 0.0485 0.2432 0.3492 0.3994 0.3474 0.1267 0.0019 0.0058
LOD 0.16 0.31 0.05 0.27 0.18 0.30 0.21 0.10 0.27 0.30
LOQ 0.52 1.03 0.18 0.89 0.60 0.99 0.68 0.32 0.90 1.01
m: Slope of the straight-line; n: y-intercept of the straight line; SE: Standart error; LOD: The limit of detection; LOQ: The limit
of quantitation.
compounds and their tablet samples are illustrated in Figures 2a and 2b.
spectra of HCT at diferent concentrations were tested in order to determine the optimal divisor concentration. As a result, the standard spectrum corresponding to the solution of 16 µg/mL HCT was found to be suitable to obtain the ratio spectra (RS) of VAL and its binary mixtures. As described above, the UV spectra of VAL in its binary mixtures were divided by the standard divisor spectrum of HCT and the corresponding ratio spectra were obtained as indicated in Figure 3a.
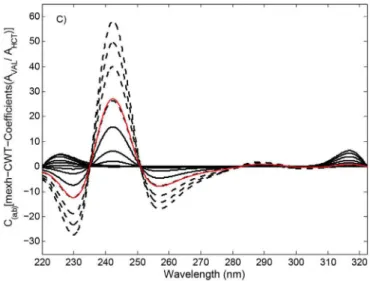
In the next step, several CWT families at diferent scaling factors (a) were applied to the ratio spectra, providing the elimination of HCT for the quantiication of VAL in the samples. It was observed that RS-coif3-CWT (a=290) and RS-mexh-CWT (a=56) were found to
be suitable for the analysis of VAL in samples containing HCT. The RS-coif3-CWT and RS-mexh-CWT spectra of VAL were obtained by plotting the coif3-CWT and mexh-CWT coeicients of the VAL ratio spectra against wavelengths, as illustrated in Figures 3b and 3c.
Taking into account the above signal processing conditions, the linear calibration equations for VAL were obtained by measuring the RS-coif3-CWT and RS-mexh-CWT amplitudes at 242.0 and 242.3 nm, corresponding to maxima (see Figures 3b and 3c). Linear regression analysis and the corresponding statistical data for the application of both RS-coif3-CWT and RS-mexh-CWT are summarised in Table I. The determination and dissolution proiles of VAL in tablets containing HCT were carried out through the aforementioned linear calibration equations.
Similarly, standard spectra of VAL at different divisor concentrations were used to determine the
optimal ratio spectra of HCT. Following the above testing procedure, the ratio spectra of HCT and its binary mixtures were obtained by dividing the original absorption spectra by the standard spectrum of 27 µg/mL VAL. The resulting ratio spectra are presented in Figure 4a.
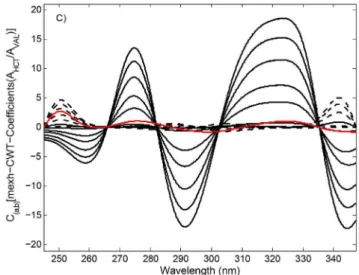
After applying different continuous wavelet families to the ratio spectra, coif3-CWT (a=360) and
mexh-CWT (a=56) tools were found to be optimal for the
transformation of the ratio spectra of HCT and its samples containing VAL. The ratio spectra-CWT procedures in the application of coif3-CWT and mexh-CWT to the ratio spectra of the HCT standard calibration series and tablet FIGURE 3A - Ratio spectra of VAL/HCT, VAL (----) : 1.0,
3.0, 9.0, 15.0, 21.0, 27.0, 33.0 µg/mL and HCT () : 1.0, 6.0, 11.0, 16.0, 21.0, 26.0 µg/mL and tablet sample () containing 2.50 µg/mL of VAL and 16.0 µg/mL of HCT.
FIGURE 3B -RS-coif3-CWT spectra of VAL (----) : 1.0, 3.0, 9.0,
15.0, 21.0, 27.0, 33.0 µg/mL and HCT () : 1.0, 6.0, 11.0, 16.0, 21.0, 26.0 µg/mL and tablet sample () containing 2.50 µg/mL of VAL and 16.0 µg/mL of HCT.
FIGURE 3C -RS-mexh-CWT spectra of VAL (----) : 1.0, 3.0,
sample were denoted using the coif3-CWT and mexh-CWT methods. The coif3-CWT spectra and RS-mexh-CWT spectra of HCT and its tablet were obtained by plotting the CWT coeicients of the ratio spectra against wavelengths, as shown in Figures 4b and 4c, respectively.
For the analysis of HCT in samples containing VAL, the concentration of HCT was proportional to the RS-coif3-CWT and RS-mexh-CWT amplitudes at 320.0 and 325.0 nm, respectively corresponding to the wavelength maxima (see Figures 4b and 4c). Based on the relationship between concentration and the coif3-CWT and RS-mexh-CWT signals, least square regression analysis and
its statistical outputs were collected (see Table I). The concentration of HCT in binary mixtures were calculated using the linear regression equations.
Derivative spectrophotometry
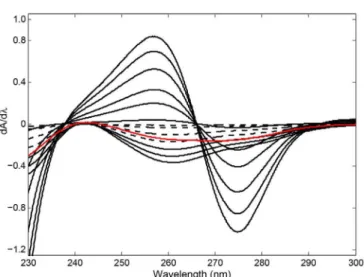
For derivative spectrophotometry (DS), the first derivative spectra of VAL and HCT in the concentration ranges of 1.0-33.0 µg/mL and 1.0-26.0 µg/mL, respectively, were calculated by processing the original UV spectra in the wavelength region of 230.0-300.0 nm. The spectral derivative calculation was performed using intervals of ∆λ=10 nm and scaling factor=10. Figure 5 illustrates the irst derivative spectra of the standard calibration series for VAL and HCT, and the tablet sample. This irst derivative spectrophotometry is abbreviated as DS1.
In the application of the DS1 approach, two
calibration graphs for VAL and HCT were obtained by measuring the derivative intensity at 265.8 nm (which corresponds to a zero-crossing point for VAL) and 242.5 nm (which corresponds to a zero-crossing point for HCT) in the original spectral wavelength range of 230.0-300.0 nm, respectively. Calibration graphs and their statistical data are depicted in Table I. These calibration graphs were applied to the quantitative evaluation and the plot proiles of VAL and HCT in their tablets.
Analytical validation of the signal processing methods
During the method validation process, a number of FIGURE 4A - A) Ratio spectra of HCT/VAL, VAL (----) : 1.0,
3.0, 9.0, 15.0, 21.0, 27.0, 33.0 µg/mL and HCT () : 1.0, 6.0, 11.0, 16.0, 21.0, 26.0 µg/mL and tablet sample () containing
2.50 µg/mL of VAL and 16.0 µg/mL of HCT.
FIGURE 4B - RS-coif3-CWT spectra of VAL (----) : 1.0, 3.0,
9.0, 15.0, 21.0, 27.0, 33.0 µg/mL and HCT () : 1.0, 6.0, 11.0, 16.0, 21.0, 26.0 µg/mL and tablet sample () containing 2.50 µg/mL of VAL and 16.0 µg/mL of HCT.
FIGURE 4C - RS-mexh-CWT spectra of VAL (----) : 1.0, 3.0,
analytical validation parameters were deined by range, linearity, accuracy, precision, selectivity, limit of detection (LOD) and limit of quantitation (LOQ). These factors were used to demonstrate the performance and applicability of the proposed signal processing methods (db7-CWT, mexh-CWT, RS-coif3-CWT, RS-mexh-CWT and DS1)
for the quantiication and dissolution tests of VAL and HCT in tablets.
The concentration ranges of 1.0-33.0 µg/mL for VAL and 1.0-26.0 µg/mL for HCT were found to be suitable for the analysis of the related drugs, with good linearity reported for the calculated calibration graphs of VAL and HCT based on the application of db7-CWT, mexh-CWT, RS-coif3-CWT, RS-mexh-CWT and DS1 under optimised experimental conditions and method settings (see Table I).
The accuracy and precision of the proposed methods were tested using 13 replicate determinations at diferent concentration levels containing binary mixtures. In this study, percentage mean recoveries and their relative standard deviations (RSDs) were computed and are presented in Table II. We concluded that the numerical values indicate satisfactory accuracy and precision with good reproducibility for the application of all of proposed signal processing tools. It was observed that the mean recovery results and RSDs provided by the CWT signal processing approaches appeared to be a little higher than those of DS1 method (see Table II).
Standard deviations of linear regression line intercepts and their corresponding slopes were used in order to calculate the limit of detection (LOD; signal-FIGURE 5 -First derivative spectra of VAL (----) : 1.0, 3.0, 9.0,
15.0, 21.0, 27.0, 33.0 µg/mL and HCT () : 1.0, 6.0, 11.0, 16.0, 21.0, 26.0 µg/mL and tablet sample () containing 2.50 µg/mL of VAL and 16.0 µg/mL of HCT.
TABLE II - Recovery data of VAL and HCT in the synthetic mixtures by applying the signal processing methods
Mixture
Found (µg/mL) and Recovery (%)
db7-CWT mexh-CWT RS-coif3-CWT RS-mexh-CWT
DS1 (a= 240) (a= 240) (a= 100) (a= 100) (a= 290) (a= 360) (a= 56) (a= 56)
VAL HCT VAL HCT VAL HCT VAL HCT VAL HCT VAL HCT
16 1 16,2 101 1,0 103 15,5 96,8 1,0 99,1 15,7 97,8 1,0 102 15,4 96,5 1,0 99,4 15,3 95,9 1,0 95,3 16 6 15,7 97,8 6,2 103 15,6 97,4 6,2 103 15,4 96,4 5,9 97,9 16 99,9 6,0 99,9 15,8 98,5 6,1 102 16 11 16,3 102 11,1 101 15,7 98,1 11,2 102 15,3 95,7 10,9 98,7 16 100 10,9 99,3 15,1 94,3 10,5 95,5 16 16 16,1 101 16,2 101 16,1 101 16,2 101 16 99,7 15,9 99,6 15,6 97,2 16,1 101 15,1 94,6 15,1 94,3 16 21 15,8 99 21,0 99,8 16,2 101 21,1 100 16,1 101 20,9 99,5 16,1 101 20,9 99,7 16,1 101 19,9 94,6 16 26 16,4 102 25,7 98,7 16,4 102 25,8 99,3 15,7 98 25,6 98,3 16,5 103 26 100 15,5 97,1 26,3 101 1 3 1,0 97 3,1 102 1,0 97 3,2 105 1,0 96,3 2,9 97,8 1,0 101 3,0 99,1 1,03 103 2,8 94 3 3 3,08 103 3,0 100 3,1 105 3 100 3,1 102 3,1 104 3,1 105 3,2 106 3,0 99,4 2,9 95,8 9 3 8,9 98,4 3,1 103 9,4 104 3,1 103 9,2 102 3,0 98,2 9,0 100 3,0 101 8,6 96 2,9 98,1 15 3 15,3 102 3,1 104 15,1 100 3,1 104 15 100 3,0 98,8 14,6 97,5 3,0 101 14,6 97,6 2,8 93,4 21 3 21,5 102 3,2 105 21,3 101 3,1 104 21,2 101 2,9 95,9 20,7 98,5 3,0 100 19,7 93,9 2,9 97,5 27 3 28,4 105 3,1 102 27,4 102 3,1 103 27,8 103 2,9 97 27,2 101 3,0 98,5 26,7 98,7 2,9 94,9 33 3 32,9 99,8 3,0 99,2 33,4 101 3,1 105 32,1 97,1 2,9 95,5 33,4 101 3,0 101 31,4 95,2 2,9 96,8 Mean100,7 101,6 100,5 102,2 99,2 98,7 100,1 100,5 97,3 96,4
SD 2,25 1,87 2,53 2,10 2,44 2,26 2,27 1,84 2,76 2,62
RSD 2,24 1,84 2,52 2,05 2,46 2,29 2,27 1,83 2,83 2,72
to-noise ratio of 3:1) and the limit of quantitation (LOQ; signal-to noise ratio of 10:1) in the applications of db7-CWT, mexh-db7-CWT, RS-coif3-db7-CWT, RS-mexh-CWT and DS1. These results can be seen in Table I.
Tablet analysis and dissolution tests
In this investigation, ive diferent signal processing methods (db7-CWT, mexh-CWT, coif3-CWT, RS-mexh-CWT and conventional DS1) were applied to the
simultaneous quantitative analysis of VAL and HCT in tablets. Assay results are presented in Table III.
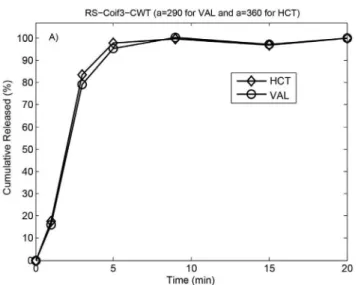
The USP paddle method (Apparatus II) was used in dissolution rate studies (37±0.5ºC), which were performed in phosphate bufer solutions of pH= 6.8. The absorptions of the samples were plotted in the range of 200-360 nm. The proposed db7-CWT, mexh-CWT, RS-coif3-CWT, RS-mexh-CWT and DS1 were applied to the above spectra
of the related dissolution samples. The release proiles of VAL and HCT were obtained by applying the proposed signal processing methods (see Figures 6a-b, Figures 7a-b and Figure 8). We concluded that 80% of the VAL and HCT was released from the tablets within the irst 5 minutes.
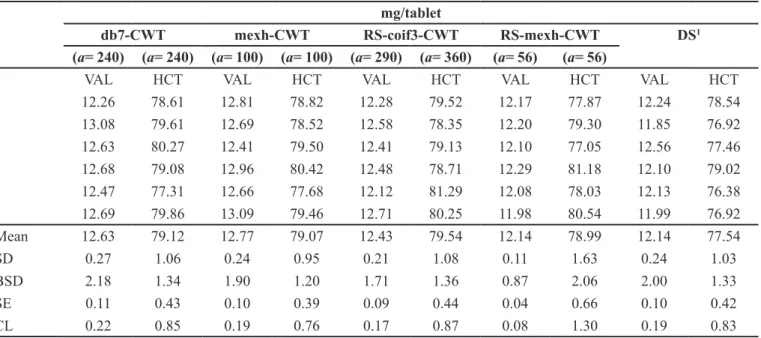
TABLE III -Determination results of VAL and HCT in tablets by CWT methods
mg/tablet
db7-CWT mexh-CWT RS-coif3-CWT RS-mexh-CWT DS1
(a= 240) (a= 240) (a= 100) (a= 100) (a= 290) (a= 360) (a= 56) (a= 56)
VAL HCT VAL HCT VAL HCT VAL HCT VAL HCT
12.26 78.61 12.81 78.82 12.28 79.52 12.17 77.87 12.24 78.54
13.08 79.61 12.69 78.52 12.58 78.35 12.20 79.30 11.85 76.92
12.63 80.27 12.41 79.50 12.41 79.13 12.10 77.05 12.56 77.46
12.68 79.08 12.96 80.42 12.48 78.71 12.29 81.18 12.10 79.02
12.47 77.31 12.66 77.68 12.12 81.29 12.08 78.03 12.13 76.38
12.69 79.86 13.09 79.46 12.71 80.25 11.98 80.54 11.99 76.92
Mean 12.63 79.12 12.77 79.07 12.43 79.54 12.14 78.99 12.14 77.54
SD 0.27 1.06 0.24 0.95 0.21 1.08 0.11 1.63 0.24 1.03
BSD 2.18 1.34 1.90 1.20 1.71 1.36 0.87 2.06 2.00 1.33
SE 0.11 0.43 0.10 0.39 0.09 0.44 0.04 0.66 0.10 0.42
CL 0.22 0.85 0.19 0.76 0.17 0.87 0.08 1.30 0.19 0.83
SD: Standard deviation; RSD: Relative standard deviation; SE: Standard error; CL: Conidential limit (p=0.05).
FIGURE 6A -Dissolution profiles of VAL and HCT obtained
by applying db7-CWT method.
FIGURE 6B -Dissolution profiles of VAL and HCT obtained by
CONCLUSION
It is widely recognised that the simultaneous analysis and dissolution of multicomponent pharmaceutical preparation is a highly significant issue in analytical chemistry and pharmaceutical technology. Despite strong overlap in the spectral bands of VAL and HCT, the proposed signal processing methods provided us with better results regarding the simultaneous determination of the related drugs, and they also allowed for the simultaneous demonstration of the in-vitro behaviour of the analysed drugs from the commercial tablets. After analysis, it was concluded that the proposed CWT signal processing methods gave comparable results to the literature-based HPLC method (Vinzuda et al., 2010).
Consequently, the proposed - CWT, mexh-CWT, RS-coif3-CWT, RS-mexh-CWT and DS1 methods can be
considered suitable for use in the quality control, routine analysis and simultaneous dissolution tests of tablets containing VAL and HCT drugs.
ACKNOWLEDGEMENT
This study was performed at the Chemometrics Laboratory of Faculty of Pharmacy, which was supported by the scientific research fund of Ankara University (Project Number 10A3336001). The authors would like to thank Ankara University for their support to be completed this study.
REFERENCES
ABBASI, T.M. Orthogonal projection approach and continuous wavelet transform-feed forward neural networks for simultaneous spectrophotometric determination of some heavy metals in diet samples. Food Chem., v.192,
p.548-556, 2016.
ANTIL, P.; KAUSHIK, D.; JAIN, G.; SRINIVAS, K.S.; THAKUR, I. UPLC method for simultaneous determination of valsartan & hydrochlorothiazide in drug products. J. Chromat. Separation Techniq., v.4, n.5, p.182-187, 2013.
ASHOUR, A.; HEGAZY, M.A.; MOHAMED, A.K.; MOHAMMAD, B.E. Simultaneous spectrophotometric determination of overlapping spectra of paracetamol and cafeine in laboratory prepared mixtures and pharmaceutical preparations using continuous wavelet and derivative
transform. J. Saudi Chem. Soc., v.19, n.2, p.186-192, 2015. FIGURE 7A -Dissolution profiles of VAL and HCT obtained
by applying RS-coif3-CWT method.
FIGURE 7B -Dissolution profiles of VAL and HCT obtained by
applying RS-mexh-CWT method.
FIGURE 8 - Dissolution proiles of VAL and HCT obtained by
CARLUCCI, G.; CARLO, V.; MAZZEO, P. Simultaneous determination of valsartan and hydrochlorothiazide in tablets by high-performance liquid chromatography. Anal. Lett., v.33, n.12, p.2491-2500, 2000.
DAUBECHIES, I. Ten lectures on wavelets. Philadelphia:
Society for Industrial and Applied Mathematics, 1992. 357p.
DINÇ, E.; BALEANU, D. A review on the wavelet transform applications in analytical chemistry. In: TAŞ, K.; MACHADO, J.A.T.; BALEANU, D. (Eds). Mathematical methods in engineering. Dordrecht: Springer, 2007.
p.265-285.
DINÇ, E.; BALEANU, D.; ÜSTÜNDAĞ, Ö. An approach to quantitative two-component analysis of a mixture containing hydrochlorothiazide and spironolactone in tablets by one-dimensional continuous daubechies and biorthogonal wavelet analysis of UV-spectra. Spectrosc. Lett., v.36, p.341-355, 2003.
DINÇ, E.; USLU, B.; ÖZKAN, S.A. Spectral resolution of a binary mixture containing valsartan and hydrochlorothiazide in tablets by ratio spectra derivative and inverse least square
techniques. Anal. Lett., v.37, n.4, p.679-693, 2004.
ERDEN, P.E.; TAŞDEMİR, İ.H.; KAÇAR, C.; KILIÇ, E. Simultaneous determination of valsartan and amlodipine besylate in human serum and pharmaceutical dosage forms by voltammetry. Int. J. Electrochem. Sci., v.9, p.2208-2220,
2014.
GUPTA, K.R.; MAHAPATRA, A.D.; WADODKAR, A.R.; WADODKAR, S.G. Simultaneous UV Spectrophotometric determination of valsartan and amlodipine in tablet. Int. J. ChemTech. Res., v.2, n.1, p.551-556, 2010.
LI, H.; WANG, Y.; JIANG, Y.; TANG, Y.; WANG, J.; ZHAO, L.; GU, J. A liquid chromatography/tandem mass
spectrophometry for the simultaneous quantification of
valsartan and hydrochlorthiazide in human plasma. J. Chromatogr. B, v.852, n.1/2, p.436-442, 2007.
MOHAMED, N.G. Simultaneous determination of amlodipine
and valsartan. Anal. Chem. Insights, v.6, p.53-59, 2011.
PEKTAŞ, G.; DINÇ, E.; BALEANU, D. Combined application of continuous wavelet transform-zero crossing technique
in the simultaneous spectrophotometric determination of
perindopril and indapamid in tablets. Quim. Nova, v.32,
n.6, p.1416-1421, 2009.
RAMACHANDRAN, S.; MANDAL, B.K.; NAVALGUND, S.G. Simultaneous spectrophotometric determination of valsartan and ezetimibe in pharmaceuticals. Trop. J. Pharm. Res., v.10, n.6, p.809-815, 2011.
RAMADAN, A.A.; AL-AKRAA, H.; MAKTABI, M. TLC
simultaneous determination of amlodipine, atorvastatin,
rosuvastatin and valsartan in pure form and in tablets using phenyl-modiied aleppo bentonite. Int. J. Pharm. Pharm. Sci., v.6, n.3, p.180-188, 2014.
RAO, B.U.; NIKALJE, A.P. Simultaneous determination of valsartan and hydrochlorothiazide in a tablet dosage form by liquid chromatography. Afr. J. Pharm. Pharmacol., v.8,
n.3, p.953-961, 2014.
SHAH, N.J.; SUHAGIA, B.N.; SHAH, R.R.; PATEL, N.M. HPTLC method for the simultaneous estimation of valsartan and hydrochlorothiazide in tablet dosage form. Indian J. Pharm. Sci., v.71, n.1, p.72-74, 2009.
SHAO, X.G.; ZHUANG, Y.D. Determination of chlorogenic acid in plant samples by using near-infrared spectrum with
wavelet transform preprocessing. Anal. Sci., v.20, n.3,
p.451-454, 2004.
SUDESH, B.M.; UTTAMRAO, K.S. Determination and validation of valsartan and its degradation products by isocratic HPLC. J. Chem. Metrl., v.3, n.1, p.1-12, 2009.
TIAN, D.F.; TIAN, X.L.; TIAN, T.; WANG, Z.Y.; MO, F.K. Simultaneous determination of valsartan and hydrochlorothiazide in tablets by RP-HPLC. Indian J. Pharm. Sci., v.70, n.3, p.372-374, 2008.
WALCZAK, B. Wavelets in chemistry. Amsterdam: Elsevier Press, 2000.
VIGNADUZZO, S.E.; CASTELLANO, P.M.; KAUFMAN, T.S. Development and validation of an HPLC method
for the simultaneous determination of amlodipine,
hydrochlorothiazide, and valsartan in tablets of their novel triple combination and binary pharmaceutical associations.
J. Liq. Chrom. Relat. Tech., v.34, n.19, p.2383-2395, 2011.
VINZUDA, D.U.; SAILOR, G.U.; SHETH, N.R. RP-HPLC method for determination of valsartan in tablet dosage form.
J. ChemTech. Res., v.2, n.3, p.1461-14676, 2010.
ZARGHI, A.; SHAFAATI, A.; FOROUTAN, S.M.; MOVAHED, H. Rapid quantiication of valsartan in human plasma by
liquid chromatography using a monolithic column and a
luorescence detection: application for pharmacokinetic
studies. Sci. Pharm., v.76, p.439-450, 2008.