Study of the Hearing Threshold of Dance
Teachers
Cristiane Nehring
1Magda Aline Bauer
1Adriane Teixeira
21Postgraduate Program of Child and Adolescent Health, Universidade Federal do Rio Grande do Sul, Porto Alegre, Rio Grande do Sul, Brazil 2Health and Human Communication, Universidade Federal do Rio
Grande do Sul, Porto Alegre, Rio Grande do Sul, Brazil
Int Arch Otorhinolaryngol 2015;19:222–228.
Address for correspondence Adriane Teixeira, Department of Health and Human Communication, Universidade Federal do Rio Grande do Sul, Rua Ramiro Barcelos, 2600 - Instituto de Psicologia da UFRGS, Porto Alegre, Rio Grande do Sul, Brasil. 90035003
(e-mail: [email protected]).
Introduction
The literature agrees that time of exposure to noise is associated with the start of hearing loss induced by noise. This disease is characterized by gradual hearing loss, as a result of continuous exposition to high levels of sound pressure, damaging external and internal ciliated cells in the organ of Corti.1,2Considering duration, frequency, inten-sity, and individual susceptibility, exposure to high levels of sound pressure is a major risk to hearing and can lead to several consequences to the body.3
There has been an increase in early diagnosis of hearing loss.4The most commonly used test for the evaluation of adult hearing is the pure tone audiometry (PTA). However, other methods that identify hearing issues before they can be perceived in PTA can be used to analyze the hearing of
subjects exposed to high levels of sound pressure. Such tests enable experts to provide proper guidance on how to prevent hearing loss.5One of the tests that makes an early diagnosis of hearing loss possible is the high-frequency audiometry (HFA), when frequencies are greater than 8,000 Hz.6–8It is important to note, however, that there is no normality pattern for hearing thresholds of high frequencies; thus, a comparison of thresholds in patient groups is necessary.9
Dance teachers and the high levels of sound pressure to which they are exposed should be taken into account when analyzing individuals subjected to occupational noise expo-sure.10,11For dancers, students and teachers, music is a tool of work. The volume of music in class is determined by the teacher.10,12,13To avoid any harm to teachers and students, it is important that they understand how damaging loud music can be throughout many hours of rehearsal and classes taught Keywords
►
hearing
►
hearing loss
►
noise-induced
►
audiometry
Abstract
Introduction
High sound pressure levels can cause hearing loss, beginning at high
frequencies.
Objective
To analyze the hearing thresholds of dance teachers.
Methods
This study had a cross-sectional, observational, prospective, and descriptive
design. Conventional and high-frequency hearing evaluations were performed with
dance teachers and subjects in the control group.
Results
In all, 64 individuals were assessed, 32 in the research group and 32 in the
control group. Results showed that individuals in the research group had hearing loss at
frequencies between 4 and 8 kHz, but no signi
fi
cant difference was found between
groups. Frequency analysis showed that individuals in the control group had higher
thresholds than individuals in the research group at the frequency of 0.25 kHz. In the
control group, men showed higher thresholds than women at the frequency of 9 kHz.
Conclusion
A low prevalence of hearing loss was found, with no difference between
teachers and subjects from the control group. No difference was found for hearing thresholds
at high frequencies between groups. Results have been partially affected by sex.
received June 7, 2014 accepted
December 15, 2014 published online March 10, 2015
DOI http://dx.doi.org/ 10.1055/s-0035-1547519. ISSN 1809-9777.
Copyright © 2015 by Thieme Publicações Ltda, Rio de Janeiro, Brazil
or planned.11Dance teachers need hearing monitoring and control. It is a fact, however, that these professionals are rarely monitored for their hearing and do not undergo audiological control advocated by regulatory standards of the ministry of labor, nor are they aware of the risks of systematic exposure to high levels of sound.
This study has been developed because high sound pres-sure levels can cause hearing loss initially in high frequencies; because teachers are not submitted to audiological control; and because no publications were found in literature regard-ing such professionals. Based on these assumptions, the objective of this research is to analyze the hearing thresholds at high frequencies in dance teachers.
Methods
This study had a cross-sectional, observational, prospective, and descriptive design. Samples were selected for conve-nience in a nonprobabilistic manner.
Because there is no standardization for the classification of hearing loss at high frequencies and seeking to analyze auditory effects when dance teachers are exposure to high sound pressure levels, two groups of individuals were includ-ed in this research. Thefirst group, referred to as the study group (SG), consisted of dance teachers. The second group, referred to as the control group (CG), included individuals that matched the age and sex of individuals from the SG but who had no history of exposure to high sound pressure levels. Dance academies were contacted and after authoriza-tion by the person in charge, teachers were contacted and invited to be part of the sample. Afterward, teachers were interviewed, so that their level of dance qualification, years of working experience, and style of dance taught at that time could be defined. Later, researchers attended one of their classes to measure the sound pressure levels at three different moments: in the beginning, middle, and end of each class. Result data showed exposure to high levels of sound pressure varied according to the type of dance taught.11In jazz, tap, street, and ballroom dance, the sound intensity was greater than 85 dB (A-weighted) at some points during class. Many teachers practice or have prac-ticed several styles of dance, thus an analysis considering dance style was not an option.
The CG was also formed in a nonprobabilistic manner. Individuals of the same sex and age of those included in the SG but who had no history of being exposed to high levels of sound pressure were invited to take part in the research. All subjects agreed to voluntarily participate in the study and signed an informed consent form.
This research consisted of a convenience nonprobability sampling technique with a sequential approach to a mini-mum amount of cases needed.
Due to the lack of information on the proposed topic of this study, to determine sample size for the audiometry result on the classification of normal hearing thresholds, the difference between the proportions of the two groups is assumed to reach a maximum of 15%. Considering a 10% margin of error, 5% significance level (α¼0.05), and a sample power of 80%
(β¼0.20), the minimum sample size was 30 cases per group, totaling 60 cases in study.
The inclusion criteria used in the research with dance teachers were individuals who were currently working as dance teachers; were free of middle and inner ear diseases; did not have related hearing loss; had no history of hearing impairment. There was no prior selection for their style of dance because, throughout their lives as students and teach-ers, they had practiced many different styles. Inclusion crite-ria for the CG were individuals who were free of hearing loss– associated disease and had no history of hearing loss or exposure to high sound pressure levels, determined on individual interviews.
Exclusion criteria were having conductive or mixed hearing loss, no auditory rest (14 hours), work history of exposure to high levels of sound pressure or history of diseases associated with hearing loss, and being 60 years old or over.
The initial procedure for the assessment of subjects in-cluded completing a sociodemographic questionnaire, which was developed especially for this study. After that, a hearing evaluation was performed, consisting of inspection of the external auditory meatus (meatoscopy), using the Mini 3000 Heine otoscope (Herrsching, Germany). After this phase, subjects performed PTA conducted in a soundproof booth. Hearing thresholds by air and bone conduction were ana-lyzed, as well as high-frequency hearing thresholds. For air conduction, the responses analyzed were for frequencies 0.25, 0.5, 1, 2, 3, 4, 6, 8, 9, 10, 12, 14, and 16 kHz. For bone conduction, thresholds studied were 0.5, 1, 2, 3, and 4 kHz. The equipment used included Interacoustics AC-40 (Assens, Denmark) with TDH 39 phones (Largo, USA) for the detection of pure tone thresholds, and R 80 phones (Milwaukee, USA) for research of auditory thresholds at high frequencies. The ascending/descending method and the pure warble tone were also used.14 First, a conventional audiometry was performed (250- to 8,000-Hz threshold analysis), and then high-frequency thresholds were researched. The researchers, using the same procedure, conducted all tests.
To analyze the presence of hearing loss (considering conventional audiometry), the analysis of results was made using the classification of Davis and Silvermann, by calculat-ing the average of responses to the frequencies of 500, 1,000, and 2,000 Hz.15Based on that, hearing was categorized as normal (mean up to 25 dB), mild loss (26 to 40 dB), moderate loss (41 to 60 dB), severe loss (61 to 90 dB), and profound loss (greater than 91 dB).16The classification used was hearing loss in frequencies between 4 and 8 kHz, because individuals exposed to high sound pressure levels can present normal tone average hearing loss in these frequencies.17
The research project was approved by the Research Com-mittee and by the Ethics and Research ComCom-mittee under the number 2011009.
because the data did not show normal distribution, hindering the use of the t test. To check for the normality of data distribution, the graphical inspection (histogram) and the hypothesis of Shapiro-Wilk were used. The degree of hearing loss of the SG and the CG was compared using the Fisher exact test. Statistical significance was set atp<0.05.
Results
The SG sample consisted of 32 dance teachers, and the CG consisted of 32 individuals. The average age of teachers was 32.0310.95 years with a median of 27.50. For subjects in the CG, the mean was 31.8810.66 years, with a median of 28.50. Statistical analysis showed no significant difference among the ages of subjects from the SG and the CG (p¼0.909).
The SG included 10 (31.3%) male subjects and 22 (68.8%) female subjects. The CG included 11 (34.4%) male subjects and 21 (65.6%) female subjects. No significant difference was found for the sex of subjects from the SG and the CG (p¼0.5). Thus, groups were homogeneous regarding age and sex.
For teachers, the average total time of work in dancing was 22.06 years, with a median of 21 and trend of 12 years. Teachers’average daily work time was 4.52 hours, with a 4-hour median for the duration of daily activity and 2-4-hour trend. Only 8 (25%) teachers reported having academic training in dance (technological progress, graduation, or masters). Many reported having graduated in physical edu-cation (28.12%) or in classical ballet (28.12%).
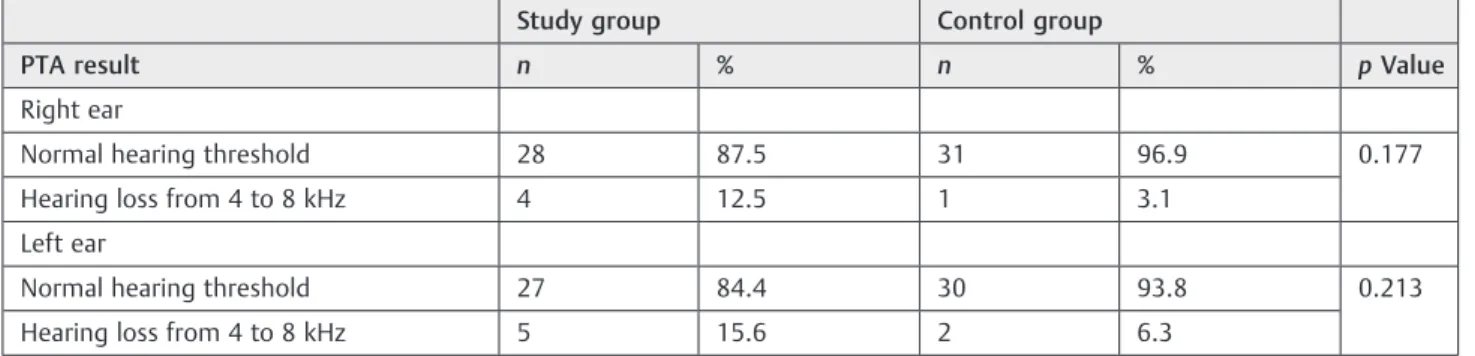
►Table 1shows hearing loss among sample components. As mentioned, individuals with conductive and mixed hear-ing loss were excluded from the sample. Thus, all subjects with hearing loss had sensorineural component. No signifi -cant difference was found between the two groups (SG and CG).
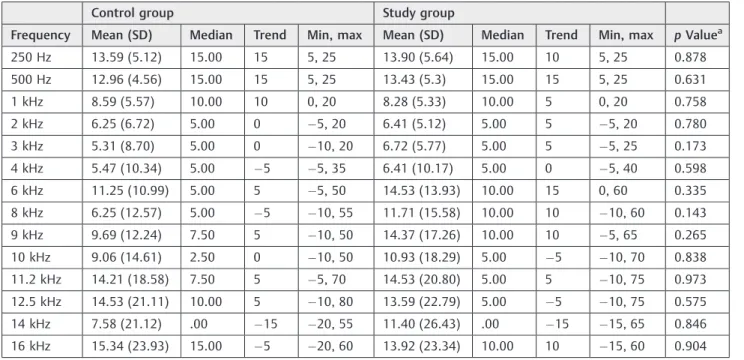
►Tables 2 and3show the descriptive measures (mean, median, trend, standard deviation, maximum and minimum values) of hearing thresholds by air for each frequency stratified by group and by ear.
The Mann-Whitney test was used to compare thresholds between groups, and a significant difference (p<0.05) was
found only for the 250-Hz frequency in the left ear, suggesting
that, on average, this frequency is higher in the CG in comparison to the teachers group.
►Tables 4and5show comparisons of hearing thresholds per frequency and sex. A significant difference (p¼0.016) was noted only for the frequency 9000 Hz in the left ear for subjects in the CG. According to findings, men have, on average, the 9,000-Hz frequency higher than women.
Discussion
The mean age of subjects was 32.03 in the SG, an age considered as young for the job market. In dancing, however, as it is commonly observed in dance academies, people at this age have already had a career for some time in the area. This is considered a profession for young people, because over the years dance teachers seek other means and activities.18This research showed that the majority of the SG subjects were women, a fact that strengthens data found in the literature.18 The average daily exposure was 4.52 hours. There was a variation, however, of 1 to 10 hours of daily dancing activities. Considering this fact, some of these teachers are at risk of being exposed to noise beyond the time allowed under the regulatory standard 15 of the Ministry of Labor. The permit-ted exposure to occupational noise is 85 dB (A-weighpermit-ted) for a period of 8 hours. For every 5 dB (A-weighted) of noise exceeding 85 dB (A-weighted), the duration of daily exposure should be reduced by half. Such excess time can cause major damage to the auditory system and symptoms beyond hear-ing impairment.19 Besides, none of the teachers studied reported using any type of personal protective equipment for the prevention of hearing impairment. These data rein-force the need to create a prevention approach for this group of individuals, who are usually not evaluated periodically.
The questionnaire showed, as mentioned, that the majori-ty of subjects in the sample did not have a degree related to dance. Because this profession has not yet been regulated, many teachers become qualified to work in dance schools after practical training in the area. Thisfinding may also be due to the limited offer of graduate courses for dance teachers in Brazil. The state of Rio Grande do Sul offers only two recently created undergraduate degrees in dance, both in public universities.20,21This situation may change over time if interest increases for specific training in the area of dancing.
Table 1 Audiological evaluation result, per ear
Study group Control group
PTA result n % n % pValue
Right ear
Normal hearing threshold 28 87.5 31 96.9 0.177
Hearing loss from 4 to 8 kHz 4 12.5 1 3.1
Left ear
Normal hearing threshold 27 84.4 30 93.8 0.213
Hearing loss from 4 to 8 kHz 5 15.6 2 6.3
The CG was created from the SG, which allowed the two groups to be homogeneous with respect to age and sex, differing only in the history of exposure to high sound pressure levels.
From the analysis of PTA results, there was no evidence of higher prevalence of hearing loss in individuals from the SG compared with the CG individuals. Thus, contrary to the research hypothesis, dance teachers, even with a history of
exposure to high sound pressure levels, showed no greater hearing loss than subjects that had not been exposed to high levels of sound.11Despite the absence of significant differ-ences between groups, we have observed that the SG has more individuals with hearing loss in both ears in the frequencies of 4 to 8 kHz.
Recently, a study found results of hearing loss in profes-sionals exposed to music at high levels of intensity, although Table 2 Descriptive measures of hearing thresholds on the right ear
Control group Study group
Frequency Mean (SD) Median Trend Min, max Mean (SD) Median Trend Min, max pValuea
250 Hz 13.59 (5.12) 15.00 15 5, 25 13.90 (5.64) 15.00 10 5, 25 0.878
500 Hz 12.96 (4.56) 15.00 15 5, 25 13.43 (5.3) 15.00 15 5, 25 0.631
1 kHz 8.59 (5.57) 10.00 10 0, 20 8.28 (5.33) 10.00 5 0, 20 0.758
2 kHz 6.25 (6.72) 5.00 0 5, 20 6.41 (5.12) 5.00 5 5, 20 0.780
3 kHz 5.31 (8.70) 5.00 0 10, 20 6.72 (5.77) 5.00 5 5, 25 0.173
4 kHz 5.47 (10.34) 5.00 5 5, 35 6.41 (10.17) 5.00 0 5, 40 0.598
6 kHz 11.25 (10.99) 5.00 5 5, 50 14.53 (13.93) 10.00 15 0, 60 0.335
8 kHz 6.25 (12.57) 5.00 5 10, 55 11.71 (15.58) 10.00 10 10, 60 0.143
9 kHz 9.69 (12.24) 7.50 5 10, 50 14.37 (17.26) 10.00 10 5, 65 0.265
10 kHz 9.06 (14.61) 2.50 0 10, 50 10.93 (18.29) 5.00 5 10, 70 0.838
11.2 kHz 14.21 (18.58) 7.50 5 5, 70 14.53 (20.80) 5.00 5 10, 75 0.973
12.5 kHz 14.53 (21.11) 10.00 5 10, 80 13.59 (22.79) 5.00 5 10, 75 0.575
14 kHz 7.58 (21.12) .00 15 20, 55 11.40 (26.43) .00 15 15, 65 0.846
16 kHz 15.34 (23.93) 15.00 5 20, 60 13.92 (23.34) 10.00 10 15, 60 0.904
Abbreviations: Min, minimum; max, maximum; SD, standard deviation. aMann-Whitney test, signi
ficance levelp<0.05.
Table 3 Descriptive measures of hearing thresholds on the left ear
Control group Study group
Frequency Mean (SD) Median Trend Min, max Mean (SD) Median Trend Min, max pValuea
250 Hz 13.28 (6.04) 15.00 15 0, 25 10.31 (5.07) 10.00 10 0, 25 0.025
500 Hz 11.56 (4.99) 10.00 10 5, 20 10.31 (4.74) 10.00 5 5, 20 0.340
1 kHz 7.34 (6.09) 5.00 5 5, 25 8.13 (4.71) 5.00 5 0, 20 0.501
2 kHz 5.78 (6.73) 5.00 5 5, 20 5.16 (4.3) 5.00 5 5, 15 0.915
3 kHz 6.72 (8.39) 5.00 5 5, 30 5.47 (6.14) 5.00 5 5, 25 0.846
4 kHz 7.34 (9.99) 5.00 0 5, 30 4.84 (8.75) 5.00 0 5, 40 0.351
6 kHz 10.78 (11.36) 10.00 5 5, 45 14.68 (13.00) 15.00 5 0, 65 0.196
8 kHz 6.25 (10.70) 2.50 0 5, 40 8.59 (12.65) 5.00 5 5, 60 0.254
9 kHz 11.71 (13.53) 5.00 5 5, 55 11.09 (16.10) 10.00 5 20, 70 0.891
10 kHz 8.44 (15.57) 5.00 0 10, 65 7.5 (16.89) 5.00 5 15, 70 0.674
11.2 kHz 14.21 (19.96) 10.00 5 10, 85 9.52 (20.01) 5.00 5 10, 80 0.187
12.5 kHz 13.06 (19.13) 5.00 5 10, 60 8.39 (19.46) 5.00 5 15, 75 0.277
14 kHz 10.64 (22.79) 10.00 15 20, 60 2.68 (18.48) 5.00 5 20, 65 0.219
16 kHz 17.50 (20.02) 15 5 15, 60 12.59 (19.38) 10 5 15, 55 0.384
Abbreviations: Min, minimum; max, maximum; SD, standard deviation. aMann-Whitney test, signi
no significant difference was found when comparing the length of employment, hours worked, and complaints to the results of the hearing evaluation. These data add to this research, emphasizing that there are studies that, despite having been done with small populations, indicate hearing loss in gym teachers, who are exposed daily to high levels of sound.22In this research concerning dance teachers, we also found that these professionals have some hearing damage due to exposure to music at high sound intensity. We believe that it is possible to connect and compare research works concerning the hearing of gym teachers with those address-ing the hearaddress-ing of teachers from several dance modalities, because both groups are exposed to high levels of sound intensity on a daily basis and because there are no other publications specifically addressing dance teachers.
In our sample, there was no significant difference in the comparison of hearing thresholds at different frequencies between groups, except for the frequency of 250 Hz, which is not affected by high sound pressure levels. This result is similar to the previously mentioned study conducted with a group of gym teachers who were often exposed to high sound pressure levels. The findings showed that 10% of participants had hearing loss at a frequency of 500 Hz and 20% had temporary auditory threshold shifts at frequencies of 500, 2,000, and 6,000 Hz. Even with low prevalence of hearing loss, it is important to implement hearing conservation programs for individuals in these risk groups.23
For this study, HFA was included because teachers could present initial hearing loss at high frequencies, demonstrat-ing that there was already cochlear damage.24,25 Evidence Table 4 Mean hearing thresholds of the right ear, in relation to frequency and sex
Study group Control group
Frequency (Hz) Sex Hearing thresholds (dBHL), mean (SD)
pValuea Hearing thresholds
(dBHL), mean (SD)
pValuea
250 Male 11.8 (5.1) 0.12 14.5 (5.9) 0.61
Female 15.0 (5.7) 13.18 (4.7)
500 Male 12.7 (5.1) 0.62 13.0 (4.8) 0.96
Female 13.8 (5.4) 12.9 (4.5)
1,000 Male 10.4 (4.7) 0.08 9.0 (5.6) 0.86
Female 7.1 (5.3) 8.4 (5.6)
2,000 Male 7.2 (5.1) 0.53 7 (7.1) 0.78
Female 5.9 (5.1) 5.9 (6.6)
3,000 Male 6.8 (5.1) 0.84 6.5 (10.2) 0.61
Female 6.6 (6.1) 4.7 (8.0)
4,000 Male 7.7 (8.4) 0.25 9.0 (13.0) 0.33
Female 5.7 (11.1) 3.8 (8.7)
6,000 Male 12.7 (10.5) 0.84 17.0 (14.7) 0.13
Female 15.4 (15.5) 8.6 (7.8)
8,000 Male 10.0 (13.6) 0.79 12.5 (17.0) 0.11
Female 12.6 (16.7) 3.4 (9.0)
9,000 Male 16.3 (14.1) 0.34 15.0 (15.9) 0.16
Female 13.3 (18.9) 7.2 (9.6)
10,000 Male 11.8 (15.8) 0.49 14.5 (18.7) 0.24
Female 10.4 (19.8) 6.5 (12.3)
11,200 Male 16.3 (19.6) 0.64 20.5 (23.0) 0.30
Female 13.5 (21.8) 11.3 (15.9)
12,500 Male 17.2 (23.5) 0.35 21.0 (26.8) 0.36
Female 11.6 (22.7) 11.5 (17.8)
14,000 Male 14.0 (29.2) 0.78 12.7 (21.0) 0.23
Female 10.0 (25.4) 5.4 (21.2)
16,000 Male 15.5 (29.19) >0.99 23.5 (22.3) 0.27
Female 13.5 (20.3) 12.7 (24.3)
showed, however, that there was no significant difference between the high-frequency hearing thresholds of the two groups and did not confirm the hypothesis of the study and of previous works on the effects of high sound pressure levels in hearing thresholds at high frequencies. Only higher auditory thresholds in the frequency of 250 Hz were noted for indi-viduals in the CG. It is important to mention, however, that the thresholds at this frequency were within normal limits (minimum values of 0-dB hearing loss and maximum values of 25-dB hearing loss) in both groups.
Considering the results of thresholds from the perspec-tive of the gender variable, tests showed that, at a frequency of 9000 Hz, men had a higher average of hearing thresholds than women. Previous studies show that men lose hearing before women and that loss starts in the high frequencies. This fact justifies the importance and functionality of the
HFA, which identifies the hearing threshold at higher frequencies, the first to be damaged.26Thus, the loss at 9,000 Hz in men may suggest the onset of hearing loss in this group. The fact that men lose their hearing earlier in life than women may be associated with the fact that they are exposed to more occupational noise, or, in the case of dancing, with the fact that they use music in higher sound intensity than do women. Moreover, we can point out that most male teachers perform street dance, a modality that typically requires louder music. This relationship is difficult to study due to the fact that there are few male dance teachers; in addition, another important fact is that this occupation is generally offered to younger people. Both of these considerations have been mentioned before.18
This study is believed to be a significant scientific contri-bution to the field of audiology, because no studies Table 5 Mean of hearing thresholds of the left ear, in relation to frequency and sex
Study group Control group
Frequency (Hz) Sex Mean (SD) pValuea Mean (SD) pValuea
250 Male 8.1 (4.6) 0.10 12.0 (4.8) 0.31
Female 11.4 (5.0) 13.8 (6.5)
500 Male 9.5 (4.1) 0.57 11.0 (3.9) 0.70
Female 10.7 (5.0) 11.8 (5.4)
1,000 Male 10.0 (4.4) 0.06 6.5 (6.2) 0.63
Female 7.1 (4.6) 7.7 (6.1)
2,000 Male 5.9 (5.8) 0.53 5.5 (7.6) 0.73
Female 4.7 (3.3) 5.9 (6.4)
3,000 Male 8.1 (6.4) 0.11 8.0 (9.7) 0.72
Female 4.0 (5.6) 6.1 (7.8)
4,000 Male 5.9 (6.6) 0.26 9.5 (12.3) 0.53
Female 4.2 (9.7) 6.3 (8.8)
6,000 Male 12.2 (7.1) 0.79 14.5 (16.9) 0.52
Female 15.9 (15.2) 9.0 (7.6)
8,000 Male 8.1 (10.5) 0.79 11.0 (15.5) 0.33
Female 8.8 (13.8) 4.0 (7.0)
9,000 Male 15.4 (13.2) 0.08 20.5 (16.4) 0.016
Female 8.8 (17.3) 7.7 (10.0)
10,000 Male 11.3 (15.1) 0.10 16.5 (21.8) 0.12
Female 5.4 (17.7) 4.7 (10.4))
11,200 Male 14.0 (19.8) 0.14 23.0 (27.4) 0.21
Female 7.0 (20.1) 10.2 (14.5)
12,500 Male 14.5 (25.9) 0.24 20.0 (22.5) 0.21
Female 5.0 (14.5) 10.2 (17.3)
14,000 Male 8.0 (24.8) 0.48 20.0 (26.6) 0.16
Female 10.0 (13.7) 6.8 (20.4)
16,000 Male 7.2 (20.1) 0.18 25.0 (19.5) 0.32
Female 15.2 (18.9) 15.0 (20.0)
concerning dance teachers have been found in literature. Further investigations are needed, especially considering that prevention is necessary not only for teachers but also for students, because they start dance practice in early stages. Moreover, the need for creating control programs for audio-logical purposes can be highlighted, because such professio-nals do not have the habit of undergoing periodic PTA.
Conclusion
Based on this analysis, a conclusion may be reached that, in this sample, a low prevalence of hearing loss was noted, with no significant difference between the presence of hearing loss in the SG and the CG. No difference was found for hearing thresholds at high frequencies, when comparing the two groups. Male subjects had higher thresholds than female subjects only in the frequency of 9,000 Hz. Thus, the sex variable has partially affected the results.
References
1 Boger ME, Barbosa-Branco A, Ottoni AC. A influência do espectro de ruído na prevalência de perda auditiva induzida por ruído em trabalhadores. Braz J Otorhinolaryngol 2009;75(3): 328–334
2 Nudelmann AA, Costa EA, Seligman J, Ibañez RN. Atualização sobre os documentos do Comitê Nacional de Ruído e Conservação Auditiva. In: Nudelmann AA, Costa EA, Seligman J, Ibañez RN, eds. PAIR—Perda auditiva induzida pelo ruído. Rio de Janeiro, Brazil: Revinter; 2001:225–234
3 Gonçalves CG. Saúde do trabalhador: da estruturação à avaliação de programas de preservação auditiva. São Paulo, Brazil: Roca; 2009
4 Lopes AC, Melo ADP, Santos CC. A study of the high-frequency hearing thresholds of dentistry professionals. Int Arch Otorhino-laryngol 2012;16(2):226–231
5 Guida HL, Sousa AL, Cardoso ACV. Relação entre os achados da avaliação audiométrica e das emissões otoacústicas em policiais militares. Int Arch Otorhinolaryngol 2012;16(1):67–73
6 Mehrparvar AH, Mirmohammadi SJ, Ghoreyshi A, Mollasadeghi A, Loukzadeh Z. High-frequency audiometry: a means for early diagnosis of noise-induced hearing loss. Noise Health 2011; 13(55):402–406
7 Sekhar DL, Rhoades JA, Longenecker AL, et al. Improving detection of adolescent hearing loss. Arch Pediatr Adolesc Med 2011; 165(12):1094–1100
8 Lopes AC. Audiometria Tonal Liminar. In: Bevilacqua MC, Martinez MAN, Balen AS, Pupo AC, Reis ACMB, Frota S, eds. Tratado de Audiologia. São Paulo, Brazil: Santos; 2011:455–474
9 Klagenberg KF, Oliva FC, Gonçalves CGO, Lacerda ABM, Garofani VG, Zeigelboim BS. Audiometria de altas frequências no
diagnós-tico complementar em audiologia: uma revisão de literatura nacional. Rev Soc Bras Fonoaudiol 2011;16(1):109–114 10 Oliveira GC, Silva CC. Nível de ruído nas aulas de ginástica e as
queixas auditivas apresentadas pelos professores. Rev Hórus 2010; 4(2):276–283
11 Nehring C, Teixeira AR, Bauer MA. Dance teachers in Porto Alegre (RS): levels of sound intensity during classes. Int Arch Otorhino-laryngol 2013;17(1):20–25
12 Brasileiro LT. A dança é uma manifestação artística que tem presença marcante na cultura popular brasileira. Pro-Posições 2010;21(3):135–153
13 Borsolan VA, Hainaski VL. A importância da música para a ativi-dade física. Jacarezinho (PR), Brazil: Faculativi-dade de Educação Física e Fisioterapia de Jacarezinho; 2004
14 Souza ACFR, Gil D. Fones de inserção: um estudo em crianças com e sem perda auditiva. Distúrb Comum 2011;23(1):71–78 15 Davis H, Silvermann RS. Hearing and Deafness. New York, NY: Holt,
Rinehart & Winston; 1970
16 Momensohn-Santos TM, Russo ICHP, Brunetto-Borgianni LM. In-terpretação dos Resultados da Avaliação Audiológica. In: Momen-sohn-Santos TM, Russo ICHP, eds. Prática da Audiologia Clínica. São Paulo: Cortez Editora; 2009:291–310
17 Neis F. Prevalência de perda auditiva e zumbido em um grupo de idosas institucionalizadas [monografia]. Canoas (RS), Brazil: UL-BRA; 2001
18 Brandão MD. Engajamento na dança: uma profissão tratada como juvenil. Rev Bras Ci Soc 2012;27(78):183–186
19 Samelli AG, Fiorini AC. Saúde Coletiva e Saúde do Trabalhador: Prevenção de Perdas Auditivas. In: Bevilacqua MC, Martinez MAN, Balen AS, Pupo AC, Reis ACMB, Frota S, eds. Tratado de Audiologia. São Paulo, Brazil: Santos; 2011:455–474
20 Curso de Dança da Universidade Estadual do Rio Grande do Sul. Available at: http://www.uergs.edu.br/index.php?action¼cursos LocaisDesc.php&cod¼7. Accessed February 25, 2013
21 Curso de Dança da Universidade federal do Rio Grande do Sul. Available at: http://www1.ufrgs.br/graduacao/xinformacoesaca-demicas/curriculo.php?
CodHabilitacao¼151&CodCurriculo¼1&sem¼2009022. Accessed February 25, 2013
22 Andrade IFC, Russo ICP. Relação entre os achados audiométricos e as queixas auditivas e extra-auditivas dos professores de uma academia de ginástica. J Soc Bras Fonoaudiol 2010;15(1):167–173 23 Pinto PM, Russo ICP. Estudo dos efeitos da exposição à música excessivamente amplificada sobre a audição de Professores de academia de ginástica. Rev CEFAC 2001;3:65–69
24 Lopes AC. Audiometria Tonal Liminar. In: Bevilacqua MC, Martinez MAN, Balen AS, Pupo AC, Reis ACMB, Frota S, eds. Tratado de Audiologia. São Paulo, Brazil: Santos; 2011:63–80