BAR, Rio de Janeiro, v. 13, n. 2, art. 4, e150058, Apr./June 2016
http://dx.doi.org/10.1590/1807-7692bar2016150058
Private Equity and Venture Capital Funds: What Drives the
Demand and Supply?
Ricardo dos Santos Dias1
Marcelo Alvaro da Silva Macedo2
Universidade Federal do Espírito Santo1
Universidade Federal do Rio de Janeiro2
Abstract
This study investigates determinants for the demand and supply for PE/VC funds. Six factors were identified through Factor Analysis: Economic Activity, Development of Stock Markets, Corporate Governance, Social and Environmental Development, Entrepreneurship and Taxation. These factors were defined through 25 variables and transformed into five factors by factor analysis. The resulting factors were used in econometric models for investigating relationships among said factors and the fundraising of PE/VC funds first, and then with the amount invested by PE/VC funds. The results indicate that investments are adversely affected by the depth of the capital market: the PE/VC funds seek an exit strategy which the stock market offers through IPOs (Initial Public Offering). Other significant factors were protection of investors, social and environmental development and level of entrepreneurship. Different from expected, the economic activity was of low impact on demand. The result seems controversial but its lack of significance highlights the importance of the capital market (through IPOs as a way of disinvestment) as a key driver of the PE/VC market. Taxation was also not significant to the demand side, a fact which denotes that the government can influence the local PE/VC market, and that it should offer high enough discount rates or tax incentives to mitigate the effect of other barriers faced by the PE/VC market.
Introduction
The Private Equity/Venture Capital (PE/VC) industry has grown in recent years especially in developing economies, where a considerable increase in financing activities has been observed. One possible reason could be the search for different paybacks in economies that go through an economic and institutional maturity, given that developed markets have been evidencing a decrease in profitability levels, since the 1990s (Comodo, 2009).
Despite it being widely disseminated around the world, the PE/VC activity is mostly concentrated in the United States of America and the United Kingdom, which together account for approximately 60% of the raised capital, although there has been a continuous reduction in the difference, compared to other countries. Brazil, China and India, for example, have created conditions for the development of the PE/VC activity, hence, they are the ones that have been successful in fundraising (Bain & Company Inc., 2013).
The fundraising and resource allocation process by PE/VC funds can boost the internal market of a country. So, it is intuitively possible to assert that countries will battle for international investments of PE/VC in an attempt to bring these resources to their market by creating attractive conditions for PE/VC managers. Therefore, it is the theoretical gap that this study seeks to fill: through the investigation of the factors influencing supply and demand PE/VC, it is possible to understand what makes a country more interesting for the attraction of international capital.
The main goal of this paper is to understand which factors influence the PE/VC market. To achieve it, we separately analyzed the supply and demand sides of transactions. Twenty-five variables were chosen consistent with the existing literature. Using Factor Analysis, we modeled variables that possibly affect the demand of the PE/VC. These factors include macroeconomic, financial, corporate governance, entrepreneurship, social and environmental development variables. We then exploited regressions made up of 25 countries over a six-year period (2006-2011).
The results indicate that investments are adversely affected by the depth of the capital market: PE/VC funds search for an exit strategy that the stock market can offer by means of IPOs (Initial Public Offering). Other significant factors were the protection of investors, environmental development and the level of entrepreneurship. Different from expected, the economic activity was negative significant to demand side.
The paper is structured as follows: The next section explains the market functioning and summarizes the findings of the existing evaluation of key drivers of the PE/VC. Third section shows the methodology aspects concerning dataset, multivariate data analysis and the models. The empirical results are interpreted in fourth section. And final section presents the conclusions.
Market functioning and literature review
Private Equity (PE) can be defined as business investments in companies that are not listed in the stock market. This type of acquisition has natural characteristics such as low liquidity, expectation of higher returns in the long-term and higher risk. Investments like this have also invariably been characterized by the informational asymmetry, since managers of PEs are seeking business opportunities that have not been priced by the market, which can be acquired at an attractive discount for a fair price and that have a valuation perspective (Agência Brasileira de Desenvolvimento Industrial[ABDI], 2011; Almeida, 2013; Gionelli, 2008; Lopes & Furtado, 2006).
as startups), and the term Private Equity are used to designate companies already established in the market.
The PE/VC market has three agents: management organizations, investors, and invested companies. Simplifying the dynamic market, investors apply their capital in investment vehicles that are driven by management organizations, which in turn, buy participation in portfolio companies for a specified period of time. At the end of this period, managers undo the long positions and assign the appropriate parties to investors, leaving a residual portion of that amount to pay for the service provided. Figure 1 illustrates the agents and their interactions below:
Figure 1. Agents of PE/VC Market
Source: Almeida, A. A. (2013). A influência do private equity e venture capital sobre a informatividade dos lucros no mercado brasileiro (p. 14) (Dissertação de Mestrado). Programa de Pós-Graduação em Ciências Contábeis, Universidade Federal do Espírito Santo, ES, Brasil. Retrieved from http://portais4.ufes.br/posgrad/teses/tese_5939_ DISSERTA%C7%C3O%20ANDR%C9%20PDF.pdf
Some studies discuss the determinant attributes to the activity of the PE/VC market, but most of them deal with Private Equity markets and Venture Capital markets separately. The reasons for this are obvious: while some attributes have the greatest impact on early-stage companies, there are other attributes that directly affect mature companies already established in the market (Jeng & Wells, 2000). However, the intention is not to discuss these differences, and as consequence, both segments will be treated as a single element.
The Private Equity and Venture Capital market is an important object of study in academic research. Some authors have focused on the economic impact of PE/VC funds (Engel, 2002; Hellmann & Puri, 2002; Kortum & Lerner, 2000), while other studies have focused on fund performance and management skills (Kaplan & Schoar, 2005).
Considering performance and value creation, Jensen (1989) argues that public companies suffer the entrenchment of management, allowing possible cash flow deviations, thus decreasing efficiency. Therefore, Leveraged Buyouts generate value through significant improvement of operational processes.
resulting in greater operational efficiency. Similar results can be found in Kaplan (1989), Kaplan and Schoar (2005) and Phalippou and Gottschalg (2007).
Contrary to expectations, only few of those papers attempted to understand the determinants of PE/VC. Studying the US market, Gompers and Lerner (1998) found out that performance, size and the fund age are important factors to raise more capital, additionally that PE/VC fundraising reacts positively to GDP growth and increases R&D expenditure. Lee and Peterson (2000) and Baughn and Neupert (2003) explored similar results and also argued that the national culture shapes individual orientation and consequently the environmental condition that ultimately leads to different entrepreneurship levels.
Romain and Pottelsberghe de la Potterie (2004) investigated the intensity determinants of the VC market in sixteen countries using panel regressions and found evidence that the market reacts positively and significantly to GDP growth. They also concluded that technological opportunity indicators (such as increased investment in research and development and number of patents) significantly influence the VC market.
Jeng and Wells (2000) argue that the PE/VC market evidences strong fluctuations over time and that the driving force of these fluctuations is the IPOs, making the development of the capital market one of the determining factors. Despite this result, fund managers tend not to take the companies they invest in, in countries where the most developed capital markets seek more IPO opportunities, as Israeli technology companies have done in NASDAQ. The increased costs and monitoring efforts of geographically distant companies partially explain this phenomenon.
Black and Gilson (1998) found similar results; however, they divided countries into two types: countries with centralization in the capital markets and countries with centralization in the banking system. This division will be the core of the development of the PE/VC market, since the centralization in the capital market is a precondition for the existence of a PE/VC vibrant market, given that a well-developed capital market makes an exit strategy possible through a public offer. In the same way, Balboa and Martí (2004) showed dependence between the growth of fundraising volume by PE/VC funds and the market liquidity in the previous year.
The legal environment also affects significantly as demonstrated by La Porta, Lopez-de-Silanes, Shleifer and Vishny (1997): a good legal environment protects potential financiers against expropriation by entrepreneurs increasing their willingness to supply resources to the funds in exchange for securities. Therefore, it extends the market range. The study evaluated laws protecting investors in 49 countries and showed that Common Law countries provide greater protection to investors than Civil Law countries. Some other evidences were gathered in the table below:
Table 1
Previous Evidence
Authors Results
Black and Gilson (1998) Economies with more developed capital market are more active in private equity than economy centered on banks.
Jeng and Wells (2000) 1) IPO as driving force for Private Equity investments;
2) Government policies can have a strong impact in Venture Capital market.
Balboa and Martín (2004) The volume growth in t of investments in Private Equity is partially explained by the market liquidity in t-1
Table 1 (continued)
Authors Results
Gompers and Lerner (2001) The level of the market liquidity influences the level of investments in Private Equity
Gompers and Lerner (1998) 1) The annual growth in Private Equity is affected by regulatory changes relating to pension funds, the growth of the economy as a whole, the fund's
performance in question and its reputation;
2) The tax on capital gains also influence the Private Equity activity
Cumming, Fleming and Schwienbacher (2006)
The quality of the legal system is more likely to facilitate the activities of private equity than the size of the stock market. The legal origin and accounting standards have significant impact on the governance of private
equity investments.
Armour and Cumming (2008) Government programs hinder more, rather than help the development of private equity markets.
Cullen and Gordon (2002) Taxes affect the entry and exit of business.
Megginsson (2002) Countries with growing R&D, especially in the national universities and laboratories, are important for the capital industry risk.
Schertler (2003) The number of employees in R&D and the number of patents as a proxy of human capital has strong significance in PE.
Groh, Liechtenstein and Lieser (2010)
Investor protection and capital market are very important determinants for attractiveness of PE/VC market.
As described, there are several determinants for PE/VC. Some of them can be observed at the macroeconomic level while others are microeconomic factors. Groh et al. (2010) identified what was most attractive for financiers, for it used 42 parameters that made up six factors: economic activity, taxes, investor protection, entrepreneurial culture, social and environmental development, depth of capital market.
The following section presents these variables, how they were measured and grouped by factor analysis. We then developed a theoretical model that aimed at understanding the impact of these factors in the PE/VC market, especially on the demand side.
Methodology Aspects
Table 2
Constructs and Variables Used
Construct Variable Source
Intensity of Capital Market activity
IPO volume (% of GDP)
World Bank IPO numbers
Private credit available for banks and financial institutions (% of GDP)
Number of banks (total of agencies per 100,000 habitants)
Numbers of listed companies
Merge and Acquisition (% of GDP)
Thomson One Merge and Acquisition (numbers of negotiation)
Friendly environment for entrepreneurship
Number of procedures to open a new business
World Bank Number of trademarks and patents
Percentage of per capita income for the payment of fees and other expenses for compliance with legal records
Economic Activity
GDP per capita
World Bank GDP grow (%)
Price Level (2005 = 100)
Social Development S u b c on str u c t: Education
Number of researchers per million inhabitants
World Bank Expenditure per student, primary (% of GDP per
capita)
Expenditure per student, secondary (% of GDP per capita)
Communication
Internet users (per 100 people)
World Bank Fixed broadband Internet subscribers (per 100
people)
Telephone lines (per 100 people)
Crime Intentional homicides (per 100,000 people) World Bank
Corruption Perception Index Transparency.org
Investor Protection
Business extent of disclosure indexa
World Bank Ease of Shareholder Suits indexb
Strength of legal rights indexc
Taxes Corporate Tax Thomson One
Note. aBusiness extent of disclosure index is the World Bank disclosure index that measures the extent to which investors are
protected through disclosure of ownership and financial information. Ranges from 0 (less disclosure) to 10 (more disclosure);
bEase of Shareholder Suits index is the World Bank index that measures the shareholders’ ability to sue officers and directors
for misconduct. The index ranges from 0 (little to no ability to file suit) to 10 (greater ability to file suit); cStrength of legal
First, it is important to state that our data series is driven by previous literature findings. Our data covers the 2006 to 2011 period, and was composed of 25 countries: Argentina, South Africa, Australia, Brazil, Canada, Chile, Colombia, South Korea, Spain, USA, Finland, France, Holland, India, Israel, Italy, Japan, Malaysia, Mexico, Norway, UK, Russia, Germany, Sweden and Switzerland.
The selection of countries was also imposed by data availability. The major task at that point was to find appropriate variables that reveal the characteristics of the constructs. Table 2 shows the constructs, correlate variables and their sources.
Table 2 shows the constructs and variables we used to describe them; a total of 25 selected variables divided in 6 constructs. The construct Social Development was divided into 3 sub-constructs: education, crime and communication. The crime and education variables were used in previous research to describe the construct under discussion. Communication variables were added since weak telecommunication structures disturb the development of the economy and market competitiveness (Frieden, 2005) can have a strong impact on businesses related to technology: a common characteristic of startups financed by venture capital.
The study aims to understand the forces that influence the fundraising (supply side) and resource allocation process (demand side). Thus, the formed factors were used in econometric models taking the sum of the resources raised to measure its impact on the supply side, as dependent variables. Next, we tested a regression model using the same factors against the sum of the resources invested by PE/VC funds in companies as the dependent variable. A restrictive factor in obtaining this kind of data was the fact that those negotiations between PE/VC funds and firms are private, making its disclosure optional.
For this reason, the study was limited, in investigation, to the use of existing public information, which in this case was obtained from the Thomson Reuters database. The next dependent variables were formally defined as follow:
. Fundraising (FUNDR): Total funds raised by PE/VC funds coming from investors. Gompers and
Lerner (1998) define these resources as the desire of investors to deposit their capital excess in PE / VC funds. Quantitatively, it is measured by the sum of the resources of all resident funds in each country.
. Invested Resources (INVM): the amount of resources invested on the demand side of the PE/VC
market. The demand comes from entrepreneurs interested in obtaining resources from PE/VC funds. Numerically, it is the amount of resources invested by the PE/VC funds of each country in the sample.
Factor Analysis
Factor analysis is a technique that aims to synthesize a set of interrelated variables in order to find common factors. It allows the reduction of data into a smaller set of hypothetical variables that can compress what is common among the initial variables (Fávero, Belfiore, Silva, & Chan, 2009; Kim & Mueller, 1978).
Fávero, Belfiore, Silva and Chan (2009) divides the factor analysis into confirmatory and exploratory, the first being performed when there is solid prior knowledge of how the variables are related and, therefore, it is assumed that the factor structure is known. In the exploratory factor analysis there is little or no prior knowledge about the behavior of variables.
to Hair, Black, Babin, Anderson and Tatham (2005), applies to a correlation matrix of variables to identify the latent dimensions.
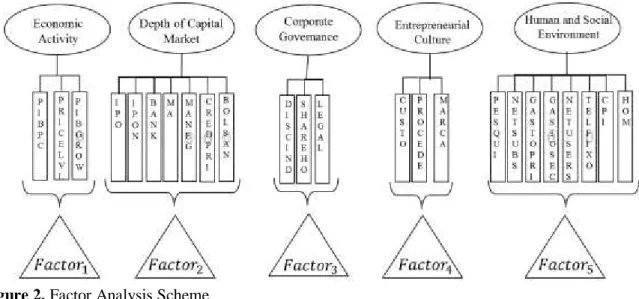
Factor analysis becomes crucial due to the number of variables used (25), which would cause an impact on the parsimony of the econometric model since the aim is to evaluate a model that best describes the relationship among the variables and, at the same time, to be as simple as possible. Thus, for each construct, a Factor analysis was used in order to extract a smaller data set, where the priority was the generation of a single factor for each construct.
Figure 2 demonstrates the use of this method in the study, where the ellipses represent the constructs, the rectangles represent the variables used to describe the overlying construct and the triangles represent the factors resulting from the use of the technique:
Figure 2. Factor Analysis Scheme
Econometric Models
Considering the previous studies and our proposal, we modeled a regression using the resulting factors to examine their impact on the dependent variable, as explanatory variables, Pooled regressions were used to describe the following linear relationship model between the variables:
� = � + � �+ � �+ � � �+ � �+
� �+ � ��+ ��
(E1)
� � = � + � �+ � �+ � � �+ � �+ � �+
� ��+ ��
(E2)
In both cases, we reported fixed effects as robustness check (Hausman’s test showed fixed effects instead of random effects). In the E1 model, FUNDR is the number of resources raised by PE/VC funds. In the E2 model, INVM is the amount invested by PE/VC funds in firms. The independent variables are the same for both regressions, where: ECO is Economic Activity factor, MCAP is factor of capital market, INVPROT is factor of investor protection, DSO is social development factor, EMP is entrepreneurial culture factor, and CORPTX is a variable for taxes, measuring the Corporate Tax. The models were preliminarily tested using the natural logarithm of the dependent variables, but the results remained unchanged and therefore were not reported.
argue that the size of the economy is an indicator of the number of organizations and general opportunities flow.
The previous literature reveals that the depth of capital market (� has a strong impact on the market PE/VC and a positive and significant relationship is expected). Consequently, a positive and significant relationship with � , as described by La Porta et al. (1997), is expected. � reflects the impact of environmental structure and a positive relationship is expected. � reflects the influence of entrepreneurial culture and it is expected to have a positive relationship: more available projects allow managers to choose those with the highest potential growth. Corporate taxation (� ) has a negative impact on the volume of PE/VC as described by La Porta et al. (1997) and for this reason, a negative relationship is foreseen.
Empirical Results
Table 3 shows the descriptive statistics of the variables commented on the theoretical framework and methodology divided by construct. Looking at the table below, the mean and median have values similar to the GDPPC, GDPGROW, PRICELVL, BANK, CREDPRIV, DISCINDEX, SHAREHD, LEGAL, PROCEDE, GASTOPRIM GASTOSEC, CPI and CORPTX variables. This shows possible evidence of normal distribution, but this analysis is not conclusive and a formal test is required. For this purpose, the Shapiro-Wilk test was executed. Only six variables did not reject the null hypothesis of normality (SHAREHD, LEGAL, PROCEDE, GASTOPRI, GASTOSEC, and CORPTX):
Table 3
Descriptive Analysis
Const. Variables Mean Med St. Dev. Kurt Asm Min Max Num.
ECO GDPPC 31199.16 34673.83 21811.06 0.02 0.56 830.16 99091.09 150
GDPGROW 2.47 2.71 3.45 0.79 -0.54 -8.54 10.26 150
PRICELVL 113.55 109.57 14.26 5.40 2.21 99.30 176.85 150
CAP. MARK
IPO 6129.77 2041.02 13376.55 23.07 4.48 0.00 96877.73 144
IPON 46.05 13.00 85.63 14.32 3.55 0.00 508.00 144
BANK 28.52 22.52 20.47 4.23 1.97 6.06 105.25 149
MA 99306.49 34766.21 228408.90 25.52 4.81 134.32 1675895.24 135
MANEG 1183.43 678.00 1771.96 13.39 3.49 51.00 10571.00 135
BOLSAN 1303.80 411.50 1551.28 0.22 1.26 79.00 5603.00 150
CREDPRIV 112.77 111.26 58.07 -1.08 0.00 13.03 215.06 142
INVEST. PROTEC
DISCINDEX 6.74 7.00 2.13 2.49 -1.16 0.00 10.00 150
SHAREHD 6.49 7.00 1.64 -0.65 -0.36 3.00 9.00 150
LEGAL 6.68 7.00 2.08 -0.81 -0.33 3.00 10.00 150
PROCEDE 7.37 7.50 3.29 -0.19 0.38 1.00 16.00 150
CUSTO 10.00 5.90 13.82 11.30 3.13 0.40 78.40 150
MARCA 67331.83 47717.50 61666.71 4.94 2.07 5447.00 306049.00 144
Table 3 (continued)
Const. Variables Mean Med St. Dev. Kurt Asm Min Max Num.
SDE PESQUI 2971.81 3185.78 2133.56 -0.88 0.25 154.00 7717.48 122
GASTOPRIM 18.64 18.43 4.20 0.08 -0.30 7.07 28.35 125
GASTOSEC 22.46 23.77 6.11 -0.78 0.06 9.97 36.53 127
NETUSERS 59.01 68.75 25.69 -0.89 -0.59 2.81 93.49 150
TELFIXO 38.00 43.41 17.82 -1.11 -0.24 2.68 67.12 150
NETSUBS 19.59 23.11 11.92 -1.38 -0.25 0.20 38.99 149
CPI 6.32 6.90 2.27 -1.36 -0.28 2.10 9.60 150
HOM 6.63 1.80 10.43 2.95 2.05 0.40 40.00 135
TAX CORPTX 29.91 30.00 5.79 -0.27 -0.19 17.00 40.69 150
Note. Constructs: ECO is the ‘Economy Construct’;CAP. MARK is the ‘Depth of Capital Market Construct’; INVEST. PROTEC is the ‘Investor Protection Construct’; ENTERP is the ‘Entrepreneurship Construct’; HSE is the ‘Social and
Environmental Development Construct’; and TAX is the ‘Taxation Construct’. Variables: GDPPC is Gross Domestic Product
per Capita; GDPGROW is the yearly grow of Gross Domestic Product (%); PRICELVL is the increase in the general price level of goods and services; IPO is IPO volume in % of GDP; IPON is the number of IPOs; BANK is the number of banks per 100,000 inhabitants; MA is the amount negotiated in Merger and Acquisitions; MANEG is the number of Merger and Acquisitions; BOLSAN is the number of listed companies; CREDPRIV is the amount of private credit by deposit banks and others financial institutions ( % of GDP); DISCINDEX is the World Bank disclosure index that measures the extent to which investors are protected through disclosure of ownership and financial information. Ranges from 0 (less disclosure) to 10 (more disclosure); SHAREHD is the World Bank index that measures the shareholders’ ability to sue officers and directors for misconduct. The index ranges from 0 (little to no ability to file suit) to 10 (greater ability to file suit); LEGAL is the strength of legal rights index that measures the level to which collateral and bankruptcy laws protect the rights of borrowers and lenders and thus facilitate lending. Ranges from 0 (weak) to 12 (strong); PROCEDE is the number of procedures to start a new business; CUSTO is the cost to start a new business (% of GDP per capita); MARCA is the number of new patents; PESQUI is the number of full-time researchers (per 1,000,000 habitants); GASTOPRIM is thegovernment expenditure on primary education (% of GDP); GASTOSEC is thegovernment expenditure on secondary education (% of GDP); NETUSERS is the number of internet users (per 100 habitants); TELFIXO is the number of telephones (per 100 habitants); NETSUBS is the number of internet subscriptions (per 100 inhabitants); CPI is the Corruption Perception Index. Ranges from 0 (more perception of corruption) to 10 (less perception of corruption); HOM is the number of homicides (per 100,000 habitants); CORPTX is the Corporative Tax (%).
Fávero et al. (2009) state that an assessment of the technical suitability is essential by means of some tests, which are presented below. The first one is the Correlation Matrix Analysis, seeking to identify significant relation, greater than 0.3, to justify the use of this method. The next step is the analysis of the KMO statistic, which needs to be greater than 0.5 in a range between 0 and 1; Bartlett’s test, in turn, examines the null hypothesis of the correlation matrix to be an identity matrix with the determinant equal to one. Once rejected, it means that the variables are correlated. After that, an Anti-image matrix has to be analyzed investigating whether any specific variable have to be dropped, so that values below and above the main diagonal reveal the inadequacy of the method.
Table 4 presents the total of the explained variance, revealing the number of factors of each
Table 4
Total of Explained Variance, KMO and Bartlett’s Test
Comp. Eigenvalues
Extractions Sums of Squared Loadings
KMO Bartlett Total % of
Variance Cumulative % Total
% of
Variance Cumulative %
Panel A – Economy
1 1.697 56.578 56.578 1.697 56.578 56.578 0.542 64.118*
2 0.843 28.087 84.665
Panel B – Intensity of Capital Market activity
1 4.193 59.902 59.902 4.193 59.902 59.902
0.775 773.873*
2 1.266 18.086 77.987 1.266 18.086 77.987
3 0.612 8.747 86.734
Panel C – Investor Protection
1 1.592 53.062 53.062 1.592 53.062 53.062 0,541 47.875*
2 0.894 29.806 82.868
Panel D – Friendly environment for entrepreneurship
1 1.648 54.928 54.928 1.648 54.928 54.928 0,548 47.875*
2 0.962 32.055 86.983
Panel E- Social Development
1 5.364 67.044 67.044 5.364 67.044 67.044 0,883 728.324*
2 0.829 10.358 77.402
Note. We choose to highlight the extracted factors in each construct.
Significance Level: * Significant at 1%
Panel E (Social and Environmental Development) presented the biggest explained variance, with a 67.04% total. The results of Table 3 show that all the constructs have formed a single factor, except for the Capital Market. This one was split in two factors to explain 77.98% of the variables variance. After evaluating the structure of these factors, it was possible to differentiate them through the variables that composed these factors: the first factor has grouped variables related to the capital market and the second factor has added variables of financial institutions and banks.
Table 5
Factors Summary
Construct Number of Factors Factor Name
Economy Activity 1 ECO
Intensity of Capital Market activity 2 MCAP
BANK
Investor Protection 1 INVPROT
Friendly Environment for
Entrepreneurship 1 EMP
Social Development 1 DSO
The results of the factor analysis changed the econometric models because they were increased by a new variable once the construct Capital Markets resulted in two factors: the first variable with the capital market characteristics (Label: MCAP) and the second factor variable with banking system characteristics (Label: BANK). Thus, the econometric models can be described by the following equations:
�= � + � �+ � �+ � ��+ � � �+ � �+
� �+ � ��+ ��
(E3)
� � = � + � �+ � �+ � ��+ � � �+ � �+
� �+ � ��+ ��
(E4)
This division of the construct corresponds to the Black and Gilson (1998) proposition and, therefore, � is expected to be positive, while � is expected to signalize a negative relationship with the dependent variable. In the next subsections we estimate the correlation matrix and regression models to analyze the coefficients.
Correlation Matrix
We evaluated existence of almost exact linear dependencies among the independent variables, which would result in the instability to estimated coefficients and models as a whole. There is some complexity in an attempt to accurately assess the individual effects of explanatory variables on the dependent variable, since they can be naturally related.
Table 6
Correlation Matrix
ECO MCAP BANK INVPROT EMP DSO CORPTX
ECO 1
MCAP 0.3374* 1
BANK 0.4616* 0.1117 1
INVPROT 0.1200 0.3634* -0.1766** 1
EMP 0.6137* 0.0922 0.2508* 0.2630* 1
DSO -0.7899* -0.3645* -0.4774* -0.1649** -0.6593* 1
CORPTX -0.0225 0.1383*** 0.0064 0.2631* -0.2121* 0.0995 1
Note. Table 6 shows the correlation matrix of the variables used in the study for indication of multicollinearity problems. We
choose to highlight the variable pairs that could cause multicollinearity. Variables: ECO is a variable of ‘Economy Construct’;
MCAP is a variable of Capital Market in ‘Intensity of Capital Market activity Construct’; BANK is a variable of bank system
in ‘Intensity of Capital Market activity Construct’; INVPROT is a variable of ‘Investor Protection Construct’; EMP is
variable of ‘Entrepreneurship Construct’; DSO is a variable of ‘Social Development Construct’; and CORPTX is a variable to Taxation.
Significance Level: * Significant at 1%; ** Significant at 5%; *** Significant at 10%.
It is possible to infer that absolute correlations higher than 0.80 indicate strong linear association and relationship collinear detrimental to the model (Hill, Griffiths, & Judge, 2010). By visual inspection, none of the variables in the correlation table exceeded the acceptable level, but three pairs of variables (ECO-EMP, ECO-DSO and DSO-EMP) obtained correlation values that were near to the critical point.
For this reason, we modeled auxiliary regressions (not reported) among the independent variables searching for multicollinearity problems. When variables ECO, DSO and EMP were used as dependent variables, these obtained r² coefficient of 0.669, 0.579 and 0.716, respectively. We conclude that none of the independent variables is highly collinear with any other because the R² coefficients of the auxiliary regressions were not greater than 0.80 (Hill et al., 2010).
Before reporting the results of the regressions we tested some assumptions:
. Homoscedasticity: The Breusch-Pagan test for E3 equation resulted in Chi-Square of 420.74 (p-value < 0.0001), and 383.72 (p-value < 0.0001) for E4 equation, rejecting the null hypothesis of
homoscedasticity of residues. As a corrective measure we used the White’s robust correction.
. Normality: The Asymmetry/Kurtosis test for Normality was used where the null hypothesis is normality of residues. This test resulted in statistical chi-square of 24.97 (p-value < 0.0001) for the E3 model and chi-square statistic of 18.34 (p-value < 0.0001) for the E4 model, rejecting the null hypothesis of normality. Despite the results, we used the recommendations of Brooks (2008) and Levine, Berenson and Stephan (2005) which emphasize that for sample sizes that are sufficiently large, violation of the normality assumption is virtually inconsequential. Based on the central limit theorem, the authors have emphasized that the test statistics will asymptotically follow the appropriate distributions even in the absence of error normality.
Econometric Results
Table 7
Econometric Results: Both Sides
(FUNDR) (INVM)
Variables Robust Fixed Effects Robust Fixed Effects
ECO 4100.94***
(2180.46) 7890.72** (3807.05) -2788.25 (1917.81) -1990.01** (799.19)
MCAP 49431.28*
(5997.06) 75230.7* (6544.54) 3123.99** (1300.69) 2705.25*** (1373.86)
BANK -17159*
(2921.18) -18004.37* (5166.63) -2198.53*** (1172.76) -2043.62*** (1084.60)
GC -5546.53*
(1768.25) -17858.56* (3381.85) 1414.35*** (7353.35) 1335.97 (2900.85)
EMP 6499*
(2103) 2735 (10218.07) 2377.53** (1161.33) -675.23 (2145.02)
DSO 8890.16*
(2475.67) -11431.03 (8801.96) 7398.28* (2685.65) 518.90 (1847.75)
CORPTX -510.01***
(282.43) 168.48 (965.40) -12.665 (108.42) -127.15 (202.66)
CONSTANT 30973.39*
(8842.03) 10314 (29291.73) 4816.99 (3942.40) 8845.59 (6149.06)
Observations 150 150 150 150
R-squared 0.848 0.644 0.165 0.175
Adj R-squared 0.840 0.478 0.124 0.139
F Stat 10.59* 23.96* 3.70* 4.18*
Note. Variables: ECO is a variable of ‘Economy Construct’; MCAP is a variable of Capital Market in ‘Depth of Capital Market
Construct’; BANK is a variable of bank system in ‘Depth of Capital Market Construct’; INVPROT is a variable of ‘Investor
Protection Construct’; EMP is variable of ‘Entrepreneurship Construct’; DSO is a variable of ‘Social and Environmental
Development Construct’; and CORPTX is a variable to Taxation.
Significance Level: * Significant at 1%; ** Significant at 5%; *** Significant at 10%.
On the demand side (VAR: INVM), the explanatory variables presented statistically significant coefficients for the variables MCAP and EMP at 5% of significance level. The variables BANK and INVPROT have presented significant coefficients at 10% of significance, and DSO at 1% of significance level. CORPTX and ECO were not significant. However, from the fixed effects regression it shows the variable ECO as negative and significant.
One possible explanation is the pursuit of differentiated returns by PE / VC fund managers in countries whose economic activity is still in a maturing process. In developed markets the scenario is reversed since they have difficulty in maintenance of profitability of the early 90s (Comodo, 2009). The result seems controversial but its lack of significance highlights the importance of the capital market (through IPOs as a way of disinvestment) as key drivers of PE/VC market. Similar results can be found in Jeng and Wells (2000, p. 32) who claim that “the absence of significance on our macroeconomic variable, GDP growth, underscores the importance of IPOs as the main explanatory factor for venture capital and private equity investments”.
negative one with the second (Black & Gilson, 1998). Through relationship, it is possible to infer that the capital market positively influences the generation and maintenance of a vibrant PE/VC market. Inversely, the banking system has a negative effect, which weakens the PE/VC market. One possible explanation is the necessity PE/VC funds have for an exit strategy. Among the possibilities, the capital market provides an efficient and widely used way out for companies financed by PE/VC funds: the IPO.
The investor protection factor (INVPROT) resulted in positive and significant relationship (significance level: 10%). The result confirms, on the demand side, those found out by La Porta et al. (1997) who state that a structured legal environment protects potential financiers of being expropriated, which increases the willingness to allocate their financial resources on riskier investments such as stock, which in turn enhances the participation of PE/VC funds.
The variable of entrepreneurial culture (EMP) resulted in a positive and significant coefficient, confirming the findings of previous studies (Gompers & Lerner, 1998; Romain & Pottelsberghe de la Potterie, 2004). The result of this variable relates to the findings by Gompers and Lerner (1998, p. 188) which concluded that “the greater the number of good firms, the greater the demand for Venture Capital”.
The corporate tax value was not significant. One possible explanation is that the levels of taxation in the sample are too close and did not change over time and therefore do not impact the PE/VC market. This means that for a government to influence the local PE/VC market, it should offer discount rates or high tax incentives, enough to mitigate the effect of other barriers faced by PE/VC market.
The Social Development factor (DSO) has a significant impact on the demand side: the sub-levels of the construct help to explain the investments of PE/ VC funds. Given the construct characteristics, the most difficult task was to find variables that could properly identify it. Besides variables like education and crime, communication is also important, since it impacts startups linked to the technology sector (app companies for example). This could be crucial in an investment decision due to the dependence of this market on technological infrastructure for dissemination and functioning of products.
On the supply side the variable for economic activity was significant only at 10%, contrary to the difference found by Jeng and Wells (2000) but in accordance with the evidence of Gompers and Lerner (1998). Again the MCAP and BANK variables were significant and their coefficients had their signs as expected and proposed in the literature.
The INVPROT variable resulted in a negative and significant coefficient which is contrary to the results found by La Porta et al. (1997). This result obtained a different signal from that obtained on the demand side, a condition that evidences that the motivations of agents change according to the financial flow: while on the supply side, fundraising is adversely affected when there is greater protection to investors, funds seek better protective conditions to put money on the demand.
The level of entrepreneurship resulted in a sign as expected: the positive impact shows that the supply side is also sensitive to the number of new businesses. As well as on the demand side, the Social Development factor was significant and positive. This means that for solid investments by funds to become effective, the environment must provide qualified persons, low criminality, and quality communication structure.
Taxation has a negative and weak significant impact (significant at 10% level only) on the supply side and shows that, in comparison with other factors, this is the one of least impact. It reinforces the idea that for greater impact, higher discount rates or incentives should be provided for both the demand and the supply sides.
low impact on the analysis and conclusions. Since there was no sign of change, only small changes in levels of significance, these do not impact the analyses substantially.
Discussions
Despite the increasing growth in recent years, the PE/VC market faces challenges to its stabilization, since it is influenced by regional characteristics. One is the cultural differences in willingness to make riskier investments as pointed out by Black and Gilson (1998). A possible solution for investors in conservative cultures would be investing in geographically distant companies, but the cost of monitoring can explain why this solution does not occur in practice (despite the Israeli case, see Jeng & Wells, 2000).
The results show that there is dependence between the capital market and the PE/VC market, but also suggest that the shrinkage of the PE/VC market may occur due to the lack of secondary institutions that support fundraising and investment activities. Thus, to attract investors, a local infrastructure with ability to find lucrative opportunities, smooths the bureaucratic issues and ensure compliance with the contracts is required.
Another possible cause is that investment in PE/VC activities often goes beyond the allocation of financial resources, given that a non-financial contribution (management activities) is common. However, the latter is an uncommon fact among investors in the banking system.
Overall, it was understood that stimulating the analyzed constructs singly, may be an ineffective way to strengthen the PE/VC market. For example, countries which reduce taxes in PE/VC transactions as incentive to this market cannot attract the attention of the PE/VC managers if they have high rates of unemployment, corruption and bribery.
Concluding Remarks
Our methodological structure consisted of a descriptive analysis, a factor analysis and multiple regressions. The results were achieved by econometric models with a sample of six years (2006-2011) and twenty-five countries and we employed factor analysis in order to condense the twenty-five variables that characterize the six constructions. Among the results, our greatest contribution consists of the evidence concerning the importance of the capital market to a higher level of fundraising: dynamic stock markets, with many public offerings guarantee liquidity to the PE/VC market, which allows funds a way of safe divestment.
Our results reinforce the findings in the literature: a positive relationship between the levels of financing generated by PE/VC funds and the depth of the capital market. The demand and supply side of PE/VC market proved strongly sensitive to the volume traded in the stock market, the number of IPOs and the number of M&A, for example. This explains, for example, the reason for the US being the biggest PE/VC market. Obviously this is not the only factor, but it is the most relevant. In general, there is a dependency between the depth of the capital market and the amount of funds raised.
The PE/VC market is positively affected by the Social and Environmental Development factor at both ends. This shows that a PE/VC market growth occurs when the environment provides resources and ideal conditions. Reversing the idea, it could be argued that the PE/VC market tends to start with a greater chance of success in locations where there is low crime, qualified people available, and a quality communication structure.
The results reveal the importance of these constructs to PE/VC market, but it is clear, for example, that the depth of the capital market has greater impact than taxation. Conclusions as the one discussed in this study can impact recent research as that of Groh et al. (2010) which, for the construction of attractiveness indices, considered these constructs equally.
Our research has a variety of practical implications for those interested in stimulating the PE/VC market: in fundraising, the evidences indicates that specific policies are necessary to the greater commitment in the PE/VC market, or rather; current policies have not had the desired effect, at least in the sampled countries.
Acknowledgements
The authors gratefully acknowledge the contributions of Paul Victor Gomes Novaes, Luiz Cláudio Louzada (UFES) and Alfredo Sarlo Neto (UFES).
References
Agência Brasileira de Desenvolvimento Industrial. (2011). A indústria de private equity e venture capital – 2º censo brasileiro. Retrieved from http://www.abdi.com.br/Estudo/Private_Equity_e_Venture_Censo.pdf
Almeida, A. A. (2013). A influência do private equity e venture capital sobre a informatividade dos lucros no mercado brasileiro (Dissertação de mestrado). Programa de Pós-Graduação em Ciências Contábeis, Universidade Federal do Espírito Santo, Espírito Santo, Brasil. Retrieved from http://portais4.ufes.br/posgrad/teses/tese_5939_DISSERTA% C7%C3O%20ANDR% C9% 20PDF.pdf
Armour, J., & Cumming, D. (2008). Bankruptcy law and entrepreneurship. American Law and Economics Association, 10(2), 303-350. doi: 10.1093/aler/ahn008
Balboa, M., & Martí, J. (2004, June/July). An integrative approach to the determinants of private equity fundraising. Proceedings of the EFMA 2004 Basel Meetings Paper, Basel, Switzerland.
Bain & Company, Inc. (2013). Global private equity report. Retrieved from http://www.bain.com/Images/BAIN_REPORT_Global_Private_Equity_Report_2013.pdf
Baughn, C. C., & Neupert, K. E. (2003). Culture and national conditions facilitating entrepreneurial start-ups. Journal of International Entrepreneurship, 1(3), 313-330. doi: 10.1023/A:1024166923988
Black, B. S., & Gilson, R. J. (1998). Venture capital and the structure of capital markets: banks versus stock markets. Journal of Financial Economics, 47(3), 243-277. doi: 10.1016/S0304-405X(97)00045-7
Comodo, G. C. (2009). Uma análise comparativa entre as estruturas de private equity e venture capital nos EUA e no Brasil (Dissertação de mestrado). Escola de Administração de Empresas de São Paulo, Fundação Getúlio Vargas, São Paulo, SP, Brasil.
Cullen, J., & Gordon, H. R. (2002). Taxes and entrepreneurial activity: theory and evidence for the U.S. [Working Paper nº 9015]. National Bureau of Economic Research, Cambridge, MA.
Cumming, D., Fleming, G., & Schwienbacher, A. (2006). Legality and venture capital exits. Journal of Corporate Finance, 12(2), 214-245. doi: 10.1016/j.jcorpfin.2004.12.004
Engel, D. (2002). The impact of venture capital on firm growth: an empirical investigation [ZEW Discussion Paper
nº
02-02]. ZEW - Centre for European Economic Research, Mannheim, Germany. Retrieved from http://ssrn.com/abstract=319322Fávero, L. P., Belfiore, P., Silva, F. L., & Chan, B. L. (2009). Análise de dados: modelagem multivariada para tomada de decisões. Rio de Janeiro: Elsevier.
Frieden, R. (2005). Lessons from broadband development in Canada, Japan, Korea and the United States. Telecommunications Policy, 29(8), 595-613. doi: 10.1016/j.telpol.2005.06.002
Gionelli, S. P. O. (2008). Os gestores de private equity e venture capital influenciam a governança corporativa das investidas? Evidências das empresas estreantes na Bovespa (Dissertação de mestrado). Escola de Administração de Empresas de São Paulo, Fundação Getúlio Vargas, São Paulo, SP, Brasil.
Gompers, P. A., & Lerner, J. (1998). What drives venture fundraising? Brooking Papers on Economic Activity: Microeconomics, 149-204. Retrieved from http://www.brookings.edu/~/media/projects/bpea/1998-micro/1998_bpeamicro_gompers.pdf
Gompers, P., & Lerner, J. (2001). The venture capital revolution. Journal of Economic Perspectives, 15(2), 145-168. doi: 10.1257/jep.15.2.145
Groh, A. P., Liechtenstein, H. von, & Lieser, K. (2010). The European venture capital and private equity country attractiveness indices. Journal of Corporate Finance, 16(2), 205-224. doi: 10.1016/j.jcorpfin.2009.09.003
Hair, J., Black, W. C, Babin, B. J., Anderson, R. E., & Tatham, R. L. (2005). Multivariate data analysis. Upper Saddle River, NJ: Pearson Prentice Hall.
Hellmann, T., & Puri, M. (2002). Venture capital and professionalization of start-up firms: empirical evidence. Journal of Finance, 57(1), 169-197. doi: 10.1111/1540-6261.00419
Hill, R. C., Griffiths, W. E., & Judge, G. G. (2010). Econometria. São Paulo: Saraiva.
Jeng, L., & Wells, P. C. (2000). The determinants of venture capital funding: evidence across countries. Journal of Corporate Finance, 6(3), 241-289. doi: 10.1016/S0929-1199(00)00003-1
Jensen, M. C. (1989). Eclipse of the public corporation. Harvard Business Review, 67, 61-74. Retrieved from https://hbr.org/1989/09/eclipse-of-the-public-corporation
Kaplan, S. (1989). The effects of management buyouts on operating performance and value. Journal of Financial Economics, 24(2), 217-254. doi: 10.1016/0304-405X(89)90047-0
Kaplan, S., & Schoar, A. (2005). Private equity performance: returns, persistence, and capital flows. The Journal of Finance, 60(4), 1791-1823. doi: 10.1111/j.1540-6261.2005.00780.x
Kortum, S., & Lerner, J. (2000). Assessing the contribution of venture capital to innovation. The RAND Journal of Economics, 31(4), 674-692. doi: 10.2307/2696354
La Porta, R., Lopez-de-Silanes, F., Shleifer, A., & Vishny, R. W. (1997). Legal determinants of external finance. The Journal of Finance, 52(3), 1131-1150. doi: 10.1111/j.1540-6261.1997.tb02727.x
Lee, S. M., & Peterson, S. J. (2000). Culture, entrepreneurial orientation, and global competitiveness. Journal of World Business, 35(4), 401-416. doi: 10.1016/S1090-9516(00)00045-6
Levine, D. M., Berenson, M. L., & Stephan, D. (2005). Estatística: teoria e aplicações – usando microsoft excel. Rio de Janeiro: LTC Ed.
Lopes, A. B., & Furtado, C. V. (2006). Private equity na carteira de investimentos das entidades de previdência privada. Revista Contabilidade & Finanças, 7(2), 108-126. doi: 10.1590/S1519-70772006000500009
Megginsson, W. L. (2002). Towards a global model of venture capital? Journal of Applied Corporate Finance, 16(1), 89-107. doi: 10.1111/j.1745-6622.2004.tb00599.x
Muscarella, C. J., & Vetsuypens, M. R. (1990). Efficiency and organizational structure: a study of reverse LBOs. The Journal of Finance, 45(5), 1389-1413. doi: 10.1111/j.1540-6261.1990.tb03720.x
Phalippou, L., & Gottschalg, O. (2009). The performance of private equity funds. The Review of Financial Studies, 22(4), 1747-1776. doi: 10.1093/rfs/hhn014
Romain, A., & Pottelsberghe de la Potterie, B. van (2004). The determinants of venture capital: a panel data analysis of 16 OECD countries [Working Paper WP-CEB 04/015]. Research Institute in Management Sciences, Université Libre de Bruxelles, Brussels.
Schertler, A. (2003). Driving forces of venture capital investments in Europe: a dynamic panel data analysis [Working Paper, nº 1172]. Kiel Institute for the World Economy, Kiel, Germany.
Authors’ Profiles
Ricardo dos Santos Dias
Av. Fernando Ferrari, 514, Goiabeiras, 29075-910, Vitória, ES, Brazil. E-mail address: [email protected]
Marcelo Alvaro da Silva Macedo
APPENDIX
Additional Econometric Results: Both Sides with Log on Dependent Variable
(LnFUNDR) (LnINVM)
Variables Robust Fixed Effects Robust Fixed Effects
ECO 0.235 0.624** -0.497* -0.629**
(0.179) (0.264) (0.167) (0.285)
MCAP 1.270* 1.370* 0.238*** 0.531***
(0.121) (0.453) (0.139) (0.286)
BANK -0.177*** -0.633*** -0.504* -0.192***
(0.104) (0.358) (0.135) (0.114)
GC -0.185** -0.585*** 0.444** 0.290
(0.109) (0.352) (0.174) (0.605)
EMP 0.439* 0.327 0.167 0.438
(0.169) (0.708) (0.224) (0.447)
DSO 0.704* 0.226 1.956* -0.577
(0.169) (0.610) (0.306) (0.385)
CORPTX -0.0815* -0.145** -0.0331 -0.0100
(0.0208) (0.0669) (0.0291) (0.0423)
CONSTANT 4.834* 2.933 5.010* 5.726*
(0.647) (2.029) (0.854) (1.282)
Observations 150 150 150 150
R-squared 0.612 0.166 0.558 0.123
F-stat 33.71* 3.35* 25.12* 2.37**
Note. Robust standard errors in parentheses.