Can out-of-stock bring
benefits for retailers?
The effect of out-of-stock of national
brand on the choice of private label
Oleksandra Matvieieva
Dissertation written under the supervision of
Prof. Paulo Romeiro
Dissertation submitted in partial fulfilment of requirements for the International
MSc in Management, at the Universidade Católica Portuguesa, June 2020.
ABSTRACT
Title: Can out-of-stock bring benefits for retailers? The effect of out-of-stock of national brand
on the choice of private label
Author: Oleksandra Matvieieva
Given private label profits and strong competitive position across Western world, its further development is on of key focus areas for retailers. However, little attention was devoted to the out-of-stock (OOS) issue from the perspective of private label.
The dissertation empirically studied consumer behavior in out-of-stock and non-out-of-stock situations to find the effect of the OOS of national brand (NB) product on the likelihood of purchasing private label brand (PLB).
Following a review of the related academic research, an online survey was carried out investigating the effects of stock-out in the category of potato chips on the example of European supermarket chain LIDL. Based on the sample of 298 respondents, study provides the findings explaining the causality effect between the out-of-stock of NB and the likelihood of purchasing PLB.
The results demonstrate that significant relationship exists between these two variables and it is mediated by perceived quality of PLB. When encountering out-of-stock of NB the consumers are more likely to perceive the PLB quality higher, given that the PLB familiarity is high. In turn, the perceived quality of PLB has strong positive effect on the likelihood of purchasing PLB. These findings lead to the conclusion that private label can benefit from the out-of-stock of NB if retailers put effort in increasing PLB familiarity.
Keywords: Out-of-stock, Private Label, Perceived Quality
SUMÁRIO
Título: Poderá a ruptura de stock trazer benefícios aos retalhistas? O efeito da ruptura de stock
da marca nacional na escolha da marca própria.
Autora: Oleksandra Matvieieva
Dados os lucros das marcas próprias (MP) e a forte concorrência no mundo ocidental, a sua evolução é um ponto-chave para os retalhistas. No entanto, é dada pouca atenção à questão na rutura de stock na perspetiva da MP.
A dissertação procurou estudar empiricamente o comportamento do consumidor para entender o efeito da ruptura de stock do produto de marca nacional na probabilidade de compra do produto de MP.
Após, proceder a uma pesquisa académica, foi realizada uma pesquisa online para averiguar os efeitos da rutura de stock na categoria de batatas fritas, baseando na cadeia de supermercados europeia LIDL. Através da leitura de uma amostra de 298 entrevistas, o estudo forneceu conclusões que explicam o efeito da causalidade entre a rutura de stock da marca nacional (MN) e a probabilidade de compra da MP.
Quando ocorre uma rutura de stock da MN, há uma maior oportunidade para os consumidores percecionarem melhor a qualidade do produto de MP, somente se a familiaridade com MP está alta. Por sua vez, a perceção da qualidade da MP tem um efeito muito positivo na probabilidade de aquisição deste produto. Assim, chegamos à conclusão que a marca própria pode ser beneficiada pela rutura da marca nacional, caso os retalhistas se esforcem por aumentar a familiaridade de MP.
TABLE OF CONTENTS ABSTRACT ... II SUMÁRIO ... III TABLE OF CONTENTS ... IV TABLE OF FIGURES ... V TABLE OF TABLES ... VI TABLE OF APPENDICES ... VII
CHAPTER 1: INTRODUCTION ... 1
1.1BACKGROUND AND PROBLEM STATEMENT ... 1
1.2PURPOSE STATEMENT ... 2
1.3RELEVANCE ... 2
1.4RESEARCH METHODS ... 3
1.5DISSERTATION OUTLINE ... 3
CHAPTER 2: LITERATURE REVIEW AND CONCEPTUAL FRAMEWORK ... 4
2.1OUT-OF-STOCK ... 4
2.2PRIVATE LABEL ... 6
2.3IMPULSIVE BUYING ... 7
2.4PERCEIVED QUALITY ... 9
2.5STORE LOYALTY ... 9
2.6HYPOTHESES AND CONCEPTUAL FRAMEWORK ... 10
CHAPTER 3: METHODOLOGY ... 12
3.1RESEARCH APPROACH ... 12
3.2PRIMARY DATA ... 12
3.3DATA ANALYSIS ... 16
CHAPTER 4: RESULTS AND DISCUSSION ... 17
4.1DESCRIPTIVE STATISTICS ... 17
4.2HYPOTHESES TESTING ... 19
4.3ADDITIONAL ANALYSIS ... 26
4.4DISCUSSION ... 28
CHAPTER 5: CONCLUSIONS AND LIMITATIONS ... 31
5.1MAIN FINDINGS AND CONCLUSIONS ... 31
5.2MANAGERIAL AND ACADEMIC IMPLICATIONS ... 33
5.3LIMITATIONS AND FURTHER RESEARCH ... 34
REFERENCE LIST ... I APPENDICES ... VII
TABLE OF FIGURES
Figure 1: Conceptual Framework ... 11
Figure 2: Stimuli for non-out-of-stock condition ... 14
Figure 3: Stimuli for out-of-stock condition ... 14
Figure 4: Results of linear regression for Hypothesis H1 ... 20
Figure 5: Results of linear regression for Hypothesis H2 ... 21
Figure 6: Results of linear regression for Hypothesis H3 ... 21
Figure 7: Results of linear regression for Hypothesis H4 ... 22
Figure 8: Results of linear regression for Hypothesis H5 ... 23
Figure 9: Results of linear regression for Hypothesis H6 ... 23
Figure 10: Results of linear regression for Hypothesis H7 ... 24
Figure 11: Model 89 moderated serial mediation ... 25
Figure 12: Model 84 that includes Moderation effect of PLB familiarity ... 27
Figure 13: Effect of IBT on the likelihood of purchasing PLB ... 28
Figure 14: Effect of IBT on the likelihood of purchasing NB “Lay’s”... 28
TABLE OF TABLES
Table 1: Sample characteristics ... 17 Table 2: Reliability analysis results ... 19 Table 3: Results of the hypotheses testing ... 25
TABLE OF APPENDICES
Appendix 1: Online Study ... VII Appendix 2: Normality tests ... XV Appendix 3: Testing for multicollinearity of variables ... XVII Appendix 4: Testing for linearity of variables ... XVII Appendix 5: Plots for homoscedasticity ... XVIII Appendix 6: Serial mediation analysis – PROCESS Model 6 ... XX Appendix 7: Complete moderated mediation model – PROCESS Model 89 ... XXII Appendix 8: Additional analysis – Moderation effect of private label brand familiarity ... XXV Appendix 9: Additional analysis – Direct effects of impulse buying tendency ... XXVIII
CHAPTER 1: INTRODUCTION 1.1 Background and problem statement
The fast-evolving retail sector attracted countless amount of researchers over the past decades. The primary focus of such research was to study consumer behavior as well as to find solutions for the issues in retail. The issue of out-of-stock (OOS) – a situation when a product is unavailable for purchase when expected, grabs particular attention. Despite all the efforts to solve it, OOS is still very common in retail, both online and offline (Pizzi & Scarpi, 2013). The worldwide estimated cost of out-of-stock in retail is about $1 trillion (IHL Group, 2018). At the same time, a retail phenomenon of private label (PL) rapidly conquers the world. For retailers PL is a matter of interest because of its considerable benefits – retailers obtain higher margins on the private label than national brands and PL can be a great source for building store loyalty (Corstjens & Lal, 2000). The rise in popularity of PL brought a wave of disruption to the sector and keeps making the competition tougher for well-established global manufacturers (IRI, 2018).
The key issue of the out-of-stock for the retailers is lost sales due to consumers abandoning the purchase or deciding to look for the product in another store (Campo et al., 2003). The latter bears even higher risk, as the consumers might abandon the store where they encountered the lack of preferred item altogether (Koos & Shaikh, 2019). While many researchers investigated how consumers behave when facing stock-out (ex. Helm et al., 2013; Sloot et al., 2005), this study focused on one specific behavior – item substitution. On average, in OOS incidence, 45% of consumers choose to purchase another item (more often different brand) versus 31% of consumers who choose to look for the preferred item in another store (Gruen et al., 2002). Also, various studies looked into whether the consumers choose to substitute when facing OOS but not often into which item they would choose as a replacement (Campo et al., 2003). Yet from the category manager viewpoint, it is important to know what are the consequences of the OOS in the category specifically for the private label. This study presents an effort to find the answer to this question.
To reiterate, current dissertation seeks to address the issue of out-of-stock from the perspective of private label brand. Particularly, to discover whether the private label can benefit from the stock-out of the national brand.
1.2 Purpose Statement
The purpose of this study is to understand the effect that out-of-stock of a national brand has on the consumer likelihood of purchasing the private label brand. Moreover, the research aims to clarify the nature of such relationship by investigating the effects of selected consumer related factors on it.
In order to achieve this purpose, the subsequent research questions were framed:
RQ1: What is the effect of out-of-stock of a national brand product on the likelihood of purchasing private label brand.
RQ2: What effect does the impulse buying tendency have on the likelihood of purchasing private label brand in a situation of out-of-stock of national brand product.
1.3 Relevance
From the academic point of view, this research addresses the influence of the out-of-stock of national brand on private label – a perspective that, to the best of our knowledge, was not researched before. Although both topics were studied for many years, there exists a gap in the literature that would bridge these two subjects, both critically important for the retail sector. The worldwide report on out-of-stock from 2002 (Gruen et al., 2002) stated that if the item is substituted due to the stock-out, consumers tend to choose the cheaper substitute. This brings a notion that private label might be the product preferred as a substitute since it is on average 30% cheaper than the national brands (IRI, 2018). Present dissertation is an empirical investigation of this concept.
Prior research that looked into how the stock-out of one item can influence another item was conducted by running laboratory experiments offering participants three or four products to choose from (Fitzsimons, 2000; Ge et al., 2009; Huang & Zhang, 2016). Current study tried to show and explain such effect in a more realistic retail setting, with few brands and multiple SKUs (stock keeping units) present on the shelf. Combined with the previous findings this research can provide more comprehensive practical implications.
From the managerial perspective, the findings of this study might help in a better understanding of how to utilize the out-of-stock problem. We propose that perceived quality of private label and store loyalty are mediating factors for the out-of-stock response. Additionally, the study investigates what role, if any, does the consumer impulsiveness have on the behavior in a
stock-out situation. The conclusions of this research give solid insights on what are the factors that drive consumers who face OOS to choose private label. Furthermore, combined with category management expertise it can lead to more profound implications for private label within the category.
1.4 Research methods
In this study, we applied an empirical approach to answer the research questions. As the first step, secondary data was obtained through the review of previous academic research. Next, primary data was collected through an online survey. In an effort to study the OOS effects, a hypothetic out-of-stock situation was created using a fictitious product shelf. Participants were randomly allocated to one of the experimental groups – the ones who face out-of-stock condition and the others who faced non-out-of-stock condition. Applying the online survey method allowed to reach a great scale in affordable and time-efficient manner. The research was conducted over one category – potato chips, which limits the implications of the study. Also, for the purposed of the study one specific retailer was chosen (supermarkets chain LIDL) to replicate as closely as possible the product shelf and to be able to access a specific private label brand. The target population was chosen to be across all ages from 4 main countries: Portugal, Poland, Greece, and the United Kingdom.
After the data was collected, data analysis was performed using the statistical software IBM SPSS.
1.5 Dissertation outline
The dissertation is comprised of five chapters and is structured in the following way. The next, second, chapter briefly reviews the relevant academic literature and based on the theoretic concepts formulates the hypotheses. Then the methodology section of the study describes the research approach in detail. Next, in the fourth chapter, the results of empirical research are presented. Every hypothesis is tested and its results are discussed. The dissertation ends with the derived conclusions and implications for practitioners and academics. The last chapter ends with the study limitations along with some ideas for future academic research.
CHAPTER 2: LITERATURE REVIEW AND CONCEPTUAL FRAMEWORK
This chapter presents a condensed analysis of previous academic research on the relevant for this study theoretical concepts. The literature review was a foundation for creation of research questions and conceptual framework. The chapter ends with a presentation of research hypotheses and conceptual framework.
2.1 Out-of-stock
2.1.1 Definition of out-of-stock
Out-of-stock or stock-out is a situation when “a product is not found in the desired form, flavor or size, not found in saleable condition, or not shelved in the expected location – from the perspective of the consumer” (ECR Europe, 2003). In the retail setting, this definition implies that a product is not found by a shopper on the shelf as expected, even though the product might be in the inventory.
The out-of-stock issue is widely discussed and numerous studies were written on the topic. One of the first research (Peckham, 1963) indicates that on average as much as 8% of SKUs are out-of-stock on a typical day. In the following decades, these findings were confirmed by other studies (Coca-Cola Retailing Research Council, 1996; ECR Europe, 2003; Van Woensel et al., 2007), however acknowledging that there are significant differences between categories. That shows that despite over 50 years of development in retail the issue of OOS remains unresolved. Out-of-stock is an important topic in retail because it harms the revenues of both retailers and manufacturers. Researchers report that the unavailability of one unit from the assortment can decrease category sales by 2-4% (Campo et al., 2003; Gruen et al., 2002). Other studies found that providing an acceptable alternative product increases the chance of product or brand switch and can prevent lost sales for the retailer (Helm et al., 2013), however, when substituting consumers tend to select a cheaper option than initially planned (Gruen et al., 2002). In the situation when more than one item in the category is unavailable the lost sales grow dramatically and can lead to immediate loss of 30% of potential customers (Musalem et al., 2010).
2.1.2 Consumer reaction to out-of-stock
While encountering OOS consumers have different behavioral responses and most studies nowadays differentiate five main reactions. Consumer can potentially switch to a substitute brand (26% of consumers), purchase another item of the same brand (19%), buy a missing
product in a different store (31%), postpone a purchase to the next shopping occasion (15%), cancel the purchase at all (9%) (Gruen et al., 2002). Again differences could be observed in the consumer reactions across categories: in case of perishable products (like bread) only 6% would postpone the purchase (Van Woensel et al., 2007) while in the case of utilitarian grocery products 30% would postpone (Campo et al., 2000).
The determining aspect of consumer behavior in the stock-out situation is the degree of consumer dissatisfaction. Empty shelves cause consumer dissatisfaction and it is found that out-of-stock is the number one reason why consumers couldn’t fulfill their planned purchases (27.6% of consumers) (Kelly et al., 2000). Moreover, the study of Fitzsimons (2000) finds that consumers exposed to stock-out are less satisfied with their final purchase and are less likely to return to the store in the future. These findings are consistent with the study of Bolton (1998) who proves that consumer satisfaction is a key determinant for consumer retention. On the other hand, the dissatisfaction associated with making a purchase in a different store is higher than in case of product substitution, postponement, or abandonment of the purchase (Koos & Shaikh, 2019). This can be one of the reasons why more consumers make a choice of substitution instead of switching to another store.
Among the factors that can influence consumer reaction in the OOS situation studies indicate few main groups: consumer-related factors, product related and occasion related. Such consumer characteristics like age and shopping attitude affect specifically the likelihood of changing the store. Older individuals on average are less likely to change the store and more often postpone the purchase (Sloot et al., 2005) while shoppers with hedonic shopping attitude are more likely to look for the preferred item in a different store (Helm et al., 2013). Looking at product-related attributes, the most researched one is brand loyalty but interestingly there are inconsistent findings regarding the influence of brand loyalty on consumer behavior. Some studies suggest that brand loyal consumers will rather switch a store than look for an alternative product (Rani & Velayudhan, 2008), albeit others find no significant effect of brand loyalty (Helm et al., 2013). Finally, various situational factors, such as buying urgency and type of shopping trip, were previously examined. Consumers on a major shopping trip are much less likely to switch the store for just one product from a long shopping list (Campo et al., 2000). In a situation of time pressure during the shopping consumers are more likely to choose the substitute or cancel the purchase (Helm et al., 2013).
Majority of studies about the out-of-stock focus on consumer reaction in the situation when the preferred product by the customer is unavailable. Another stream of research studies the effect of the stock-outs on preference formation. The out-of-stock option is a phantom decoy (Farquhar & Pratkanis, 1993) and although unavailable it still influences the consumer choice similarly as a real decoy (Scarpi & Pizzi, 2013). First of all, the existence of phantom option conveys information about the preferences of others that can create desirability of certain product attributes (Ge et al., 2009; Huang & Zhang, 2016). Secondly, out-of-stock may cause a sense of urgency that will lead to an increased likelihood of purchase (Kramer & Carroll, 2009). Based on these findings, contradictory to the majority of studies, Huang and Zhang (2016) along with Ge and colleagues (2009) argue that stock-out can be beneficial for retailers if used to increase the sales of category by manipulating the OOS itself. Studies mentioned above demonstrate by series of experiments that in hypothetical out-of-stock situation consumers are more likely to buy the available option if they learn that there was an option that currently is not available. However, none of the studies, to our best knowledge, did the experiments in a retail setting with more than 4 options available. Having that in mind, current study intends to replicate as realistically as possible the product shelf to enable respondents to have the experience similar to real shopping instance.
2.2 Private Label
Private label or store brands are the goods sold exclusively by one retailer (Hoch, 1996). PL emerged in the 19th century and by today it is widespread across industries, from consumer packaged goods to apparel and electronics (NPD Group, 2018). In 1994 the private label products’ market share in the grocery industry was at the level of 15% in the United States. At the same time in the United Kingdom private label accounted for 36% of sales value (Hoch, 1996). It was commonly believed that private label market share increases when the economy is in recession and when it picks up consumers return to their preferred national brands (Lamey et al., 2007). But the latest statistics indicate that it is not necessarily true. In 2018 the highest private label market share in Europe was in the UK (52.5%) and Spain (42.6%) (IRI, 2018) while in 2014 market share was 42% and 41% respectively (Nielsen, 2014). In most western countries private label growth in sales value over the last years was higher than the growth of national brands (IRI, 2018).
Such rapid growth in sales value of private label products means that both retailers and consumers get additional value from it. Retailers benefit from offering private label products in
several ways. Offering own store brands allows retailers to have higher profit margins due to overcoming double marginalization (Mills, 1995). Moreover, higher profits can be generated even if private label brands have no cost advantage. Good quality store brands help in building store loyalty and enhance store traffic which leads to higher profits (Corstjens & Lal, 2000). Yet a recent study (Ailawadi et al., 2008) shows that consumers are more likely to be loyal to the private label products in general and not to the particular store’s one. Their finding comes from the observation that heavy private label users spend less in the specific chains than other segments and are more prone to change a store to find better price deals. The other reason for retailers to be interested in growing store brands is that strong private label “improves the position of retailers via a vis national brand manufacturers” which results in higher margins on the national brands (Mills, 1995). Despite all the positive sides of store brands there are examples when chains needed to scale back the share of private label (Ailawadi et al., 2008). The overload of private label is dangerous because predominant presence of private label constrains consumers' choice and decreases the shopping visits and share of wallet of the clients loyal to national brands.
From the consumer’s point of view, there are several factors that have a significant influence on private label purchase intent. Firstly, consumers are more prone to purchase store brands in those categories where they perceive the consequences of making a mistake in choosing the brand lower (Batra & Sinha, 2000). This finding may explain why private label has the highest share in commodity product categories – these categories are perceived as less risky. Secondly, perceived quality of the product has a significant impact on purchase intent (Jaafar, 2018). Thirdly, store image influences the attitude of consumers towards the store brands (Vahie & Paswan, 2006). As consumers associate store brands with the store itself, the higher consumers evaluate the store, the more likely they are to trust private label products (Vahie & Paswan, 2006). Lastly, price plays an important role for the store brands purchase intent, especially for price conscious consumers (Sinha & Batra, 1999). This study focuses on the concept of perceived quality of private label and store loyalty as mediators explaining the likelihood of purchasing private label products and both theoretical constructs are discussed in more detail further in this chapter.
2.3 Impulsive buying
Unplanned or impulsive buying is prevalent consumer behavior and a well-researched topic among academics. The report by Point-of-Purchase Advertising International (POPAI, 2014)
reveals that in mass merchant channel 82% of all the purchase decisions happened in the store while 62% were unplanned or impulse.
Impulsive decision to purchase a product occurs “when an individual makes an unintended, immediate, and unreflective purchase” (Weun et al., 1998). Recent studies found many factors that influence impulsive decision making, such as in-store stimuli: product display (Inman et al., 2009) and special price offers (Bell et al., 2011); consumer characteristics like gender and household size (Inman et al., 2009); or situational characteristics like the number of aisles shopped and shopping time (Stilley et al., 2010). In this study I want to focus on a specific individual characteristics that strongly determines the likelihood of unplanned purchase – impulse buying tendency.
Impulse buying is affiliated with feeling a sudden urge to purchase a certain product (Weun et al., 1998). Such an urge is usually a result of seeing a product in a store and either realizing forgotten needs or unplanned wants (Stilley et al., 2010). In psychology literature of last century impulse behavior was considered immature and irrational (Ainslie, 1975), often researched by criminologists and clinical psychologists (Rook & Fisher, 1995). Yet more recent studies perceive impulsiveness in consumption as “normatively neutral” and acknowledge it’s prevalence in consumer behavior (Rook & Fisher, 1995). From the economic perspective impulsive buying is perceived as an unreflective action that focuses on immediate gratification without reflecting on all the costs (Weun et al., 1998). Indeed research suggests that impulsiveness causes higher spending (Stilley et al., 2010). Another trait of impulsive buying is its immediacy, meaning that consumer does not take time to evaluate different options and find information about the brands (Rook, 1987). Taking this into account, the current study aims to find out how does high vs low impulse buying tendency affect the likelihood to choose a private label product.
Highly impulsive shoppers are more likely not to have a shopping list or to have a list more “open” for unexpected purchases (Rook & Fisher, 1995). Also, impulsive buyers are more likely to be influenced by in-store stimuli and make an impulsive purchase (Bucklin & Lattin, 1991). Based on the above, it is reasonable to assume that consumers with high impulse buying tendency will behave differently when facing the out-of-stock than people with low impulse buying tendency. Hence, in this study impulse buying tendency is studied as a moderator of the relationship between the out-of-stock occurrence and the likelihood of purchasing private label brand.
2.4 Perceived quality
Perceived quality is defined as “the consumer’s judgment about the superiority or excellence of a product” (Zeithaml, 1988). Perceived quality is different than objective quality of the product and is subject to individual impression (Jacoby et al., 1971). The formation of perceived quality in consumer’s mind is a result of evaluation of the bundle of product attributes and comparison with the consumer’s expectations (Snoj et al., 2004). Such attributes, due to cue utilization theory, can be called extrinsic or intrinsic cues. Intrinsic cues are the core product characteristics, such as ingredients, taste, smell, while the extrinsic cues are product related and more easily accessed characteristics, such as price, brand name, packaging (Zeithaml, 1988). The most researched is the effect of price on perceived quality, however, highly inconsistent findings are reported (Zeithaml, 1988). Despite that, many agree that price is indeed used as an indicator of quality if other cues are unavailable or consumer is unable to evaluate them (Zeithaml, 1988). The other cues that have significant impact on quality perception are: brand name, packaging, advertisement (Jacoby et al., 1971) and even product category characteristics (DelVecchio, 2001).
The concept of perceived quality is critically important for private label success. Although many store brands consequentially overcome the objective quality gap (Sinha & Batra, 1999), quality-conscious consumers are still likely to perceive private label to have poorer quality (Ailawadi et al., 2008). This might be caused by the association that consumers see between price and quality (Ailawadi et al., 2008) as mentioned before. On average in Europe the price gap between private label and national brands is about 30% (IRI, 2018). Interestingly, another study (Steenkamp et al., 2010) identifies the reverse causality: the higher is the perceived quality gap the higher is consumer’s willingness to pay a price premium for national brand. Consistent with this reasoning, in present study perceived quality is explored as a mediator influencing the private label purchase likelihood.
2.5 Store loyalty
Foundational research on loyalty explained it from a behavioral perspective – it was defined by purchasing frequency (Newman & Werbel, 1973) or, in a context of store loyalty, as repeat visiting behavior (East et al., 1995). However, broad research on the topic in upcoming years criticized such view and underlined the importance of commitment for store loyalty (Bloemer & de Ruyter, 1998). Repeated visiting behavior might be a result of consumer’s inertia which
consumer is the one who after explicit evaluation made a commitment to prioritize a chosen store for future purchases (Bloemer & de Ruyter, 1998).
Store loyalty is resulting from pleasurable shopping experience, or satisfaction (Bloemer & de Ruyter, 1998). Relevant for current research, a study about consumer dissatisfaction (Koos & Shaikh, 2019) shows that stock-outs are the cause of consumer’s dissatisfaction and the level of dissatisfaction increases with each stock-out experience, what can lead to decrease in store loyalty. Other factors determining store loyalty are the trust to the store and the quality of interpersonal relationship during the shopping experience (Macintosh & Lockshin, 1997). Particularly, retail relationships with the salesperson have a significant effect on store attitude, purchase intent and as a result – store loyalty (Macintosh & Lockshin, 1997).
In current study store loyalty is proposed as a mediator because it is expected that loyal consumers are more likely to choose the store label product in a situation of stock-out of a national brand. This assumption is in line with previous research (Campo et al., 2000; Van Woensel et al., 2007) which demonstrates that loyal consumers are more likely to substitute and less likely to change the store if encountering out-of-stock.
2.6 Hypotheses and Conceptual Framework
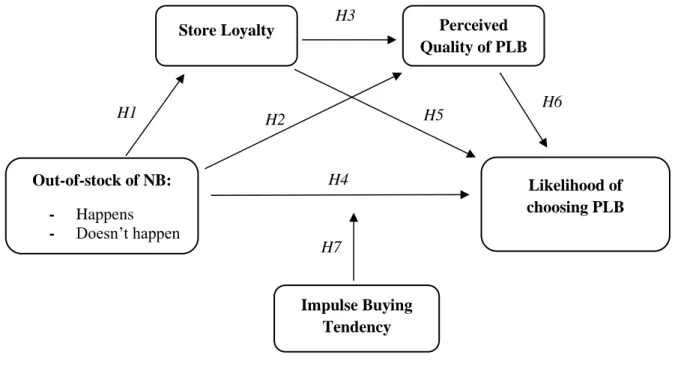
In order to answer the research questions and based on the literature review presented above the conceptual framework (Figure 1) and several hypotheses were constructed. It was conceptualized that there is a distant relationship between out-of-stock of national brand (NB) and the likelihood of purchasing the private label brand (PLB) and this relationship is mediated by loyalty to the store and perceived quality of private label brand in a sequence. Moreover, it is expected that consumer impulse buying tendency alters the strength of the relationship between out-of-stock presence and the likelihood of purchasing the private label.
Research hypotheses:
H1: The out-of-stock of national brand product negatively impacts the store loyalty.
H2: The out-of-stock of national brand product positively affects the perceived quality of
private label brand.
H4: The likelihood of purchasing private label brand increases if consumers encounter
out-of-stock of a national brand product.
H5: Store loyalty positively affects the likelihood of purchasing private label brand.
H6: The perceived quality of private label brand has strong positive effect on the likelihood of
purchasing the private label brand.
H7: The impulse buying tendency moderates the relationship between the out-of-stock of
national brand product and the likelihood of purchasing private label brand
Figure 1: Conceptual Framework
Out-of-stock of NB: - Happens - Doesn’t happen Likelihood of choosing PLB H3 H1
Store Loyalty Perceived Quality of PLB H6 H2 H5 H4 H7 Impulse Buying Tendency
CHAPTER 3: METHODOLOGY
The following chapter explains the methodology used to conduct the research, the data collection approach and the variables used. In the end the stimuli development and research design are clarified in detail.
3.1 Research Approach
In order to achieve the purpose of the study primary and secondary data was used. Secondary data was obtained through the detailed review of the literature on the topic, mainly the academic articles and market research reports. It allowed for creation of conceptual framework and served as a source for theoretical constructs used for the questionnaire.
In pursuance of primary data both qualitative and quantitative research was conducted. At the first stage qualitative research was done to evaluate what shelf layout (stimuli) should be used for the later research. First of all, the stimuli was developed as explained in the ensuing part of this chapter and later eight individuals from 4 different countries were interviewed and based on their answers the most appropriate shelf layout was chosen.
Next the quantitative investigation was done. The online survey was created on the Qualtrix platform. The pilot study was run (14 answers) with the main aim to check whether the manipulation of stimuli is successful. Lastly, the final online survey was distributed through the internet to collect data. Thus, the data used for the analysis to answer the research questions was only quantitative data. Subsequently, data analysis was performed using the statistical software IBM SPSS.
3.2 Primary Data
3.2.1 Data Collection
Data collection via the survey took place between the 17th and 25th of April 2020. The anonymous link to the survey was distributed through the platforms for research participants (pollpool.com, surveycircle.com) and through a social media platform Facebook. The sampling method selected for this study was non-probabilistic convenience sampling. Such method has a limitation – the sample does not represent well the population. Despite such disadvantage, this method was the most appropriate for the current study because of its affordability and simplicity (Etikan, 2016).
The research target population was selected to be in majority from 4 countries: Portugal, Poland, Greece, and the United Kingdom. In these countries the level of adoption of Private Label is as
following: in the United Kingdom the market share of PL products is 41%, in Portugal – 33%, in Poland – 24%, in Greece it is the lowest – 16% (IRI, 2018). Such widespread target population ensured that the results are not biased towards one country. Also, the population of interest was individuals who have at least once purchased or consumed the potato chips (researched category), hence the first 2 questions of the survey checked for such information. The respondents who were non-eligible by this criteria were later excluded. Lastly, there was no restriction on the age of participants and the participants were ranged from under 18 to 64.
3.2.2 Stimuli Development
In order to study the effects of stock-out on the likelihood of purchasing private label, stimuli needed to be created. Since one of the mediators was “store loyalty” it was important to re-create the product shelf of one of the existing and preferably well-known supermarkets. Having in mind that the population of research participants would have been mostly from 4 countries mentioned above, the research among the supermarket chains was conducted. The only chain that is present in all 4 countries nationwide and has a significant market share is LIDL (the lowest market share among these countries is in the United Kingdom – 5.9%).
As a category for the research, the potato chips were chosen. Potato chips represent the biggest share of the “Ambient products” macro category, the macro category that has high private label market share (35%) but also strong national brand presence (IRI, 2018). Specifically, LIDL has a private label in this category – a brand called “Snack Day”.
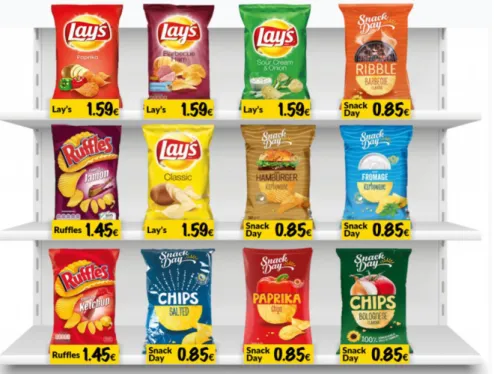
Subsequently, based on the photos collected from the LIDL store shelves from three countries, several options of the shelf layout were created to represent as realistically as possible the shelf in a selected chain. For simplification 3 brands were chosen (Lay’s, Ruffles, and Snack Day) – an accurate representation of brand split in the category in the Portuguese market (specifically Lisbon).
Next, eight semi-structured individual interviews were conducted to choose the most appealing shelf layout. Interviewees were presented with 2 or 3 alternatives for each characteristic to evaluate. First of all, interviewees were presented with 9-items and 12-items product shelves and were asked to evaluate how well does this fictitious shelf represent a real shelf from LIDL on a scale from 1 to 7. On average the 9-items shelf was evaluated with 3.5 points and the 12-items shelf was evaluated with 6.1 points. Therefore, the 12-item shelf was chosen. Following the same logic interviewees were asked to evaluate how should the out-of-stock condition be
shown (with the product being absent or greyed out, like in an online shop) and how many objects should be missing (one or two). In an open question, all 8 participants answered that price is one of three main factors that influence their decision, hence it was decided to include the product price. Prices chosen reflect the real prices in Lisbon LIDL supermarkets (price with no promotion). To summarize, Figures 2 and 3 represent the final shelf layout.
Figure 2: Stimuli for non-out-of-stock condition
3.2.3 Measurement
Based on the extensive literature review, a set of most adequate measures was selected. For the dependent variable, a concept of purchase probability was chosen. A study of Juster (1966) reveals that survey question about purchase probability is more efficient predictor of actual purchase behavior than a survey of purchase intention. Therefore, in current research, the respondents were asked to rate the likelihood of purchase of each of available brands on a scale from 1 to 7 (1 – “Definitely will not buy”, 7 – “Definitely will buy”). The scale was adapted from the original scale from 0 to 10.
To measure the shopping impulsiveness the construct of impulse buying tendency was used. The measurement was developed by Weun, Jones, and Beatty (1998) and later applied by Mohan and colleagues (2013). Participants were asked 5 questions to reflect on personal shopping behavior and answer using a seven-point Likert scale (1 = Strongly disagree, 7 = Strongly agree).
To measure the store loyalty of the respondents and the perceived quality of private label brand constructs created by Rani & Velayudhan (2008) and Weun and colleagues (1998) respectively were used. In both cases, the answers were measured using a seven-point Likert scale (1 = Strongly disagree, 7 = Strongly agree).
3.2.4 Survey Research Design
Posttest only control group design was implemented for this study. Participants were randomly assigned to one of the stimuli conditions (explained in previous section) and next the outcome of stimuli manipulation was measured (Gribbons Joan Herman, 1996).
The survey included 25 questions that were written in English (Attachment 1). The first section included questions about familiarity with supermarket chain LIDL and product category (potato chips). Next, the questions about impulse buying tendency were asked. The following block included a presentation of stimuli and evaluation of the likelihood of purchasing each of the brands. Subsequently, the blocks of questions regarding consumer store loyalty and perceived quality of private label brand were asked in a randomized manner. The study has finished with the manipulation check question and demographic questions.
3.3 Data Analysis
Collected data was analyzed using the statistical software SPSS. In the beginning, data preparation process was done, including data cleansing, transforming variables, reliability analysis, and manipulation check following the steps suggested by Pallant (2007). As the next step, the descriptive statistics were obtained. Lastly, research hypotheses were testes.
To test the hypotheses set in this study the PROCESS macro for SPSS created by Andrew F. Hayes was used (Hayes & Preacher, 2014). For all the tests a 95% confidence level was applied. The selected analysis model involved two mediators in a series and a moderator (model 89). The serial mediation in this model would imply causality effect (Baron & Kenny, 1986) given that serial mediation is statistically significant.
For additional analysis another model from PROCESS macro was used – model 84. This model allowed for analyzing moderation effect on different paths between variables than model 89. Hence, this additional analysis allowed to have more profound managerial implications, presented in Chapter 5.
CHAPTER 4: RESULTS AND DISCUSSION
The following chapter aims to review the results of quantitative analysis. In the first section, the overall sample characterization and necessary preliminary analysis is presented. The second section demonstrates the hypotheses testing. The two following sections describe the additional analysis and discuss the results of all conducted analysis.
4.1 Descriptive Statistics
4.1.1 Sample Characterization
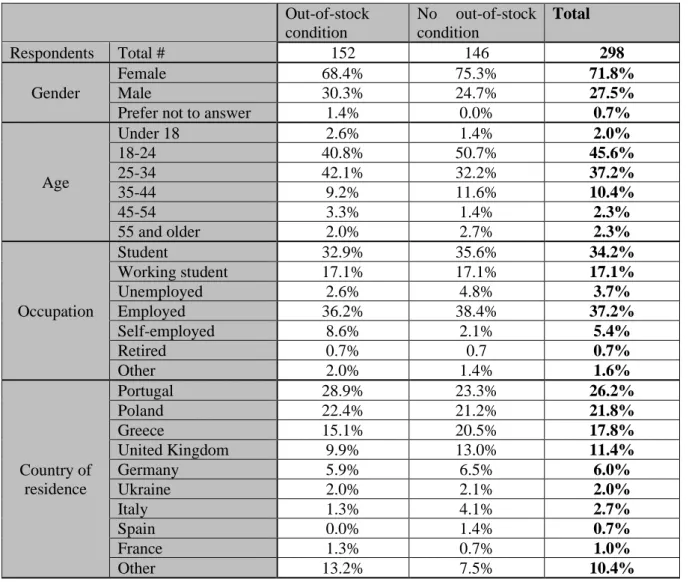
In total, 322 responses to the online survey were collected. 3 cases were excluded because the respondents answered that they have never purchased nor consumer potato chips. Another 21 answers were excluded for the reason that respondents did not answer two or more questions in at least one construct. Thus, 298 valid responses (with no missing cases in key constructs) were analyzed. Out-of-stock condition No out-of-stock condition Total Respondents Total # 152 146 298 Gender Female 68.4% 75.3% 71.8% Male 30.3% 24.7% 27.5%
Prefer not to answer 1.4% 0.0% 0.7%
Age Under 18 2.6% 1.4% 2.0% 18-24 40.8% 50.7% 45.6% 25-34 42.1% 32.2% 37.2% 35-44 9.2% 11.6% 10.4% 45-54 3.3% 1.4% 2.3% 55 and older 2.0% 2.7% 2.3% Occupation Student 32.9% 35.6% 34.2% Working student 17.1% 17.1% 17.1% Unemployed 2.6% 4.8% 3.7% Employed 36.2% 38.4% 37.2% Self-employed 8.6% 2.1% 5.4% Retired 0.7% 0.7 0.7% Other 2.0% 1.4% 1.6% Country of residence Portugal 28.9% 23.3% 26.2% Poland 22.4% 21.2% 21.8% Greece 15.1% 20.5% 17.8% United Kingdom 9.9% 13.0% 11.4% Germany 5.9% 6.5% 6.0% Ukraine 2.0% 2.1% 2.0% Italy 1.3% 4.1% 2.7% Spain 0.0% 1.4% 0.7% France 1.3% 0.7% 1.0% Other 13.2% 7.5% 10.4%
The key demographic characteristics of the sample are presented in the table above (Table 1), split by random assignment to one of the stimuli conditions (of-stock condition or no out-of-stock condition).
As planned initially, the majority of respondents (77.2%) are from four countries – Portugal, Poland, Greece, and the United Kingdom. Approximately an equal number of respondents were assigned to each stimuli condition and there are no major demographic differences between both groups. Since the non-probability sampling method was adopted, the sample does not accurately represent the population. This issue is addressed in the Limitations section.
4.1.2 Normality Tests
Because most of the data collected in this study is nominal or ordinal it is reasonable to assume that some variables of interest might have non-parametric distribution (Pallant, 2007). The normality tests were made using the Shapiro-Wilk test of normality of residuals. Appendix 2 presents the results of the tests on each of the used variables. Among all the variables of interest, only one is normally distributed – the impulse buying tendency (Shapiro-Wilk significance is 0.277) while all the other variables have the test significance at 0.000. This causes that for some tests the non-parametric statistics must be used. Two necessary assumptions for non-parametric techniques were met: the samples are random and the observations are independent (Pallant, 2007).
4.1.3 Manipulation Check
To check how did the participants perceive the independent variable, the manipulation check was run. In the survey participants were asked to rate on a 7-point Likert scale how much they agree with the statement “This shelf has empty spaces due to sell-out of certain products”. Because the dependent variable is not normally distributed, the Mann–Whitney U test was performed. The results show that there is a significant difference between the group that encountered the out-of-stock condition (M=5.25, SD=1.39) and the group that encountered non-out-of-stock condition (M=3.43, SD=1.70) with the significant results of statistics test (U=4682.500, p=0.000). Thus, the results suggest that the manipulation check was successful.
4.1.4 Reliability Analysis
All the constructs used for the study were taken from the previous academic studies, as mentioned in the previous chapter. Nevertheless, the reliability analysis was conducted (Pallant,
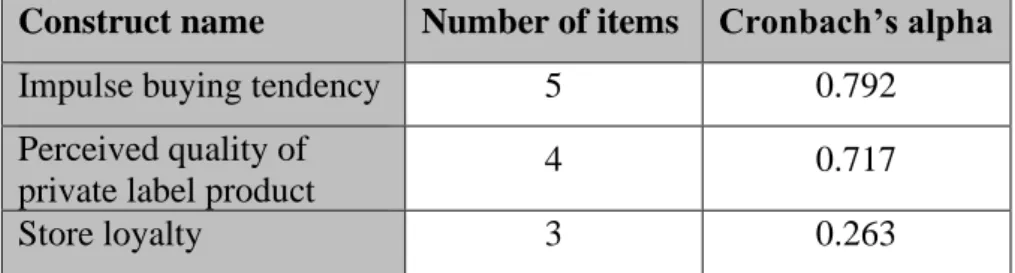
2007). In two constructs the coefficient Alpha was greater than 0.7 (Table 2), which implies good internal consistency. However, in the construct of store loyalty, the Cronbach’s alpha value was not satisfying. The construct was previously used in the study of Rani and Velayudhan (2008) and showed the value of alpha of 0.95, as well as in the study of Campo and colleagues (2000) with alpha of 0.68. In our study alpha is not sufficient – 0.263, meaning a lack of internal consistency between the items. Because the construct of store loyalty was critical for the conceptual framework, the decision was made to consider only one item for evaluation of store loyalty, keeping in mind the limitation of such solution. Specifically, the evaluation of the statement: “I think of myself as a loyal customer of LIDL” on a 7-point Likert scale.
Construct name Number of items Cronbach’s alpha
Impulse buying tendency 5 0.792
Perceived quality of
private label product 4 0.717
Store loyalty 3 0.263
Table 2: Reliability analysis results
4.2 Hypotheses Testing
Before running hypotheses tests, the data should have been checked for outliers and validity of the assumptions important for statistical tests. Firstly, to check for outliers in a dataset a Mahalanobis Distance test was applied, the test suggested for multivariate analysis (Penny, 1996). Its result showed that the sample does not have outliers and hence we could proceed with further analysis without any additional data manipulations.
Next, the assumptions for running linear regression were checked, to ensure that PROCESS macro models can be run. One of the assumptions that must be fulfilled is independence or lack of autocorrelation. Given that the data was collected at one point in time from a random set of individuals, it is reasonable to assume that variables are independent. Test for multicollinearity showed that all independent variables have the VIF value higher than 1 and lower than 10, hence the assumption is met (Appendix 3). Next, the assumptions of the linearity between variables (Appendix 4) and homoscedasticity (Appendix 5) were verified for all the variables of interest.
The last assumption necessary to run linear regression is normality. Despite the fact that some variables are not normally distributed, we apply regression analysis using PROCESS macro for SPSS, because there is no suitable alternative for non-parametric data. Violation of the normality assumption for linear regression is thus one of the limitations of the study.
4.2.1 H1 – The out-of-stock of national brand product negatively impacts the store loyalty.
To test hypotheses H1 to H6 serial mediation model (Model 6) was performed using PROCESS macro for SPSS (Appendix 6). Specifically to test H1 simple linear regression was used – the first step at serial mediation. The independent variable – out-of-stock of national brand (OOS) is binary and the dependent variable – store loyalty, is ordinal. The model, presented by regression formula below, explains 0.09% of variance. The value for 𝛽0 (constant) is equal to
3.431 and is significant (p<0.001).
𝑆𝑡𝑜𝑟𝑒 𝑙𝑜𝑦𝑎𝑙𝑡𝑦 = 𝛽0+ 𝛽1 𝑂𝑂𝑆 + 𝜀
The independent variable – out-of-stock of NB (OOS) does not have significant effect on the likelihood of purchasing PLB (p=0.099). The null hypothesis: “The out-of-stock of national brand product does not have an effect on the store loyalty” cannot be rejected. Thus Hypothesis
H1 is not validated.
Figure 4: Results of linear regression for Hypothesis H1 4.2.2 Hypotheses H2 and H3
To test hypotheses H2 and H3 multiple regression analysis was conducted as a part of serial mediation (Model 6) run by PROCESS Macro (Appendix 6). In this regression perceived quality of private label brand was a dependent variable and it is a scale variable. The model, presented by regression formula below, explains 3.5% of variance. The value for 𝛽0 (constant)
is equal to 3.742 and is significant (p<0.001).
𝑃𝑒𝑟𝑐𝑒𝑖𝑣𝑒𝑑 𝑄𝑢𝑎𝑙𝑖𝑡𝑦 𝑜𝑓 𝑃𝐿𝐵 = 𝛽0+ 𝛽1 𝑂𝑂𝑆 + 𝛽2 𝑆𝐿 + 𝜀 Out-of-stock of NB Store Loyalty 𝛽1 = - 0.353 *p<0.05; **p<0.01; ***p<0.001 Sign No sign
H2 – The out-of-stock of national brand product positively affects the perceived quality of private label brand.
In the test for the hypothesis H2 the independent variable is out-of-stock of NB and the dependent variable is perceived quality of PLB.
When controlling for store loyalty, the out-of-stock of NB (OOS) does not have significant effect on perceived quality (p=0.391). The null hypothesis: “The out-of-stock of national brand product does not have an effect on perceived quality” cannot be rejected. Thus Hypothesis H2
is not validated.
Figure 5: Results of linear regression for Hypothesis H2
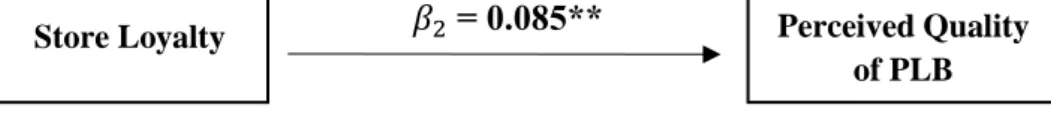
H3 – Store loyalty positively affects the perceived quality of private label brand.
In the test for the hypothesis H3 the independent variable is store loyalty (SL) and the dependent variable is perceived quality of PLB.
When controlling for out-of-stock of NB, store loyalty has significant effect on the perceived quality of PLB (F(2;295)=5.271, p=0.003). The 𝛽2 = 0.085, which means that on average one unit increase in store loyalty increases the perceived quality of PLB by 0.085.
The null hypothesis: “Store loyalty does not have an effect on the perceived quality of private label brand” can be rejected. Thus Hypothesis H3 is validated.
Figure 6: Results of linear regression for Hypothesis H3
Out-of-stock of NB Perceived Quality of PLB 𝛽1 = - 0.089 *p<0.05; **p<0.01; ***p<0.001 Sign No sign
Store Loyalty Perceived Quality of PLB
𝛽2 = 0.085**
*p<0.05; **p<0.01; ***p<0.001 Sign No sign
4.2.3 Hypotheses H4, H5 and H6
To test hypotheses H4, H5 and H6 multiple regression analysis was conducted as a part of serial mediation (Model 6) run by PROCESS Macro (Appendix 6). The model, presented by regression formula below, explains 13.3% of variance. In this regression the dependent variable – likelihood of purchasing private label brand, is ordinal. The value for 𝛽0 (constant) is equal
to 0.279 and is not significant.
𝐿𝑖𝑘𝑙𝑖ℎ𝑜𝑜𝑑 𝑜𝑓 𝑝𝑢𝑟𝑐ℎ𝑎𝑠𝑖𝑛𝑔 𝑃𝐿𝐵 = 𝛽0+ 𝛽1 𝑂𝑂𝑆 + 𝛽2 𝑆𝐿 + 𝛽3 𝑃𝑄_𝑃𝐿𝐵 + 𝜀
H4 – The likelihood of purchasing private label brand increases if consumers encounters out-of-stock of a national brand product.
In the test for the hypothesis H4 the independent variable is out-of-stock of NB and the dependent variable is the likelihood of purchasing private label brand.
When controlling for other variables (store loyalty and perceived quality of PLB) the independent variable does not have significant effect on the likelihood of purchasing PLB (p=0.159). The null hypothesis: “The out-of-stock of national brand product does not have an effect on the likelihood of purchasing private label brand” cannot be rejected. Thus Hypothesis
H4 is not validated.
Figure 7: Results of linear regression for Hypothesis H4
H5 – Store loyalty positively affects the likelihood of purchasing private label brand.
In the test for the hypothesis H5 the independent variable is store loyalty (SL) and the dependent variable is the likelihood of purchasing private label brand.
When controlling for other variables (out-of-stock of national brand and perceived quality of PLB) store loyalty does not have significant effect on the likelihood of purchasing PLB
Out-of-stock of NB Likelihood of purchasing PLB 𝛽1 = 0.301 *p<0.05; **p<0.01; ***p<0.001 Sign No sign
(p=0.281). The null hypothesis: “Store loyalty does not have an effect on the likelihood of purchasing private label brand” cannot be rejected. Thus Hypothesis H5 is not validated.
Figure 8: Results of linear regression for Hypothesis H5
H6 – The perceived quality of private label brand has strong positive effect on the likelihood of purchasing the private label brand.
In the test for the hypothesis H6 the independent variable is perceived quality of PLB (PQ_PLB) and the dependent variable is the likelihood of purchasing PLB.
When controlling for other variables (out-of-stock of national brand and store loyalty) perceived quality of PLB has significant effect on the likelihood of purchasing PLB (F(3;294)=15.003, p<0.001). The 𝛽3 = 0.753, which means that on average one unit increase in
perceived quality of PLB increases the likelihood of purchasing PLB by 0.753.
The null hypothesis: “Perceived quality of private label brand does not have an effect on the likelihood of purchasing private label brand” can be rejected. Thus Hypothesis H6 validated.
Figure 9: Results of linear regression for Hypothesis H6
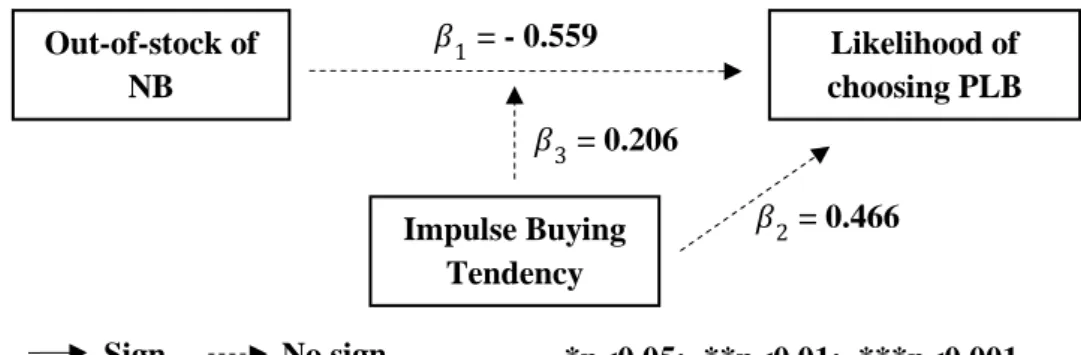
4.2.4 H7 – The impulse buying tendency moderates the relationship between the out-of-stock of national brand product and the likelihood of purchasing private label brand
To test hypotheses H7 moderated serial mediation model (Model 89) was performed using PROCESS macro for SPSS (Appendix 7). The coefficient for the variables in serial mediation
Store Loyalty Likelihood of purchasing PLB 𝛽2 = 0.063 *p<0.05; **p<0.01; ***p<0.001 Sign No sign Perceived Quality of PLB Likelihood of purchasing PLB 𝛽3 = 0.753*** *p<0.05; **p<0.01; ***p<0.001 Sign No sign
were very close to the ones obtained by a serial mediation (Model 6) explained earlier. The entire model, explains 18.6% of variance. To test the hypothesis 7 we take a look at a moderation effect of impulse buying tendency (IBT) on the relationship out-of-stock of NB and likelihood of purchasing PLB. The regression formula for moderation is as follows:
𝐿𝑖𝑘𝑙𝑖ℎ𝑜𝑜𝑑 𝑜𝑓 𝑝𝑢𝑟𝑐ℎ𝑎𝑠𝑖𝑛𝑔 𝑃𝐿𝐵 = 𝛽0+ 𝛽1 𝑂𝑂𝑆 + 𝛽2 𝐼𝐵𝑇 + 𝛽3 𝑂𝑂𝑆 ∗ 𝐼𝐵𝑇 + 𝜀
The null hypothesis: “The impulse buying tendency does not have significant moderation effect on the relationship between the out-of-stock of national brand product and the likelihood of purchasing private label brand” cannot be rejected. Thus Hypothesis H7 is not validated.
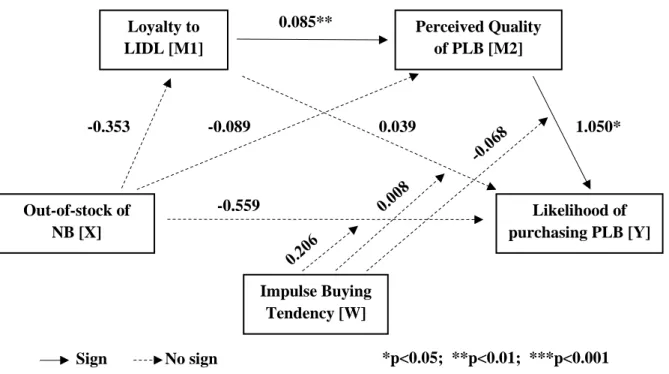
Figure 10: Results of linear regression for Hypothesis H7 4.2.5 Complete model
To summarize, the statistical model as a whole is not significant (Appendix 7), because the serial mediation is not significant. The independent variable does not have significant influence on neither of two mediators or dependent variable. Moderation effect is also not significant on any path between variables. Figure 11 represents the conceptual diagram of the model and coefficients. Out-of-stock of NB Likelihood of choosing PLB 𝛽1 = - 0.559 Impulse Buying Tendency 𝛽3 = 0.206 *p<0.05; **p<0.01; ***p<0.001 Sign No sign 𝛽2 = 0.466
Figure 11: Model 89 moderated serial mediation
From the seven hypotheses set in this study, only two are validated. Table 3 presents an overview of hypotheses testing results.
Hypothesis Description Outcome
H1 The out-of-stock of national brand product negatively impacts
the store loyalty. Not validated
H2 The out-of-stock of national brand product positively affects the
perceived quality of private label brand. Not validated
H3 Store loyalty store positively affects the perceived quality of
private label brand. Validated
H4 The likelihood of purchasing private label brand increases if
consumers encounters out-of-stock of a national brand product. Not validated
H5 Store loyalty positively affects the likelihood of purchasing
private label brand. Not validated
H6 The perceived quality of private label brand has strong positive
effect on the likelihood of purchasing the private label brand. Validated
H7 The impulse buying tendency moderates the relationship between the out-of-stock of national brand product and the
likelihood of purchasing private label brand
Not validated
Table 3: Results of the hypotheses testing
Out-of-stock of NB [X] Likelihood of purchasing PLB [Y] Loyalty to LIDL [M1] Perceived Quality of PLB [M2] Impulse Buying Tendency [W] 1.050* 0.085** -0.559 -0.353 -0.089 0.039 Sign No sign *p<0.05; **p<0.01; ***p<0.001
4.3 Additional Analysis
4.3.1 Moderation effect of private label brand familiarity
The initial conceptual framework proved to be insignificant, which suggested that some elements in serial mediation might be missing. Considering that the distribution of variables store loyalty and perceived quality are positively skewed, emerged the idea that brand familiarity might influence the serial mediation. Private label brand familiarity was expressed by self-reported measure on a 7-point Likert scale (1 = Not familiar at all, 7 = Extremely familiar). 64% of respondents answered that they are not familiar at all with the brand “Snack Day”.
Brand familiarity is a result of accumulated brand-related experiences that consumers embraced (Ha & Perks, 2005). It can be acquired both by personal consumption experience, marketing communication, or word of mouth (Dursun et al., 2011). Numerous studies found a significant effect of brand familiarity on perceived quality and direct or indirect (through perceived quality as mediator) effect on purchase intention (Dursun et al., 2011; Ha & Perks, 2005; Sheau-Fen et al., 2012).
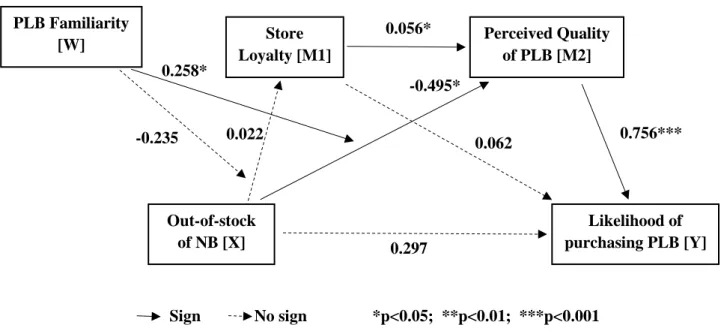
To test for hypotheses the regression analysis was run using the SPSS PROCESS tool by Andrew Hayes, model 84 (Appendix 8). The model fits data well with R-value of 0.365. The graphic representation of the whole model and the results of each regression are presented in Figure 12.
As expected, when moderated by PLB familiarity, out-of-stock of NB has a negative effect on perceived quality of PLB (𝛽=−0.495, p=0.014). Importantly, there is also a significant positive moderating effect of PLB familiarity on perceived quality of PLB in reaction to out-of-stock of NB (𝛽=0.258, p=0.021). This brings a reasonable explanation to the results of the previous model (without PLB familiarity) – for the consumers who are not familiar with PLB (a majority of respondents) the out-of-stock of NB does not influence the perceived quality of PLB. However, identically as in the previous model, independent variable does not significantly affect store loyalty. PLB familiarity also does not have a significant moderating effect.
Perceived quality of PLB has a strong and significant effect on the likelihood of purchasing PLB, as in the previous model. This concludes that serial mediation is again not significant, however, the moderated mediation model (X affecting Y through M2, where X to M2 path is
independent variable on the dependent variable, because the direct effect of X on Y is not significant.
Figure 12: Model 84 that includes Moderation effect of PLB familiarity 4.3.2 Direct effects of impulse buying tendency
The second research question was focused on the effect of impulse buying tendency (IBT) on the likelihood of purchasing PLB. However, as became evident from model 89, it is not a significant moderator of the relation between the out-of-stock of NB and the likelihood of purchasing PLB. Hence, it was decided to check if the impulse buying tendency has any effect on purchase likelihood in the potato chips category, both on PLB and NB, disregarding the out-of-stock condition.
The simple regression analysis was run three times for each of the brands in the study – private label brand “Snack Day” and two national brands: “Lay’s” and “Ruffles”. The null hypothesis for each regression was as following: “The impulse buying tendency does not have an effect on the likelihood of purchasing brand A”, where “A” meant each brand respectively. The results of statistical tests are presented in Appendix 9.
First regression analysis results (Figure 13) indicate that IBT has a significant effect (p<0.001) on the likelihood of purchasing the private label brand.
Sign No sign Out-of-stock of NB [X] Likelihood of purchasing PLB [Y] Store Loyalty [M1] Perceived Quality of PLB [M2] PLB Familiarity [W] 0.756*** 0.297 *p<0.05; **p<0.01; ***p<0.001 0.062 0.258* -0.235 0.056* -0.495* 0.022
Figure 13: Effect of IBT on the likelihood of purchasing PLB
If it comes to the national brand “Lay’s”, there is also an evidence of significant effect (p<0.001) of IBT on the likelihood of purchase (Figure 14).
Figure 14: Effect of IBT on the likelihood of purchasing NB “Lay’s”
Lastly, only in the case of the national brand “Ruffles” there is no evidence of significant effect (p=0.090) (Figure 15).
Figure 15: Effect of IBT on the likelihood of purchasing NB “Ruffles”
To summarize, the impulse buying tendency influence the likelihood of purchasing some brands in the potato chips category, however, it is not a significant factor influencing consumer behavior in a situation of out-of-stock.
4.4 Discussion
The cornerstone of the current research was the relationship between the out-of-stock of national brand product and the purchase likelihood of private label brand. Hence, the study focused only on one particular customer response to the out-of-stock issue – substitution with
Impulse Buying Tendency Likelihood of purchasing PLB 𝛽1 = 0.345*** *p<0.05; **p<0.01; ***p<0.001 Sign No sign Impulse Buying Tendency Likelihood of purchasing NB “Lay’s” 𝛽1 = 0.403*** *p<0.05; **p<0.01; ***p<0.001 Sign No sign Impulse Buying Tendency Likelihood of purchasing NB “Ruffles” 𝛽1 = 0.135 *p<0.05; **p<0.01; ***p<0.001 Sign No sign
private label. Under different conditions, previous research evidence demonstrates different effects of out-of-stock on consumer behavior and specifically on substitution patterns. Our findings show that out-of-stock does not have a direct effect on the likelihood of purchasing PLB.
Despite what is suggested by literature (Fitzsimons, 2000; Ranjan & Puri, 2012; Sloot et al., 2005), our findings deviate from theoretical assumptions and indicate that occurrence of out-of-stock of national brand does not have a significant effect on the store loyalty. It can be explained by the idea that rather a repetitive out-of-stock situation would harm the store loyalty than a one-time situation, like the simulation made in this study. Authors Koos and Shaikh (2019) showed in their research that consumer’s dissatisfaction level increases with each stock-out situation encountered but also gradually decreases over time as a result of forgetting. And consumer dissatisfaction, in turn, negatively effects the store loyalty, which leads to the conclusion that repeated occurrence of out-of-stock will decrease store loyalty.
In this study, we aimed to check the influence of store loyalty on the purchase likelihood of private label brand. Academic research suggests that there exists rather a reverse effect – private label purchasing and satisfaction can affect store loyalty (Ailawadi et al., 2008; Corstjens & Lal, 2000). Hence, a lack of empirical evidence that store loyalty influence purchase likelihood of private label can mean that the future focus of researchers should remain on the reverse relationship.
Empirical studies on the topic of out-of-stock suggest that OOS of one product can lead to higher desirability (Huang & Zhang, 2016) or attractiveness (Fitzsimons, 2000; Ge et al., 2009) of other available product. Based on this, the hypothesis H2 was set – “The out-of-stock of
national brand product positively affects the perceived quality of private label brand”. In the
initial model (serial mediation model) this hypothesis was not validated, as the value was not significantly different from 0. But further analysis (PROCESS model 84) indicates that out-of-stock of national brand leads to significantly lower perceived quality of private label brand. This counterintuitive result might be explained by the moderation effect of product familiarity. The conclusion is following: when encountering out-of-stock of national brand the consumer on average is likely to perceive private label quality lower, than comparing to a situation with no OOS, given that he/she has low familiarity with the private label brand. And the opposite is true – if the consumer is familiar with PLB the total effect of out-of-stock on perceived quality will be positive. This finding is, in fact, in line with the research of Kramer and Carroll (2009)
who found that unavailability of one item in a selection set can significantly increase the purchase likelihood of the target option. If the consumer is not familiar with the private label brand, he/she will likely not plan to buy the unknown product, hence the target option will be a national brand. And, due to the results of the study, the out-of-stock will only increase the purchase likelihood of that national brand. The mentioned study (Kramer & Carroll, 2009) did not mention the perceived quality, but our study identified that perceived quality is a significant mediator in a relation between out-of-stock and purchase likelihood.
Lastly, the hypothesis about the positive effect of perceived quality on the likelihood of purchasing PLB was validated, as expected. Multiple academic papers studied the importance of perceived quality and the conclusion is that perceived quality is a key determinant of perceived value (Snoj et al., 2004) and the perceived value is the basis of customer purchase decision (DelVecchio, 2001; Jacoby et al., 1971).