João Manuel de Oliveira Valente Morais
Licenciatura em Engenharia Electrotécnica e de ComputadoresUnsupervised Classification of Uterine
Contractions Recorded Using
Electrohysterography
Dissertação para obtenção do Grau de Mestre em Engenharia Eletrotécnica e de Computadores
Orientador: Arnaldo Batista, Assistant Professor, Universidade Nova de Lisboa, FCT
Júri
Presidente: Doutor Rodolfo Alexandre Duarte Oliveira - FCT/UNL Arguente: Doutor Raúl Eduardo Capelo Tello Rato - FCT/UNL
Unsupervised Classification of Uterine Contractions Recorded Using Elec-trohysterography
Copyright c João Manuel de Oliveira Valente Morais, Faculdade de Ciências e Tecnologia, Universidade NOVA de Lisboa.
A Faculdade de Ciências e Tecnologia e a Universidade NOVA de Lisboa têm o direito, perpétuo e sem limites geográficos, de arquivar e publicar esta dissertação através de exem-plares impressos reproduzidos em papel ou de forma digital, ou por qualquer outro meio conhecido ou que venha a ser inventado, e de a divulgar através de repositórios científicos e de admitir a sua cópia e distribuição com objetivos educacionais ou de investigação, não comerciais, desde que seja dado crédito ao autor e editor.
Acknowledgements
I thank my thesis advisor Arnaldo Batista for the support and guidance in the course of this project. I’m grateful to Universidade Nova de Lisboa and it’s associates who made part of an impressive experience that opened my horizons to many areas that I learned to love and become curious about.
A very special thanks to Paulo Oliveira for all the wise advice, patience and availability. To my whole family and friends for all the great moments we share together.
To my partner and her parents for their friendship, unfailing support and continuous encouragement.
Lastly, I would like to express my most profound gratitude to my parents, brothers and grandmother for everything they have done for me that I cannot thank enough.
A b s t r a c t
Pregnancy still poses health risks that are not attended to by current clinical practice motorization procedures. Electrohysterography (EHG) record signals are analyzed in the course of this thesis as a contribution and effort to evaluate their suitability for pregnancy monitoring.
The presented work is a contributes with an unsupervised classification solution for uterine contractile segments to FCT’s Uterine Explorer (UEX) project, which explores analysis procedures for EHG records.
In a first part, applied processing procedures are presented and a brief exploration of the best practices for these. The procedures include those to elevate the representation of uterine events relevant characteristics, ease further computation requirements, extraction of contractile segments and spectral estimation.
More detail is put into the study of which characteristics should be chosen to represent uterine events in the classification process and feature selection methods. To such end, it is presented the application of a principal component analysis (PCA) to three sets: interpolated contractile events, contractions power spectral densities, and to a number of computed features that attempt evidencing time, spectral and non-linear characteristics usually used in EHG related studies.
Subsequently, a wrapper model approach is presented as a mean to optimize the feature set through cyclically attempting the removal and re-addition of features based on clustering results. This approach takes advantage of the fact that one class is known beforehand to use its classification accuracy as the criteria that defines whether the modification made to the feature set was ominous.
Furthermore, this work also includes the implementation of a visualization tool that allows inspecting the effect of each processing procedure, the uterine events detected by different methods and clusters they were associated to by the final iteration of the wrapper model.
Keywords: Electrohysterogram (EHG), Electromyogram (EMG), Unsupervised Classifi-cation, Machine Learning, Signal Processing.
R e s u m o
A gravidez ainda comporta riscos para a mulher que não são, actualmente, contemplados pelos processos de monitorização praticados clinicamente. Esta tese analisa sinais de re-gistos obtidos por electrohisterografia, como uma contribuição para a sua viabilidade na monitorização da gravidez.
Este trabalho tem seguimento do projeto Uterine Explorer (UEX) que acumula pro-cessos para análise de registos EHG. O trabalho aqui proposto contribui para o projeto com uma solução para a classificação não supervisionada de contrações uterinas.
Primeiramente, são apresentados os procedimentos aplicados para processamento dos sinais. Estes incluem processos que realçam as características relevantes dos eventos uteri-nos, baixam os requisitos de processamento, extraem os segmentos de contrações uterinas e estimam representações espectrais.
Mais detalhe é dado ao estudo de quais as características usadas para representar os eventos uterinos no processo de classificação e aos processos que analisam estas definir um subconjunto ótimo. Para este fim, é apresentada a aplicação da análise dos compo-nentes principais (PCA) em três conjuntos de características distintos: eventos uterinos que são interpolados para possuírem todos a mesma dimensão, densidade espectral de potência estimada e um conjunto de características computadas que procuram evidenciar características temporais espectrais e de não-linearidade.
Posteriormente, é usada uma abordagem de modelo envolvente de agrupamento para otimização do conjunto de características a usar. Este, consiste na adição e remoção de características ao subconjunto que é usado num processo de agrupamento a cada iteração do modelo, com base nos resultados dos grupos criados. Esta abordagem tira proveito do facto de uma das classes pretendidas ser conhecida, pelo que a precisão na classificação desta é usada como critério para definir o impacto que a adição ou remoção de uma característica tem na solução. Desta forma o modelo envolvente providencia uma solução à classificação dos sinais, mas também otimiza o conjunto de características a usar.
Este trabalho inclui também a implementação de uma ferramenta de visualização que permite inspecionar o efeito dos diferentes processamentos feitos aos sinais, os eventos uterinos extraídos por diferentes métodos e os grupos a que estes ficaram associados na última iteração do modelo envolvente.
Palavras-chave: Electrohisterograma (EHG), Electromiograma (EMG), Classificação não supervisionada, Aprendizágem automática, Processamento de sinais.
C o nt e nt s
List of Figures xiii
List of Tables xvii
Acronyms xix
1 Introduction 1
1.1 Context . . . 1
1.2 Motivation . . . 2
1.3 Objectives and Contributions . . . 3
2 State of the Art 5 2.1 Electrohysterogram. . . 5
2.2 Classification of Electrohysterogram Signals . . . 7
2.3 Uterine Explorer Tool . . . 8
3 EHG Signal Description and Preprocessing 11 3.1 Pregnancy Monitoring and Electrohysterography . . . 11
3.1.1 Used EHG Records. . . 13
3.1.2 Uterine Physiological Events . . . 14
3.2 Signal Preprocessing . . . 15
3.2.1 Decimation . . . 16
3.2.2 Filtering Process . . . 17
3.2.3 Bipolar Signals . . . 19
3.2.4 Extraction of Uterine Events . . . 21
3.2.5 Signal Modeling . . . 25
3.2.6 Spectral Analysis Methodologies . . . 26
3.2.7 Spectral Analysis of Uterine Events . . . 29
4 Dimensionality Reduction 35 4.1 Feature Extraction . . . 35
4.1.1 Introduction . . . 35
4.1.2 Linear Time Domain Features. . . 36
4.1.3 Spectral Features . . . 38
4.1.4 Non-Linear Features . . . 40
4.1.5 General Feature Extraction Methods . . . 41
4.2 Feature Selection . . . 43
C O N T E N T S 4.2.2 Wrapper Approaches . . . 45 4.3 Defined Features . . . 46 4.3.1 Introduction . . . 46 4.3.2 Feature Sets. . . 47 5 Machine Learning 49 5.1 Introduction. . . 49 5.2 Unsupervised Learning . . . 50 5.2.1 Data Clustering. . . 50
5.2.2 Classification Methods used in Related Studies . . . 54
5.3 Validation . . . 55
5.4 Classification Model For EHG Data . . . 55
5.4.1 PCA and K-means Combination . . . 56
5.4.2 Wrapped Clustering Model . . . 57
6 Project Implementation 61 6.1 Introduction. . . 61
6.2 Signal Processing and Classification Program . . . 61
6.2.1 Signal Processing . . . 61
6.2.2 Feature Selection and Classification Procedures . . . 67
6.3 Visualization Tool . . . 71
6.4 Results. . . 74
6.4.1 Principal Component Analysis . . . 75
6.4.2 Wrapped Clustering Algorithm . . . 78
6.4.3 Selected Subset Features. . . 81
7 Conclusions 87 7.1 Future Work . . . 88
Bibliography 91
L i s t o f F i g u r e s
2.1 Detection and classification in uterine EMG. The numbers on top refer to: ’1’ - background activity; ’2’ and ’6’ - contractions; ’4’ and ’7’ - fetus motions; ’5’
- LDBF waves; ’3’ - Alvarez waves. [11] . . . 6
2.2 First illustrated example in the literature of the different uterine events [12] . 7 3.1 Typical example of the 4x4 electrodes matrix and TOCO sensor positioned on the woman’s abdomen [19]. . . 13
3.2 EHG Electrodes Placement [3] . . . 14
3.3 EHG Raw Signal. The amplitude has no meaning as it is relative due to machine gain. . . 16
3.4 Effect of decimation. The plots represent a signal before and after applying the decimation filter, respectively. . . 17
3.5 Effect of applying a pass-band filter with cutoff frequencies in 0.1 and 1Hz. The plots represent the signal before and after applying the filter, respectively. . . 19
3.6 Relation of monopolar to bipolar signals. The top-most and left-most circles represent the calculated bipolar signals, which specify their respective numera-tion and the computed subtracnumera-tion.. . . 20
3.7 Effect of subtracting monopolar signals. The first two graphs represent records from different electrodes, while the third represents the bipolar signal resultant of the subtraction. . . 21
3.8 Detected contractions using Wavelet energy . . . 23
3.9 Detected contractions using Teager-Kaiser energy . . . 24
3.10 Detected contractions using RMS . . . 24
3.11 Detected contractions using RMS squared . . . 24
3.12 Detected contractions using Hilbert-Huang spectrum energy . . . 24
3.13 PSD representation of a contraction by different methods . . . 30
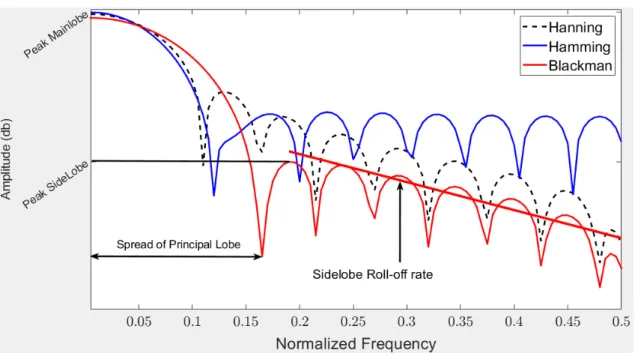
3.14 Frequency Response of Hanning, Hamming and Blackman Windows in decibels 32 3.15 Frequency Response of Hanning, Hamming and Blackman Windows in decibels 32 4.1 Determination of number of sources by eigenvalue ordering [64, pp. 182] . . . 43
4.2 Flow diagram of wrapper approach for unsupervised learning [67, pp. 848] . . 45
5.1 Example of how normalization may reduce cluster separation [69] . . . 51
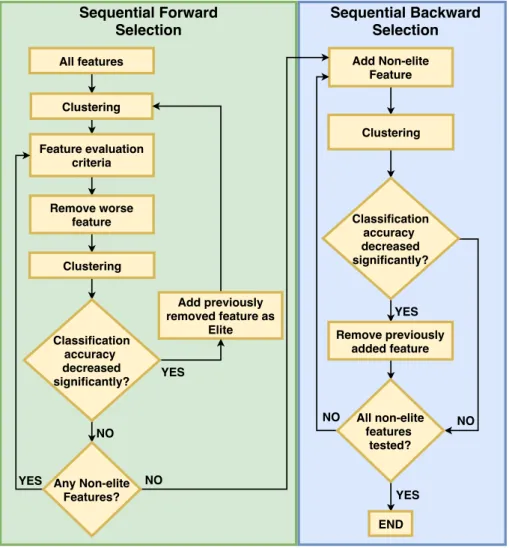
5.2 Developed Wrapper Model for feature selection. Green and blue areas refer to SBS and SFS parts, respectively. The diamond boxes represent conditions, whereas rectangular boxes represent stages or procedures. . . 58
L i s t o f F i g u r e s
6.1 Flow diagram summarizing signal processing procedures. Pink boxes refer to functions external to the developed program, which belong to UEX project scripts. Green boxes refer to the scripts developed that implement the main flow of the program. Scripts names are are shown with a cyan background. The beige boxes represent data. The diagram provides a legend for arrows in the grey box. . . 62
6.2 Example output of script execution. Provides a structure with patient case profile and processed signal. . . 63
6.3 Example output of a1_2_set_Classif_WS.m script execution. Provides a structure with patient case profile and uterine event extracted. . . 64
6.4 Example output of a2_set_Classif_WS.m script execution. Provides a struc-ture with each contraction extracted per row and information of where it was extracted from along with respective patient case profile.. . . 64
6.5 Example output of a3_PWDWS.m script execution. Provides a structure with each contraction’s spectral representations by different methods computed in a UEX function execution.. . . 65
6.6 Example output of a4_FeatCalc.m script execution. Aggregates computed values that attempt to elevate the uterine event’s time, spectral and non-linear characteristics. Each row of computed values is associated to an uterine event. 66
6.7 Flow diagram summarizing the developed procedures for feature selection and uterine events classification. Green boxes refer to the scripts developed that implement the main flow of the program. Script names are shown with a cyan background. The beige boxes represent data. The diagram provides a legend for arrows in the grey box.. . . 67
6.8 Example output of a6_computePCA.m script execution. This output exem-plifies a file generated when applying PCA to the uterine event in the time domain. The first 10 rows provide identification and profile information, and in specific the first row specifies whether the row corresponds to a fetal movement. Column 12 has the contractile events considered in the PCA procedure. These all present the same size because each uterine event was interpolated to be represented in a 512 sample signal. Column 13 shows the resulting transformed and reduced result of PCA execution. According to the evolution of the eigen vector rating, the transformed signals were reduced to only account for 20 samples. The last column shows the cluster assigned to each signal. . . 68
6.9 Output of wrapper model execution with information gathered over each of it’s clustering iterations. . . 69
6.10 Table outputted from Wrapper model execution showing final clustering result of each uterine event.. . . 70
6.11 Preprocessing part of visualization tool. . . 71
L i s t o f F i g u r e s
6.12 Preprocessing part of visualization tool. The drop-down list contains the pre-processing procedures that can be visualized, containing: 1-divide machine gain; 2-remove points from beginning and ending of signal, due to the amount of corrupted signals from moving electrodes when the test is starting and end-ing; 3-compute bipolar signals; 4-Remove signal tilt; 5-center signal to have zero average (this step was omitted from initial preprocessing description as it is not necessary); 6-subtract first value to the whole signal, for it to start at zero; 7-Result of Decimation; 8-Result of filtering to the band of interest. . . 72
6.13 Signal Inspector Menus. . . . 72
6.14 Visualization Tool - Signal Inspector : Here the scope was set to 70 times the signal length (in Signal Indexer menu). in Methods menu three contraction detection methods are chosen, namely, by wavelet energy (red segments), Teager energy operator (black segments) and Hilbert-Huang (yellow segments). As such in the defined scope all contraction detected by these methods will appear with different colors. The small orange segment is the selected one. . . 73
6.15 Spectral representation of the selected contraction segment. Here, only the PSD representations were loaded, and the figure shows it’s estimation according to Welch and autoregressive (AR) estimators. Although many methods of contraction detection are selected, the contraction segments iterated are those with respect to the first oneto be selected (subsequent are selected by holding CTRL key). . . 73
6.16 Cumulative Sum of the power representation. This plot simply integrates the estimated spectral representation to allow a visual inspection of how the energy evolves in the signal. . . 74
6.17 SignalInspector as a way to compare contraction detection methods. The orange signal segment a contraction detected using wavelet energy and the black segment represents a segment detected using Teager energy operator. . 75
6.18 Distribution of the interpolated and transformed time-domain fetal movements and contractions among the clusters. . . 76
6.19 Distribution of the transformed PSD of fetal movements and contractions among the clusters. . . 77
6.20 Distribution of the transformed computed features of fetal movements and contractions among the clusters. . . 77
6.21 Wrapper model applied to synthetic data. Each line represents the percentage of correctly classified signals and the features being added and removed are being represented with a + or −, respectively. . . 79
6.22 Iterations information of wrapper model. Blue line refers to the percentage of fetal movements being correctly classified, while the red line refers to the percentage of contractions being classified as fetal movements. . . 80
6.23 Distribution among clusters of the computed features selected by wrapper model and transformed by PCA algorithm. . . 82
L i s t o f F i g u r e s
6.24 Stacked Graph representing percentage of each clustered class associated to each gestational week. The weeks are not rounded up, meaning a new week only ends at day one of posterior week. Text at the top of each bars indicates number of uterine events (U.E.) and patient cases considered for that week. . 83
6.25 Stacked Graph representing percentage of each clustered class associated to each delivery week. The weeks are not rounded up, meaning a new week only ends at day one of posterior week. Text at the top of each bars indicates number of uterine events (U.E.) and patient cases considered for that week.. . . 84
6.26 Stacked Graph representing number of contractions at each clustered class associated to each gestational week and delivery week. . . 85
L i s t o f Ta b l e s
3.1 Characteristics of commonly used windows [60] . . . 33
4.1 Linear Time-Domain Features. . . 38
4.2 Spectral Representations Considered in EHG Studies and Methods used . . . 38
4.3 Non-Linear Time-Domain Features . . . 39
4.4 Non-Linear Time-Domain Features . . . 41
5.1 General Minkowski Metric Derivations . . . 51
Ac r o ny m s
ADASYN Adaptive Synthetic Sampling. AP Action Potentials.
AR Autoregressive.
BPSO Binary Particle Swarm Optimization.
DFT Discrete Fourier Transform.
ECG Electrocardiography. EEG Electroencephalography. EHG Electrohysterography.
EMD Empirical Mode Decomposition. EMG Electromyography.
FCBF Fast Correlated Based Filter. FFT Fast-Fourier Transform. FIR Finite Impulse Response. FNN False Nearest Neighbor. FT Fourier Transform.
GS Gramschmidt.
HHT Hilbert Huang Transform.
IAP Intracell Action Potentials. ICA Intrinsic Component Analysis. IIR Infinite Impulse Response. IMF Intrinsic Mode Functions. IUPD Intrauterine Pressure Catheter.
LAHF Low Amplitude High Frequency. LDA Linear Discriminant Analysis.
AC RO N Y M S
LDAf Linear discriminant analysis using forward search. LDAi Linear discriminant analysis using independent search. LDB Local Discriminate Basis.
LDBF Long Duration Low Frequency. LS Linear Spectrum.
LSD Linear Spectral Density.
ML Maximum Likelihood.
PCA Principal Component Analysis. PS Power Spectrum.
PSD Power Spectral Density.
RMS Root Mean Square.
SBFS Sequential Backward Feature Selection. SBS Sequential Backward Search.
SFFS Sequential Forward Feature Selection. SFS Sequential Forward Search.
SMOTE Synthetic Minority Over-sampling Technique. SSE Sum-of-squared-error.
STFT Short-time Fourier Transform.
TF Time-Frequency.
TFD Time-Frequency Distributions. TOCO tocodynamometry.
uEMG Uterine Electromyography.
WGN White Gaussian Noise.
WPD Wavelet Packet Decomposition. WT Wavelet Transform.
WVD Wigner-Ville Distribution.
C h a p t e r
1
I nt r o d u c t i o n
1.1
Context
Pregnancy holds many dangers both to the mother and fetus, being its monitoring a highly important prevention to diagnose any issues timely and take more successful interventions. Pregnancy monitoring covers a number of methods used to identify issues related the patient and fetus well-being.
More specifically, this thesis is concerned about assessment of uterine contractions as a way of pregnancy monitoring. The most widely used technique to assess contractions is the external tocodynamometry (TOCO). This is a harmless technique, which performs a mechanical measurement of the contractions based on pressure. It provides accurate information about the frequency and duration of contractions, but not their amplitude [1].
A more recently available method for uterine contractile activity assessment is electro-hysterography (EHG). This is a noninvasive technique that measures action potentials in the uterine muscles through electrodes placed on the patients abdomen. EHG intent is to record the the coordinated adhesion of myometrial cells to propagating electrical action potentials, which forms the uterine contractile activity [1]. In an article by W. Cohen [1] it is claimed EHG is at least as reliable as TOCO.
While not yet well recognized and practiced, EHG is increasingly attaining better results on providing insightful information of uterine activity, which mat lead it to become a candidate for use in diagnosing pregnancy complications, such as to predict preterm labor or identifying fetal distress.
Detection of preterm labor is one of the major topics of studies regarding EHG records. Preterm labor is defined to be when it happens before the 37th completed weeks and may bring complications including: neurological, mental, behavourial and pulmonary problems to the child [2].
In this work, the proposed approach envisions the use of detected contractions in EHG records as inputs of a classifier in a search of recognizing patterns. The EHG records that will be used are from a public database at PhysioNet page [3]. The intended result on this thesis is correctly differentiating four known types of uterine activity, namely: long amplitude high frequecy (LAHF) waves, Braxton-Hicks, long duration low frequency
C H A P T E R 1 . I N T RO D U C T I O N
(LDBF) waves and Fetal Movements.
This thesis takes part on a broader project: the UterineEXplorer (UEX) [4]. UEX is a tool developed for academic purposes at Universidade Nova de Lisboa that analyzes EHG signals. UEX contains some functions that will be used in this thesis, of which one performs the automatic detection of uterine events. This function has separate procedures to detect contractions and fetal movements, which makes this the only known class à priori.
The classification of events detected will, thus, be unsupervised meaning that the classifier will have no prior knowledge of what each event represents (other than fetal movements), and will make an attempt at identifying relevant patterns that provide an accurate identification of each contraction type.
Unsupervised classification or clustering is the process of finding groups that share similarities within them and dissimilarities between them. In this regard it is important to make relevant these characteristics that can distinguish these groups to obtain good results.
As such, it is requires the application of signal preprocessing techniques to improve the signal to noise ratio, make signals interpretable and extracting relevant information from them, followed by a classification procedure.
Ultimately, an affiliation between obtained classes and real types of contractions would determine the success of the study and provide functionality to the approach.
1.2
Motivation
Pregnancy monitoring is a preventive approach to problems such as abortion, premature-labor, fetus malformations and detection of any complications in the overall pregnancy and health of both the fetus and mother.
A computer-based approach for the analysis of EHG records in order to study pregnancy and it’s monitoring methods provides a way to sustain more data into consideration along with more analysis complexity. This, can help determine the different contraction’s characteristics and their differentiation along allowing the use of new variables to the decisions in pregnancy monitoring.
In this work it is intended the development of an unsupervised learning model to differentiate contractions extracted from EHG signals. Although the classes are not known à priori, which gives us no guarantees of how accurate or relevant the final classes became, the author believes it may be a step towards finding relevant patterns on the study of these signals. As such, the model developed should take into consideration how little it’s known of these signals and how this may change, requiring the ability to evolve onto new tests and changes in our view of these signals.
At a current clinical practice level, it’s mostly considered contractions frequency, ampli-tude and duration. However, through computer-based approaches to analyze EHG records, it may be possible to study pregnancy and it’s monitoring methods considering other features of these signals or more complex phenomena. Computer-based approaches also
1 . 3 . O B J E C T I V E S A N D C O N T R I B U T I O N S
allow considering a greater amount of sample signals than that which is humanly possible, allowing more statistically relevant conclusions.
EHG is being studied as a non-invasive alternative that may lead to better results than commonly used methods clinically such as TOCO [5]. Successfully identifying types of contractions in an automatic way, may lead to further studying their meanings and identifying malicious patterns that can be used to diagnose pregnancy complications.
On the whole, EHG study is a promising approach and classifying contractions extracted from it may lead to find relevant patterns for it’s study and ultimately it would be a great result if some of the classes obtained were to accurately represent real types of already identified contractions.
1.3
Objectives and Contributions
The objective of this thesis is to differentiate contractions extracted of EHG signals through an unsupervised classification model. Through this approach, the contribution to pregnancy monitoring field should be an analysis over contractile patterns and relevancy of features extracted from them. An ultimate goal would be to provide means of identifying what characterizes the different types of contractions and malicious patterns to pregnancy.
For the latter purpose, it should be designed and implemented an unsupervised learning model that allows testing features and a classification procedure to provide means of performing pattern study over EHG signals, as well as proposing a possible solution.
The contractions should be separated in a way able to identify different types of contractions on an automated way. The approach consists on building an unsupervised classifier trained by features extracted from EHG signals to define a set of classes that should be representative of the identified and documented real contractions.
It’s ambitioned a successful choice of the best characteristics to define these kinds of signals and a learning method that weights well their distributions and nature.
Automatizing contraction categorization should be a step to better understand different kinds of contractions and to allow future work on identifying ominous patterns.
It is not assured in an unsupervised learning, however, that the obtained classes are relevant or, at least, it should be hard to ground the hypothesis. As such, it should also be implemented a way to ease inspection over the results to allow for it’s visual validation by specialists, which is out of the scope of this thesis.
This work is also considering contractions that are automatically extracted from the EHG signals using methods from earlier works for the Uterine Explorer (UEX) project [4]. As such, the choice over what represents a contraction was already made and is not covered in this work.
Summing up, it should be proposed a solution to classify uterine events and test out their characteristics. This should provide a contribution towards identifying patterns in these signals and a way to easily inspect results through visual validation.
C h a p t e r
2
S t a t e o f t h e A r t
2.1
Electrohysterogram
The study of uterine electrical phenomena dates from as early as 1910, when Theilhaber detected a significant difference in the action of the string galvanometer between the ovaries and uterus of non-menopause and menopause women [6].
Study of uterine contractile activity was usually performed with mechanical measure-ment of the contractions by either a tocotransducer, which is externally positioned on the abdominal wall with an elastic strap or by an intrauterine pressure (IUP) measurement [7].
An approach that measures uterine electrical activity, the electrohysterogram (EHG), was first recorded on humans using abdominal electrodes as early as 1931 [7]. The records were described as containing a ’slow’ electrical wave in a band of 0.03-0.1Hz with an amplitude of 1-5mV, with an overlapping ’fast’ wave in a band of 0.3-2Hz with an amplitude of 50µV-1mV [7].
Alvarez and Caldeyro [8] published in 1950 a study on uterine contractile activity of 120 clinically normal cases, summing 90 labors and 30 pregnancies, using an intrauterine pressure catheter and reported the first description of the low amplitude high frequency (LAHF) wave, also denominated Alvarez wave. The study described the existence of two waves and their evolutions along pregnancy: LAHF, which had never been reported and Braxton-Hicks, named after John Braxton Hicks, who first described these contractions in 1872.
A study on the significance of Alvarez waves by Newman et al. [1] hypothesized the possibility of Alvarez waves being more frequent in patients who subsequently developed preterm labor, although the statistical value made the theory inconclusive. This hypothesis was also statistically verified in the results from a study performed by W. Roberts et. al [9]. However, other studies state the existence of no correlation between the occurrence of LAHF contractions and parity nor gestational age and the difficulty of taking any conclusion given that these account for 70 to 80% of the total contractions recorded in normal pregnancies [10].
C H A P T E R 2 . S TAT E O F T H E A RT
Marque et al. [7] studied external EHG records from different pregnancy stages, sum-ming 11 labor, 6 pregnancy and 4 supplementary cases, corresponding to two induced labors, one premature labor risk and one labor with uncoordinated contractions. Results showed pregnancy contractile activity is mainly characterized by low frequencies and a long duration (averaging 74.6s), whereas that of labor is related to the presence of higher frequencies and shorter duration (averaging 59.3s).
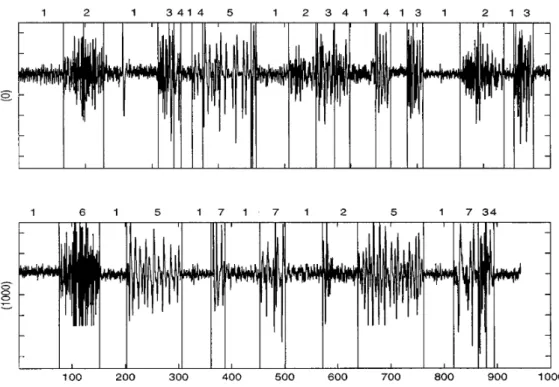
M. Khalil et. al [11] performed the first contraction segmentation algorithm detecting four types of already identified uterine events: Alvarez waves, Long duration low frequency (LDBF) waves, contractions and fetal movements. In their work, they performed the decomposition of the signals using wavelet transform (WT) to obtain scales. These were, then, applied to an unsupervised classification process based on the on-line comparison of variance covariance matrices, which classified the events. Finally, a supervised algorithm based on neural networks was applied to identify each group of events. The result of the event detection and grouping algorithms are represented in Figure 2.1.
Figure 2.1: Detection and classification in uterine EMG. The numbers on top refer to: ’1’ - background activity; ’2’ and ’6’ - contractions; ’4’ and ’7’ - fetus motions; ’5’ - LDBF
waves; ’3’ - Alvarez waves. [11]
Regarding the comparison of methods for uterine contraction activity, J. Alberola-Rubio et. al [5] make a comparison of EHG signals to the tocography alternative. The results defend that EHG-based techniques were able to detect a higher number of uterine contractions than tocography, especially from recordings taken over the uterine median axis. In another study, however, K. Horoba et.al [13] describe EHG signals as difficult to interpret, requiring computer-aided systems, and tocography as an inaccurate mechan-ical technique. The study disregards both for considering neither techniques provide an
2 . 2 . C L A S S I F I C AT I O N O F E L E C T RO H Y S T E RO G R A M S I G N A L S
(a) Alvarez wave (b) Fetal Movement
(c) Contraction (d) LDBF
Figure 2.2: First illustrated example in the literature of the different uterine events [12]
acceptable quantitative description of the recognized patters.
2.2
Classification of Electrohysterogram Signals
Classification of signals, refers to the application of procedures that differentiate the signals into classes. In the context of this thesis, these procedures have no knowledge of what the classes should look like, having to define them according to what they learn from the data that is provided. Hence, these procedures fall in a class of algorithms referred to as unsupervised learning.
Although it’s not our goal it should be referred that some studies applied supervised learning algorithms, meaning it was used labeled or classified data in the learning procedure such as by delivery week [2,14–17], or by whether it was a pregnancy or a labor signal [18].
In an unsupervised learning problem a crucial step is knowing the domain in which our classes play out to define how to influence the classifier to cluster them together and differentiate them from the other classes.
Studies regarding EHG signals have attempted to define the relevance of their different characteristics to provide better characterizations of their behaviors. These attempt at improving the significance of the information extracted from EHG signals to be used on different applications. In the literature, one can find descriptions of characteristics including:
C H A P T E R 2 . S TAT E O F T H E A RT
• Non-linearity measures [19,21–24];
• Time-Frequency representations [4,25,26];
• Overall feature selection methods [15,27]
Most found studies regarding EHG provide attempts at detecting preterm birth [12,
24, 28–31], contractions [11,32,33], differentiate pregnancy stages and labor [18,19,34,
35].
The literature refers to the application of unsupervised classification using EHG records, is studies including:
• M. Diab et. al [28] performed a Fisher test based on the comparison of the variance vectors computed from the scales, obtained from a Wavelet packet decomposition. The study considered contractions having the same registration week of delivery but different birth week of gestation (BWG) as an attempt to predict preterm. Results showed the classification error became high when the difference between BWG was small and small for big BWG divergence. As such, they obtained good results for cases where the distance between classes was large.
• M. Khalil et. al [12] othar than in [11] performed another unsupervised classification of contractions to difference contractions, foetus motions, Alvarez waves, LDBF waves using Support vector machines (SVM) using variances of the selected packets from a wavelet packet decomposition as features. The same features are used in another study by the same authors [36] which perform a classification based on Fisher’s test and clustering to detect term and preterm delivery.
This work will attempt a classification procedure that clusters similar contractions together. An optimal result would differentiate real types of contractions such as Alvarez waves, Braxton-Hicks contractions, LDBF and fetal movements. However, the validation of whether the generated clusters really represent those would have to be made by a specialist which could visually correlate those contractions of a specific cluster with real ones.
2.3
Uterine Explorer Tool
Previous to classifying contractions, EHG records require preprocessing procedures mostly to enhance the influence of uterine events rather than unused band or noise from other sources and to evidence specific characteristics of the signals that may more accurately represent the types of contractions. Furthermore, it is also necessary to extract the contractions out of the original EHG signals, which represent full test recordings containing uneventful segments.
These procedures are mostly assured by earlier work under the Uterine Explorer (UEX) project [4] developed in MATLAB to analyze EHG signals. Currently, UEX offers means to perform different preprocessing procedures to the signal as well as analyze many of
2 . 3 . U T E R I N E E X P L O R E R T O O L
it’s features in time, spectral and time-frequency domains. It has the ability to perform contractile event extraction from the full signals, using prominence of peaks over signal energy as criteria to define what is a relevant event and it’s boundaries.
UEX is referred here as the goal of this thesis is held in the context of bringing an unsupervised classification of contractions that may integrate the UEX tool project or contribute to a solution for that problem. Thus, other UEX contributing studies will have an influence over decisions to come and provide some of the procedures used.
C h a p t e r
3
E H G S i g n a l D e s c r i p t i o n a n d
P r e p r o c e s s i n g
3.1
Pregnancy Monitoring and Electrohysterography
Pregnancy monitoring is a very important matter as it aims maintaining both the patient and fetus health [28], approaching problems such as miscarriage and premature labor. A number of methods are used for monitor pregnancy, with different applications and purposes, from assessing cardiac response and functioning to fetal development and other physiological events to identify anomalous scenarios. Pregnancy monitoring meth-ods include, among others, ultrasonography, electrocardiography (ECG), phonography, phonocardiography and electrohysterography (EHG).
Ultrasonography consists on acquiring images from the selective reflexion of acoustic energy, which contrast tissues with different reflexion properties. This method can be used to verify if the fetus structures are well developed and even get motion characteristics of these structures. As an example, Cardiotocography is a type of ultrasonography that measures heart rate using a Doppler-ultrasound based system. While this method is very powerful there are concerns about continuous exposure to the ultrasonic signal.
A very commonly used method is Electrocardiography (ECG). It records fetal cardiac activity using electrodes that measure the electrical activity of the heart. This method can be performed indirectly by placing electrodes over the patients womb or in a invasive way when an electrode is placed directly on the fetus scalp. The former can be used during the pregnancy to diagnose congenital heart diseases or study the fetus heart rate response to drugs administered. The later approach is highly invasive and only possible during labor and under specific dilation conditions. This method may be used to assess fetal distress, which may be an indicator of unsuccessful contractions that should be addressed by adjusting oxitocin administration.
Phonography is a method used to measure vibrations on the patients abdominal wall through a transducer. It has evolved a lot over the years to become more sensible to fetal activity and to be able to record it even when the fetus changes position. Being a non-invasive method and not emitting energy to the fetus makes phonography a viable
C H A P T E R 3 . E H G S I G N A L D E S C R I P T I O N A N D P R E P RO C E S S I N G
candidate for continuous monitoring of fetal health during pregnancy.
Electrohysterography (EHG) or uterine electromyography (uEMG) measures the intra-cellular action potentials (IAP) of the uterine muscle cells through electrodes placed on the abdominal wall. Uterine electrical activity results from the depolarization and repolariza-tion of myometrial smooth muscle cells [37] and is the source of EHG signals. The action potentials (APs) measured constitute neural stimulation for contraction and relaxation of cells and their propagation through the myometrium is an electrical burst recorded by the EHG electrodes [38]. These records are representative of the physiological events taking place in the uterus containing information about contractions and fetal movements [38]. The evolution of contractions throughout pregnancy is related to an increase in cellular excitability and synchronization, having more cells adhering to the contractions and is a necessary condition for enabling cervix dilation and fetus expulsion [15].
Interpretation of EHG records, even though has still not met the accuracy standards for application in clinical practice [18, 39], is increasingly getting attention from various studies. Researchers aim at applying the study of EHG records as a clinical practice for overall pregnancy monitoring and specific cases like contractions affectability on EHG records [33], contraction evolution and specific applications such as, mainly, detection of preterm labor. The later application is particularly important as it may carry neurological, mental, behavioral and pulmonary implications to the fetus and may even lead to death [40], along other social and economic implications [2, 14]. An accurate preterm delivery prediction method would allow better prevention, treatment and resource allocation [40]. Studies comparing EHG with the most commonly used clinical practices including intrauterine pressure determination (IUPD) and external tocodynamometry (TOCO) have shown that EHG is more reliable than TOCO, according to IUPD data, described as the golden standard, yet with the advantage of being non-invasive in comparison with IUPD [32,41]. An article by L. Chen and Y. Hao [17] describes EHG method as a noninvasive, low-cost, real-time, and effective technique compared to traditional methods.
Other than unmet accuracy standards, EHG’s applicability still meets some challenges as its records are complex and difficult to interpret, implying high dependence of a computer-aided system [13]. Not being a clinical practice, brings difficulties to collect a more statistically relevant amount of data that could further model these problems domain. Thus, an important step towards making EHG feasible may be creating standards for the acquisition of EHG records, such as for the number of electrodes and their position, as well as acquiring more data to increase statistical significance.
As previously mentioned EHG records are obtained through electrodes placed on the abdominal wall. However, there are still no standards for the application of this method and different setups for the data acquisition method are found among EHG studies. Within these, electrodes are usually placed 2.5 to 7cm horizontal and vertically apart [42], with slight changes on the overall position of the electrodes over the abdominal wall, different dispositions and number of electrodes. The later diverge between 2 [34], 4 [14, 24, 39,
43–45], 5 [46], 10 [47, 48], 16 [15, 17, 18, 23, 35] up to 64 [38]. An usual setup of a 16
3 . 1 . P R E G N A N C Y M O N I T O R I N G A N D E L E C T RO H Y S T E RO G R A P H Y
Figure 3.1: Typical example of the 4x4 electrodes matrix and TOCO sensor positioned on the woman’s abdomen [19].
electrode EHG recording test and the simultaneous recording with a TOCO is illustrated in figure 3.1.
An increased number of electrodes becomes relevant considering the functional and structural complexity of the uterus [25]. This complexity arises from the stochastic, nonlinear mechanisms interacting with a fluctuating environment, which implies limitations in the use of a reduced number of sensors [25]. The use of multiple electrodes also allows spatial perception required for the study of propagation of the electrical activity throughout the uterus [19] and is required to attain bipolar signals which result from the subtraction of the record of an electrode with another to cancel common noise.
3.1.1 Used EHG Records
In this work it will be used EHG records from the Icelandic 16-electrode
Electrohystero-gram (EHG) Database stored in PhysioNet page [3]. The recording system consists of 16 electrodes arranged in a 4-by-4 squared positions on the abdomen, providing sixteen signal records of the electro-physiological phenomenon measurable in slightly different positions of the abdominal wall. For future reference, the electrodes are numbered as illustrated in Figure 3.2a and their position in the patient’s abdomen is illustrated in Figure3.2b.
Records were captured with a 200Hz sampling frequency and a duration averaging 61 and 36 minutes for pregnancy and labour recordings, respectively. The database contains 122 recordings of 45 pregnant women , 10 of which took place during labor. Recordings durations vary from 19 to 86 minutes and gestational ages vary from 29 weeks and 5 days to 41 weeks and 5 days. Each case contains some information of the patient such as the patient’s age, gestational and labor ages, previous pregnancies information, oxitocin administration and labor procedure informations.
A greater detail on the description of electrodes placement configuration, test protocol procedures, some of the decisions rational and the files they provide may be found in the database website [3].
This database seems a good choice for EHG studies as it has a standardized protocol, which is a requirement when analyzing signal characteristics that should not be influenced
C H A P T E R 3 . E H G S I G N A L D E S C R I P T I O N A N D P R E P RO C E S S I N G
(a) Electrodes 4x4 arrangement [3]
(b) Position of the electrodes arrangement in the patient’s abdomen [3]
Figure 3.2: EHG Electrodes Placement [3]
by different recording methods and procedures. Furthermore, it has a fairly defensive protocol that may accommodate future discoveries. An example is the use of a 4 by 4 electrode grid, allowing study and usage of signal propagation characteristics. Also, it uses a recording sampling frequency of 200Hz to study a signal for which related studies consider a frequency band of interest going up to 2Hz, accommodating findings on relevant information for higher frequency components.
3.1.2 Uterine Physiological Events
Statistical approaches using EHG records pursue recognizing patterns in the evolution of contractions, among other physiological events. In this regard, it is hypothesized a use in the study of individual and the overall behavior of these events to assess the state of pregnancy.
A few uterine events of interest can be identified from the EHG signals, which in-clude fetal movements and the contraction types: low amplitude high frequency (LAHF), Braxton-Hicks and long duration low frequency (LDBF) [49].
LAHF contractions or Alvarez waves, first described by Alvarez and Caldeyro [8], have intensity lower than 5mmHg, occur 1 to 3 times per minute, starting at the 9th week and occurring until the end of pregnancy. In their study these contractions are described as uterine fibrillation for their unsynchronized, localized characteristics, occurring randomly in different parts of the uterus [1, 10]. A study on the significance of Alvarez waves by Newman et al. [1] hypothesizes the possibility of Alvarez waves being more frequent in patients who subsequently developed preterm labor, although the statistical value made the theory inconclusive. Other studies state the existence of no correlation between the occurrence of LAHF contractions and parity nor gestational age and the difficulty of taking any conclusion given that these account for 70 to 80% of the total contractions recorded in normal pregnancies [10]. While their occurrence is not proven to be an indicator of labor
3 . 2 . S I G N A L P R E P RO C E S S I N G
proximity, LAHF activity seems related to high excitability and poor coordination of the uterine muscle and should be further studied [10].
Braxton Hicks contractions are described as painless, non-rhythmical contractions of higher intensity [8]. Their occurrence increases during pregnancy being very sporadic in the first 8 months and only acquiring a regular rhythm in the last 2 weeks before labor with 3 to 9 occurrences each 10 minutes [8].
LDBF contractions, have a duration of 2 seconds, up to several minutes in a band of 0 to 1Hz. These are associated with uterine hypertonus, meaning an excessive tension of the uterus without retrieving to a complete relaxation of the muscle, which causes fetal distress and may jeopardize fetal well-being [4,19].
These events electrical activity is usually studied considering a band of interest around 0.2 to 1Hz (further analyzed in 3.2.2) and an amplitude ranging 100µV to 1.8mV [49].
3.2
Signal Preprocessing
Raw data collected from physiological events requires very specific domain-dependent analysis and preparation to allow a solid interpretation. Rather than uterine activity alone, the data acquisition mechanism record an electric potential difference, which con-tains information from many other sources. The procedures to analyze and create new representations of the signals can be qualified as signal processing.
Signal editing represents a pre-analysing procedure to detect and remove negligible or degraded signals segments, if not whole cases. It is, most often, made visually by experts and may be a crucial step to discard data that will corrupt any further analysis.
Signal preprocessing covers all procedures applied to improve a signals readability. These, should, mainly, pick the relevant information and find logical, intuitive ways to represent it. EHG related studies include procedures such as resampling, filtering, offsetting, de-noising, signal transformation, burst detection, etc.
The procedures applied require a knowledge of the signals nature and of the domain dealt with. As physiological activity, the recorded information is bound to have nonlin-ear characteristics [19, 50]. In addition, EHG records contain information from other sources such as maternal electrocardiogram, abdominal muscle electrical activity, respi-ratory movements, electrode-skin contact potential fluctuation, movement artifacts and baseline components [5,35,38], which should be considering on signal processing.
In the context of a classification, finding the processing techniques that build up the signal’s information relevance is a crucial step, as it becomes part of the classification model itself. After a training set has defined the classification process all new signals that should be analyzed have to go through the very same processing to become contextualized inputs of the classifier.
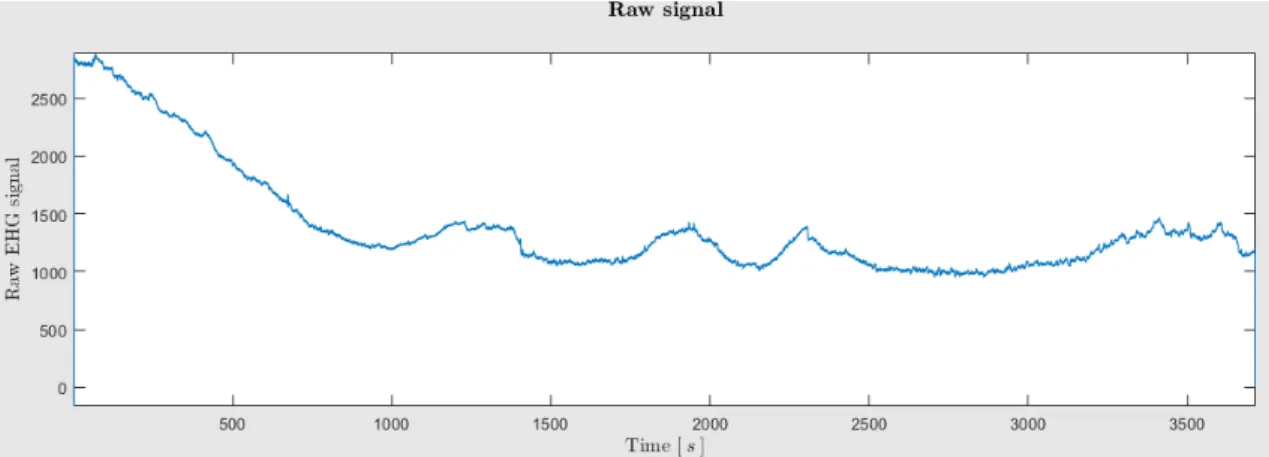
Inspecting the raw signal represented in Figure 3.3, it becomes clear that it holds little to no meaning. At this stage, the signal is tilted due to electrodes movement and adaptation to the skin, and the polarization of the skin-electrode interface, which acts as
C H A P T E R 3 . E H G S I G N A L D E S C R I P T I O N A N D P R E P RO C E S S I N G
a battery due to sweat, and contains undesirable information from different sources (will be discussed in 3.2.2).
Figure 3.3: EHG Raw Signal. The amplitude has no meaning as it is relative due to machine gain.
Given the weak amplitude of uterine contractile events, ranging from 100µV to 1.8mV [49], the presence of multiple unbalanced sources and the different impedances in the skin, the recording mechanism requires an amplifier with a high gain to increase noise performance. As such, a first preprocessing procedure applied is dividing the machine gain to the raw signal to obtain a real amplitude scale.
It was observed high disturbances in the beginning and final parts of some test records. The disturbances seem to be caused by either starting the recording while still positioning or moving electrodes. To avoid these, 20 seconds were removed from the beggining and end of all records.
The remaining applied preprocessing techniques will be described in the following subsections.
3.2.1 Decimation
Given the contractile events have low-frequency characteristics, depending on the recorded sampling frequency an usually useful step to decrease computation time and signal length is down-sampling [38].
The band of interest of EHG signals is discussed in the next subsection3.2.2, yet given that studies, usually, only consider frequencies as high 1-5Hz and recorded EHG sampling frequency takes values such as 100Hz [45], 200Hz [15, 18, 23, 31, 47] 500Hz [5, 13, 48], up to 1024Hz [38], decimation is usually possible and with great benefits. The reason sampling frequencies take such high values is only attributed to the fact that EHG has not been studied enough to determine that no high frequency components may be relevant. The price and effort required to create an EHG database motivates a defensive approach of performing an exorbitant measurement.
3 . 2 . S I G N A L P R E P RO C E S S I N G
Related studies apply decimation to obtain sampling frequencies of 3.125Hz [51], 6.25Hz [18], 8Hz [41], 16Hz [38], 20Hz [44], etc. The most widely used criteria to define an appro-priate sampling frequency is through Nyquist–Shannon sampling theorem, which states that, given a frequency fs, perfect reconstruction is guaranteed possible for a bandwidth B < fs
2. As such, decimation may be dimensioned through this criteria in a way that keeps
intact the band of interest in the study of EHG records.
In this work, it will be considered that the uterine electrical activity band of interest is defined as 0.1Hz to 1Hz (which will further be discussed in subsection 3.2.2). Considering this band and according to the Nyquist–Shannon sampling theorem, the minimum sampling frequency that can be considered without loss of these components is 2Hz. However, as a defensive choice the sampling frequency was defined as 4Hz in order to minimize aliasing effect.
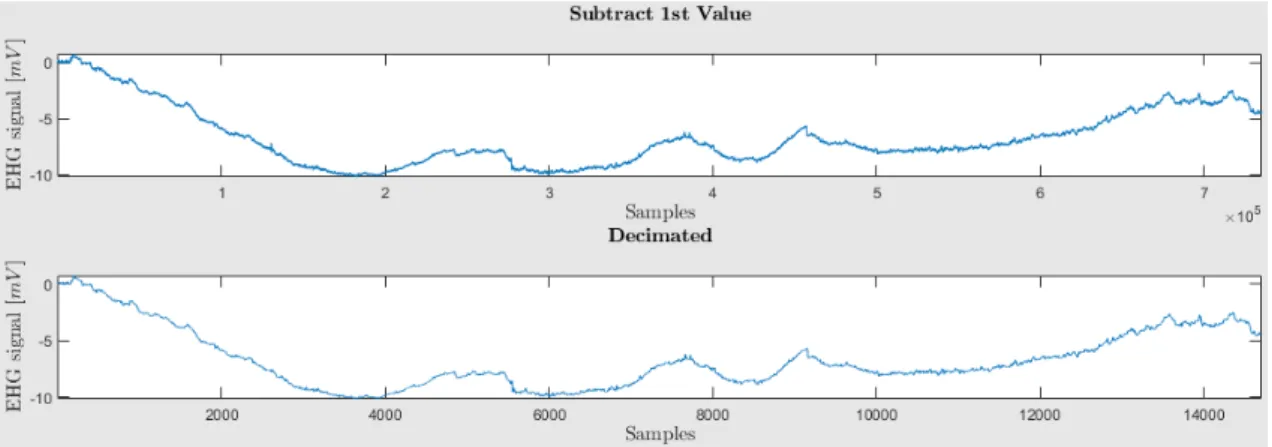
The EHG records found in the PhysioNet Database [3] are sampled at a frequency of 200Hz, as such a decimation filter was applied to the signal to re-sample it with a decimation factor of 50. The effect of the decimation is illustrated in Figure 3.4.
Figure 3.4: Effect of decimation. The plots represent a signal before and after applying the decimation filter, respectively.
As illustrated, the decimation performs a sample-wise rescaling of the signal. The signal size was reduced from roughly 8 × 10⁵ samples to roughly 16000, which represents a substantial reduction of computation requirements for further use of the data.
3.2.2 Filtering Process
Digital signal filtering is a process that can be used to separate or restore signals. Signal separation is performed on signals that contain noise and interference from other signals. As an example, it should be used o the EHG records to extract uterine activity related events, while canceling other physiological phenomena such as the ones mentioned in the beginning of this section 3.2. Signal restoration is applied on cases where the signal has been distorted to attempt recovering the real source of the signal.
The signal separation process of extracting the desired frequency components of a signal and suppressing partial or completely the undesired ones may be performed by
C H A P T E R 3 . E H G S I G N A L D E S C R I P T I O N A N D P R E P RO C E S S I N G
either windowing the signal in the frequency domain or through discrete-time system operations in the time domain [52]. In short, the later may refer to one of two filter classes: Finite Impulse Response (FIR), carried out by convolution of the input signal with the filter’s impulse response, and Infinite Impulse Response (IIR) filters, which are an extended version, with recursive characteristics [53]. As the name implies, the classes differ in their response to an impulse. Since FIR only uses present and past input information to determine respective output, it has a finite response to an impulse. Conversely, IIR, aside from input information is fed previous output information in it’s estimates, which creates an infinite response [53].
When filtering EHG records, it is intended the separation of the uterine related events from the other physiological events recorded. To achieve this, there is some range of frequency bands considered. Amongst studies, there is, in the most part, an agreement in considering a range from 0.2Hz up to 1Hz [33,34,41,48,54]. Although, commonly used minimum frequencies are also 0.1Hz [5,18,39,54] and 0.34Hz [14,22,39,40,42,46,51], which avoids respiration interference [14,46]. Maximum frequencies considered may go up to 4Hz [5,30,31] and 5Hz [39].
The bands of choice is based on the fact that uterine contractile activity energy is mostly concentrated in a range up to 1Hz, along with the necessity to exclude the interfering artifacts. The main electrical signals considered interference and noise include:
• Maternal electrocardiogram (ECG): Electrical activity of the patients heart creates interference with a frequency band of main components ranging from 1.38Hz to 1.5Hz [4];
• Maternal respiration: Has a frequency band that ranges from 0.2 to 0.34Hz, being the most interfering component [4].
• EMG noise: Due to abdominal muscle activity recording. It’s dominant component revolves around 30Hz [4];
• Motion: Has a frequency range between 1Hz and 10Hz and causes distortion due to relative motion of the electrodes and the decrease in muscle related to it’s activation [55];
• Inherent noise in electrical equipments: Persistent, stable noise dependent of the high quality of the device with frequency components ranging 0Hz to several thousands Hertz [55];
• Ambient noise: The main source is the electromagnetic radiation associated with the power line, with frequency components of 50Hz or 60Hz [55];
• EMG inherent instability: Due to the unstable nature of motor units firing rate, with frequency components ranging 0Hz to 20Hz [55];
3 . 2 . S I G N A L P R E P RO C E S S I N G
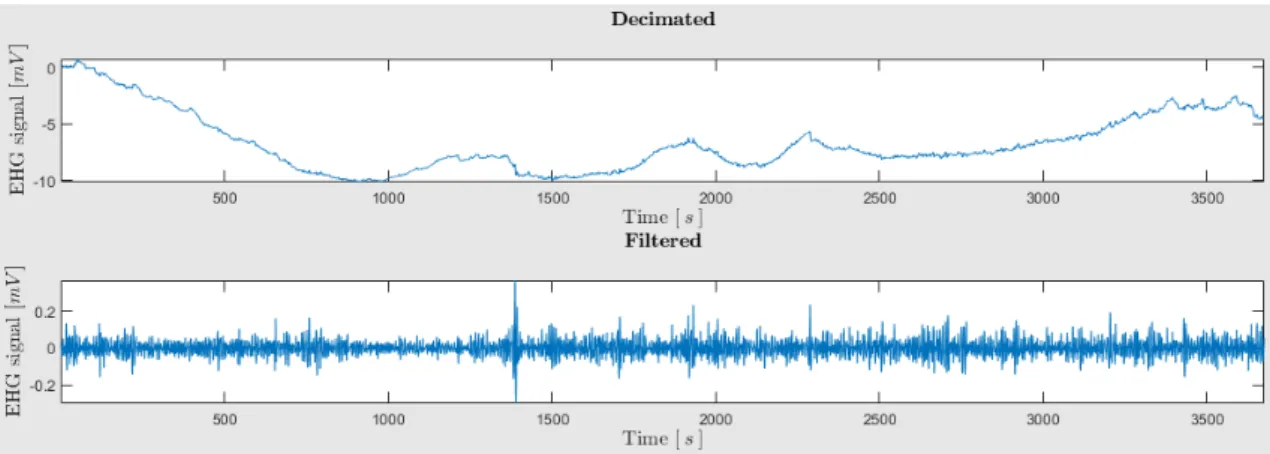
In this work it will be considered a band of interest ranging from 0.1Hz to 1Hz. This decision is based upon the spectral characteristics of the interfering sources previously listed and the fact that most of the uterine electrical activity energy is in that band [19, pp. 27]. In this regard a wavelet packet (WP) filter was applied to the signal, which was earlier developed in the UEX projectcontext and is described in [4]. This filter was chosen for it’s stability, computational efficiency and simplicity.
Figure3.5 shows the effect that the filter has in the EHG signal.
Figure 3.5: Effect of applying a pass-band filter with cutoff frequencies in 0.1 and 1Hz. The plots represent the signal before and after applying the filter, respectively.
At this point, those components outside the frequency band of interest are greatly attenuated it producing a more interpretable and relevant signal to the study of uterine events. Thus, the obtained signal will be smoother with reduced higher frequency noise and abrupt changes. In the other hand, the lower frequency components that produced the huge offset wave across that tilts the whole signal were attenuated producing a very clear result in 3.5.
3.2.3 Bipolar Signals
A mostly adopted method to reduce noise is the use of bipolar signals obtained by subtracting signals recorded form pairs of electrodes. Use of bipolar signals allows canceling common mode interferences and has been demonstrated to reduce a large portion of the noise [5,38].
Evidently, subtracting pairs of signals to reduce noise will also have an effect on the uterine events and it has also been shown to have low spatial resolution when localizing and differentiating multiple dipole sources. The obtained signals are affected differently, as conductivity is not homogeneous among the electrodes, which affects the study of signal propagation [5]. The article [5] describes Laplacian bioelectric potential as a possible solution to the previous problem. Another additional procedure to the use of bipolar signals may be to their normalization by dividing standard deviation to each signal [25].
C H A P T E R 3 . E H G S I G N A L D E S C R I P T I O N A N D P R E P RO C E S S I N G
The method is claimed to ensure equal significance of features in the process of classification [25].
In this work, bipolar signals will be used with the same configuration as that of Catarina Sousa’s work [56, pp. 52-55], whose contribution to UEX project included a study of the referred configuration. In their work, the reader may find a more detailed explanation of the decision made and a graphical example that shows the significant reduction of the maternal ECG influence in a bipolar signal compared to those of the used monopolars pair.
Computation of bipolar signals will be performed by the difference of monopolar signals respecting the positions illustrated in Figure3.6in accordance to the same numbering and position as in Figure 3.2a.
Figure 3.6: Relation of monopolar to bipolar signals. The top-most and left-most circles represent the calculated bipolar signals, which specify their respective numeration and the computed subtraction.
The Figure 3.6 shows how 10 bipolar signals are extracted from the subtraction of monopolar records corresponding to electrodes on opposite vertical, horizontal and diagonal positions. The distance between electrodes that define a bipolar signal was maximized to allow a good compromise between common noise reduction and avoiding canceling out relevant components in accordance to the results obtained by Catarina Sousa’s work [56].
As such, by the configuration observed in Figure 3.6, bipolar signals are given by
EHGb1 = EHG1− EHG9 EHGb2 = EHG2− EHG14
.. .
EHGb5 = EHG1− EHG4
.. .
EHGb9 = EHG1− EHG16 EHGb10= EHG13− EHG4
3 . 2 . S I G N A L P R E P RO C E S S I N G
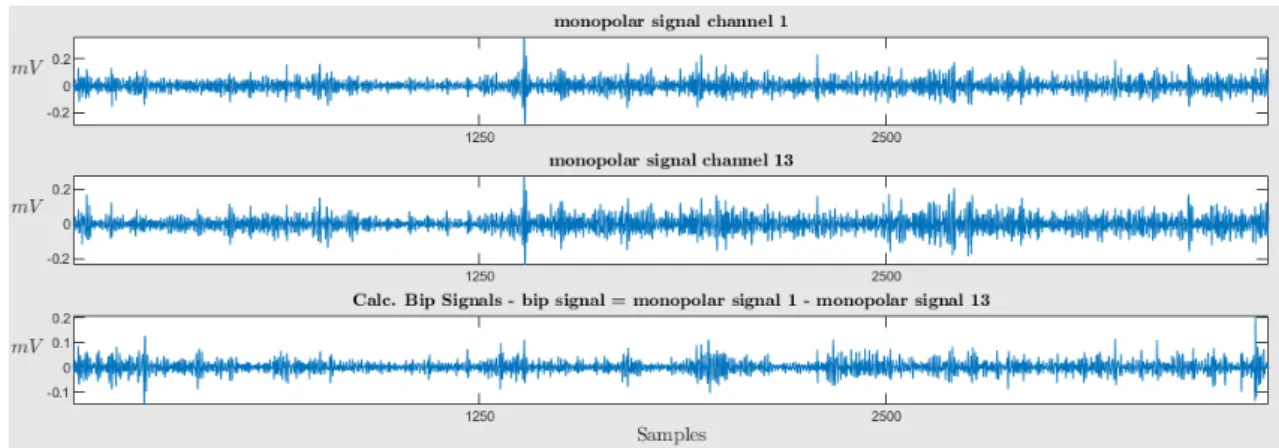
An example of the results obtained in this procedure represented in Figure 3.7.
Figure 3.7: Effect of subtracting monopolar signals. The first two graphs represent records from different electrodes, while the third represents the bipolar signal resultant of the subtraction.
Figure 3.7 shows a pair of monopolar signals that show great similarities and the resulting bipolar signal. The later has a thinner base line and more visible events. Thus, it may be concluded that the procedure may have ominous influence over uterine events through their attenuation or manipulation, but also reduces common noise interferences and results in a cleaner signal with better distinguishable events.
3.2.4 Extraction of Uterine Events
Having a seemingly satisfactory manipulation of the test records with respect to noise reduction, ease of computation and enhancement of the components that characterize uterine events, the next step is extraction of the uterine events from the records. Optimally, this procedure should isolate uterine events consistent to those specified in 3.1.2, by scanning the signals for those characteristics that define each of those events.
Although there is some knowledge of how those events should be and what characterizes them, the analysis of real EHG records brings less defined boundaries, bringing some disagreement to the criteria used for extracting the contractile segments. The methods must define what constitutes a contraction along with where it begins and ends. Furthermore, the decision should not only define contractions with respect to baseline behavior, but also noise components, which can even lead to greatly represented outliers.
As such, it is first presented some studies that also performed contraction extraction, the methods they used and some of their considerations:
• Manual [15,17,18,23,25,35].
• Algorithm based [30]:
1. determination of EHG slow wave which represents the strength of contractile activity;
C H A P T E R 3 . E H G S I G N A L D E S C R I P T I O N A N D P R E P RO C E S S I N G
2. determination of basal tone which corresponds to the resting potential
3. application of detection level above basal tone to detect the candidate episodes of increased activity
4. validation as contractions when duration and amplitude related to the basal tone exceeds established minimal values;
• Manual selection according to the criteria [5]:
– Significant rise in signal amplitude with respect to basal period; – Duration longer than 30s;
– Signal morphology typical of electrophysiological changes. Signals with over-abrupt changes, saturation or coincidental in time with movements of the patient during the recording session are discarded.
• Algorithm based [39]:
1. Calculate RMS and the unnormalized first statistical moment of the frequency spectrum of 30s moving windows displaced every 0.25s;
2. identify segments with amplitude significantly different to that of the baseline;
3. Identify Baseline activity with a 4 minute moving window displaced every 0.25s, where the baseline is assumed to be the average of the 10% lowest amplitude values;
4. Identify Segments of interest that respect the conditions
– Having over two times the mean baseline activity;
– Having over 25% the signal amplitude of each window for more than 30s.
5. classified by two experts as being or not an artifact.
• Manual selection where bursts were identified by [40]:
– succession of increased-amplitude voltage spikes whose mean amplitude re-mained at over 2 times the mean baseline activity;
– duration was over 10 seconds;
– correspond, at least temporally, to uterine pressure events as measured by TOCO.
• Manual segmentation [33]:
– Term labor group:
∗ term labor group: contraction period consisted of 10 seconds before and after the peak of burst, summing 20 seconds;
3 . 2 . S I G N A L P R E P RO C E S S I N G
∗ select non-contractions from the middle of adjacent contractions also con-sidering 20 second duration segments.
– Non-labor group:
∗ Does not consider a contraction period and every 20 seconds was selected manually as one non-contraction period.
This work will be using contraction extraction algorithms developed for the UEX project [4] by other contributors. The algorithms define candidate contractions through study of the the signal’s energy estimation peaks and determines whether it is a contraction and it’s boundaries through a peak prominence criteria, assessing it’s amplitude and relative location to other peaks. Energy limits are also defined as a way to rule out outliers. The algorithm was implemented to consider five different energy estimators, including:
• Wavelet Energy (Figure 3.8);
• Teager Energy Operator (Figure3.9);
• RMS (Figure 3.10);
• RMS squared (Figure 3.11);
• Hilbert-Huang Energy Spectrum (Figure3.12);
The resulting contraction segments using each of the energy estimators of the algorithm are represented in Figures 3.8,3.9,3.10,3.11and 3.12.
Figure 3.8: Detected contractions using Wavelet energy
It becomes clear from inspecting the Figures3.8,3.9,3.10,3.11,3.12that there is quite a big difference in the segmentation decisions of each method while considering the same signal. Results show that further work is required in defining the criteria for segmenting contractions or the robustness of each of the current ones. However, the inspection of which of these methods may provide the most rigorous contraction detection, as well as a more detailed explanation of how they are performing this task is out of this work’s scope. The implementation of the classifier and the processing procedures to attain the input data will assume any of the methods may be used or that further methods may be
C H A P T E R 3 . E H G S I G N A L D E S C R I P T I O N A N D P R E P RO C E S S I N G
Figure 3.9: Detected contractions using Teager-Kaiser energy
Figure 3.10: Detected contractions using RMS
Figure 3.11: Detected contractions using RMS squared
Figure 3.12: Detected contractions using Hilbert-Huang spectrum energy
3 . 2 . S I G N A L P R E P RO C E S S I N G
added. In most of the upcoming tests wavelet energy method will be used as a standard, being the one that has shown the best results according to daily experience from other UEX project contributing members.
Another important conclusion from the figures is that, although the algorithm is based on peak detection it is visible that a few peaks were not considered contractions, which is a result of the outlier detection mechanism.
In these algorithms, fetal movements are extracted separately as they compose events of lower energy that would less probably be captured by the same standards as the other uterine events. That being the case fetal movements represent the only class that is already defined, prior to classification.
3.2.5 Signal Modeling
Signal Modeling refers to techniques that generate a prediction of the signal, in order to model it. There are a number of modeling methods, which may be useful by attempting to provide an equation that fits the signal [52].
Autoregressive model (AR) offers is a linear approach to signal modeling through the estimation of an output dependent on the current and previous inputs, along with feedback values. It, thus, makes the assumption that data points are closely related to the previous few data points [52]. According to a study comparing AR model and statistical classification methods on EHG signals [28], being EHG records the result of filtered elementary activities integration and given that filtering induces a correlation between successive samples, an AR model is made possible. Furthermore, the study argues that the use of an AR model allows the detection process to be applied to the prediction error rather than the original samples [28].
The AR model of a discrete process x(n) of order q is defined as the output of a recursive filter whose input is a white noise process [28]:
xn= q X
i=1
aixn−i+ ηn,
where ηn are the AR model’s innovations [28].
Some of the AR models applied on on studies regarding EHG records are indicated bellow:
• Method based on minimization of the prediction error power σ2 = E(η
n)2, within
an AR model of order 16. The AR model was then used to generate two types of simulated uterine contractions by using White Gaussian Noise (WGN) [28];
• Method based on Linear Prediction Filter Coefficients (lpc), which uses the autocor-relation method of AR modeling to find the filter coefficients. The AR model used is of order 16 to estimate AR coefficients of two types of EMG signal: those for which the pregnancy resulted in term delivery and for the ones that resulted in preterm
![Figure 2.2: First illustrated example in the literature of the different uterine events [12]](https://thumb-eu.123doks.com/thumbv2/123dok_br/15880076.1089150/27.892.178.713.142.526/figure-illustrated-example-literature-different-uterine-events.webp)
![Figure 3.1: Typical example of the 4x4 electrodes matrix and TOCO sensor positioned on the woman’s abdomen [19].](https://thumb-eu.123doks.com/thumbv2/123dok_br/15880076.1089150/33.892.257.631.155.328/figure-typical-example-electrodes-matrix-sensor-positioned-abdomen.webp)