How does credit default swap volatility influence the Z-Score Models?
Francisco Soeiro da Cunha Barreto 1
José Nuno Teixeira de Abreu de Albuquerque Sacadura 2
ABSTRACT
The literature on credit models has produced a large body of empirical research, but no consensus has emerged and scholars often disagree about the same empirical evidence. We contribute to the current literature by studying the relationship between Z-Score Models and Credit Default Swaps (CDS). The CDS provide a clean measure of risk as they are the compensation that market participants require for bearing credit default risk. We examine the CDS spreads, CDS market volatility and CDS annual performance and their relationship with Multi Discriminant Analysis Credit models (Altman’s Z-Score (1968), Z-Score’ (1983), Z-Model (1993) and Ohlson’s O-Score (1980)).
Using a sample of 50 European companies and their annual CDS data available over the period 2006-2016, we find a strong negative relationship between all the credit models and the CDS market volatility and CDS market performance. We found little evidence between the models and the CDS spreads. These results suggest the notion that Credit Default Swaps have direct relevance to debtholders.
Key-words: CDS Volatility, CDS spread, Z-Score, Default Probability
Received on: 2018.07.31 Approved on: 2018.09.09
Evaluated by a double blind review system
1Address: ISCAL, Av.Miguel Bombarda nº20, 1050-166 Lisbon, Portugal. Email: [email protected] 2 Corresponding Author: Address: ISCAL, Av.Miguel Bombarda nº20, 1050-166 Lisbon, Portugal. Email:
Portuguese Journal of Finance, Management and Accounting. ISSN: 2183-3826. Vol 4, Nº 8, September 2018
47
1.Introduction
A Credit Default Swap (CDS) is a contract that provides insurance against the default risk of a company or a sovereign. The use of this contract is common in financial markets, as it can be used as a tool to speculate in securities, but also to reduce financial leverage (Boehmer, Chava, & Tookes, 2015; Saretto & Tookes, 2013; Subrahmanyam, Tang, & Wang, 2014). Liu and Zhong (2017) associate the CDS contract to uncertainties such as political and financial risk. Moreover, the CDS can be used as a measure of default occurrence, either by the form of its CDS spread (L. Liu, Zhang, & Fang, 2016) or establishing the link between equity markets and the probability of default (Boehmer et al., 2015; Tolikas & Topaloglou, 2017).
Credit models have been studied by several authors, since the seminal work by Altman (1968a).Reisz and Perlich (2007) used the Log function of the Z-score (E. Altman, 1968a) to develop, in conjunction with the Black-Scholes model, a market based methodology to predict bankruptcy. Other authors used machine learning models, support vector machines, bagging boosting methods and MLP neural networks to assess and predict credit default (Barboza, Kimura, & Altman, 2017; Hernandez Tinoco & Wilson, 2013). Another method that was also used was the LASSO method by Tian & Yu (2017) in the Japanese market. All these studies concluded that the Z-Score Model is still the benchmark, despite its age.
The majority of works link default prediction to firm performance (Al-Kassar & Soileau, 2014; Goto, 2010; Rim & Roy, 2014), stock market behavior and valuation (Tolikas & Topaloglou, 2017). However, very few articles connect directly the CDS spread and credit models such as the Altman’s Z-Score (1968). The use of Multiple Discriminant Analysis credit models focuses in the Altman (1968) Z-Score, using this as a distance measure of the default of a company and correlating it as a sub proxy of either the firm value or the firm regulation driver for the equity market versus the CDS market (Boehmer et al., 2015).
Portuguese Journal of Finance, Management and Accounting. ISSN: 2183-3826. Vol 4, Nº 8, September 2018
48
In this paper, we aim to study the relationship between the Z-score Models and the CDS spread, CDS spread volatility and the CDS spread performance. Since the majority of the CDS studies focuses on the Chinese (Lin, Lo, & Wu, 2016), Japanese (Tian & Yu, 2017), but mostly American markets (E. Altman, 1968a; E. I. Altman, 1984; Barboza et al., 2017; Lin et al., 2016; Rim & Roy, 2014), we find relevant to focus on European Markets.
Our sample comprises 50 companies across 8 different European countries from 2006 to 2016.
We build our sample based on all the companies listed in Eurostoxx50 with a 10-year period to assure robustness and relevance of the study.
This paper is organized as follows: section 2 will explain the data methodology, that is how the sample was gathered and the problems associated with it. Section 3 will provide a CDS market overview. The regression analysis and findings between the models and the CDS explanatory variables will be described in section 4. Section 5 will summarize and present the conclusion of this paper.
2.Data and Sample Construction 2.1.CDS Data
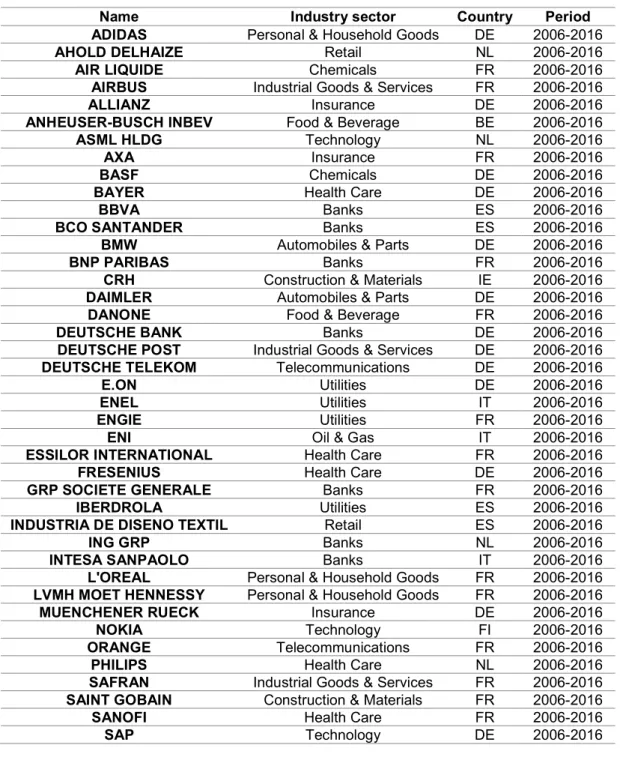
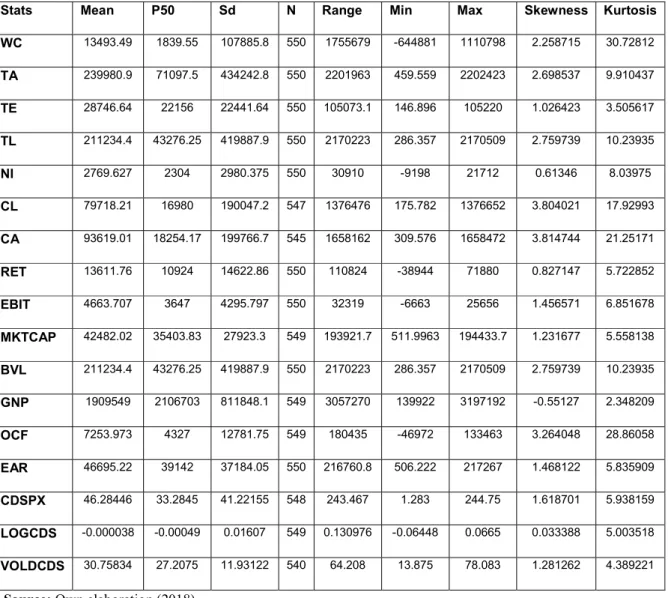
In order to build our sample, we retrieved information from Bloomberg regarding the firms quoted in Eurostoxx50, covering 50 companies from eight different European countries. The Gross National Product (GNP), which is a variable necessary to build the O-Score model (Ohlson, 1980), was gathered from Datastream for each different country. Our Data sample comprised annual observations from 2006 to 2016, covering a 10-year interval and with 549 observations for 50 companies. Table 1 presents the description of the companies analyzed, the period of the sample, the country of origin of each company and the industry sector of each company. Table 2 presents the model variables taking into consideration in this paper as well as their respective abbreviations. Table 3 summarizes the
Portuguese Journal of Finance, Management and Accounting. ISSN: 2183-3826. Vol 4, Nº 8, September 2018
49
general statistics of the sample namely the control and explanatory variables of the ZSCORE1, ZSCORE2, ZMODEL and OSCORE models.
2.2. Empirical Analysis
For our empirical analysis we chose three MDA models developed by Altman (1968, 1983, 1993) and the model developed by Ohlson (1980) which was the first to employ conditional probabilities in the model. The MDA models developed by Altman and that we selected are present as follows (Fig1):
Fig1-Z-Score Models developed by Altman
Source: Own elaboration (2018).
The Z-Score Models and Z-score methodology is based on Multi Discriminant Analysis (MDA).
Using this statistical approach, Altman developed these models classifying the observations into groups according to its qualitative data, namely into bankrupt or non-bankrupt.
ALTMAN MODELS
Z-SCORE (1968) Z-SCORE (1983) Z-MODEL (1993)
X1 Working capital / Total
Assets Working capital / Total Assets Working capital / Total Assets
X2 Retain earnings / Total
Assets Retain earnings / Total Assets Retain earnings / Total Assets
X3 EBIT/Total Assets EBIT/Total Assets EBIT/Total Assets
X4 Market equity value/ book value of total debt
Book Equity value/ total Liabilities
Book Equity value/ total Liabilities
X5 Sales/Total Assets Sales/Total Assets _
Safe zone Z >2.99 Z >2.90 Z >2.90 Grey zone 1.80< Z <2.99 1.23< Z <2.90 1.23< Z <2.90 Distress Zone Z < 1.80 Z < 1.23 Z < 1.23 Z-Score (Altman 1968) Z =1.2*X1+1.4*X2+3.3*X3+0.6*X4+0.999X5 Z-Score’ (Altman 1983) Z’= 0.717*X1+0.847*X2+3.107*X3+0.420X4+0.998*X5 Z-Model (Altman 1993) Z-MODEL= 6.56*X1+3.26*X2+6.72*X3+1.05*X4
Portuguese Journal of Finance, Management and Accounting. ISSN: 2183-3826. Vol 4, Nº 8, September 2018
50
Altman (1968a) used this technique in conjunction to the statistical significance of each ratio to select the financial ratios for the model in order to accurately predict default occurrence.
The table above shows the models that were developed and improved by Altman the Z-score (1968), the Z-Score’(1983) and Z-Model (1993). However these models were not the only revisions made in the original Z-score (1968) and the Z-Score Mythology, some revisions worth mentioning regarding the Z-score and its applications were , the application of the logarithm function on the Z-score (Lepetit & Strobel, 2015), the inclusion of the real earnings into the Z-Score (1968) as explained and developed by Lin, Lo, and Wu (2016). Other Application and updated in the Z-Score(1968) was the creation of the emerging market score, EMS Score, developed by Altman (2005).
In this paper, we define alternatively our Dependent Variables as ZSCORE1 which is the Z-score model from 1968, ZSCORE2 being the Z-Score’(1983) and ZMODEL which is Z-Model (1993).
Rim and Roy (2014) and Boehmer, Chava, and Tookes (2015) who used the Z-score’(1983) and mostly Z-Score (1968) to classify the firms regarding its credit worthiness and default probability, correlated the model with the firm value and connected it indirectly with the CDS premium. They concluded that the Z score’(1983) is a good barometer for assessing a company credit worthiness and perceive its default risk. Tolikas and Topaloglou (2017) employ the Z-score (1983 and 1968) to measure the average financial distress of firms worldwide and correlate the results with the stock market and CDS Spread. They suggest that there is no difference between the models used. Other authors just correlate the Z-score and firm value and establish a indirect link in their correlation with the CDS Market, focusing only on the default effect of the firm value (Boehmer et al., 2015) or the effect of CDS trading on firm value (Lepetit & Strobel, 2015; Lin et al., 2016; Tolikas & Topaloglou, 2017), however they disregard the Z-model (1993).
Portuguese Journal of Finance, Management and Accounting. ISSN: 2183-3826. Vol 4, Nº 8, September 2018
51
Due to the widespread of the Z-Score methodology namely the Z-Score of 1968 and due to its simplicity and applicability this model has a more wide use than the other models and later improvements (Lepetit & Strobel, 2015; Lin et al., 2016).
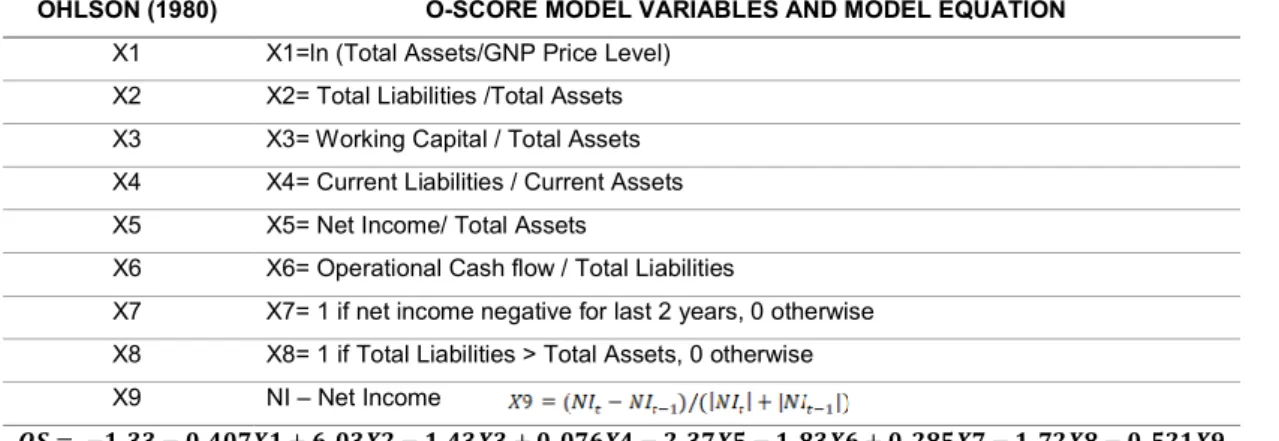
Despite including not only the ZMODEL and ZSCORE2 we also include in our regression tests the OSCORE which is the Ohlson (1980) O-score Model, based on the model described in the table below. We computed all the data of the entire sample like we did for the other models previously mentioned and assess the relevance of the OSCORE and its relation with the CDS Z-Score models and the O-score which was implied to have a similar performance between them (Lin et al., 2016). Figure 2 shows the variables considered by Ohlson (1980).
Fig 2 – O-Score Model developed by Ohlson
OHLSON (1980) O-SCORE MODEL VARIABLES AND MODEL EQUATION
X1 X1=ln (Total Assets/GNP Price Level)
X2 X2= Total Liabilities /Total Assets
X3 X3= Working Capital / Total Assets
X4 X4= Current Liabilities / Current Assets
X5 X5= Net Income/ Total Assets
X6 X6= Operational Cash flow / Total Liabilities
X7 X7= 1 if net income negative for last 2 years, 0 otherwise X8 X8= 1 if Total Liabilities > Total Assets, 0 otherwise
X9 NI – Net Income
𝑶𝑺 = −𝟏. 𝟑𝟑 − 𝟎. 𝟒𝟎𝟕𝑿𝟏 + 𝟔. 𝟎𝟑𝑿𝟐 − 𝟏. 𝟒𝟑𝑿𝟑 + 𝟎. 𝟎𝟕𝟔𝑿𝟒 − 𝟐. 𝟑𝟕𝑿𝟓 − 𝟏. 𝟖𝟑𝑿𝟔 + 𝟎. 𝟐𝟖𝟓𝑿𝟕 − 𝟏. 𝟕𝟐𝑿𝟖 − 𝟎. 𝟓𝟐𝟏𝑿𝟗
Portuguese Journal of Finance, Management and Accounting. ISSN: 2183-3826. Vol 4, Nº 8, September 2018
52
2.3.CDS Variables
The data gathered to build the explanatory variables retrieved from Bloomberg regards the period 2006 - 2016, being all annual data. We created three independent CDS variables.
The variable CDSPX represents the end-of-year quote for the CDS spread for each company in the sample, covering all the 10-year period. To measure the annual volatility, we created a variable named VOLACDS, which is the annualized daily volatility of the CDS market spread gathered from Bloomberg terminal. In order to assess the variation of the CDS premium and its behavior we gather daily CDS premium observations of each Year and calculated its natural logarithm for each company attaining in the end the annual logarithm of the CDS premium, here named as LOGCDS, which is the CDS Performance.
2.4. Control Variables
Regarding the control variables and using the methodology of Rim and Roy (2014) that used the financial ratios as control variables we apply the same logic in our paper and regarding both the Z-Score models from Altman(1968,1983,1993) and the O-score from Ohlson (1980).
With that for the Z-score models we constructed the following individual regression equations with the control variables:
(1) (2) (3) (4) (5) (6) (7) (8) (9)
Portuguese Journal of Finance, Management and Accounting. ISSN: 2183-3826. Vol 4, Nº 8, September 2018
53
Regarding the Olson O-score the regression equations the equations are the following:
(10) (11) (12)
Fig 3 – Model Variables
Source: Own elaboration (2018).
Regarding the assembly of the control variables of the models, all data was gathered from Bloomberg terminal, missing data was gathered from the companies’ financial statements and reports, with the exception of the GNP variable that was gathered from the Reuters Datastream.
Portuguese Journal of Finance, Management and Accounting. ISSN: 2183-3826. Vol 4, Nº 8, September 2018
54
3.CDS Market Overview
According to (van der Merwe, Andria, 2016) there is a false pretentions that the CDS market as contracted due to the use of the portfolios that might reduce some contract numbers due to portfolio compression eliminating redundant positions. This reduction is referring specially to the notional of the contract of CDS, however it is not being considered significant regarding the CDS index products (van der Merwe ,Andria, 2016).
The most popular types of contracts according to (van der Merwe ,Andria, 2016) are Single name CDS which are linked only to a reference entity , asset backed securities CDS which is a type of contract backed by an asset like commercial mortgages for instance and structured financed CDS which have a loan as a reference entity, this types of contracts are vastly and most commonly used and its popularity and use has not shown any decrease through time.(van der Merwe ,Andria, 2016)
For instance, in terms of numbers and according with BIS the regarding the notional amounts of the CDS contracts it has been a decrease from $61.2 trillion at end-2007 to $9.4 trillion 10 years later, however the shares investments regarding the great financial crisis have been risen in 2017 to 64% specially regarding CDS of credit events contracts.
Regarding the CDS market news worldwide, there have been a recent turmoil regarding the use of CDS contracts and derivatives. In the US, there were news that a trade conflict between a company (Hovnanian) that defaulted part of its debt allowing other company (GSO) that had a contract to profit from a separate credit derivative, offering a relative cheap financing to the other party. This is a form of loop hole that are becoming more and more frequent and that its use turns the CDS contract useless due to the fact that this loophole prevents the CDS pay-outs (“Blackstone, Solus Settle Fight Over Hovnanian CDS Trade,” 2018).
Deutsche Bank has been in a turmoil regarding its short sellers and increase of credit derivatives pilling on it, which signal doubt regarding the company future, even if they have capital reserves to ensure the doubt of investors, this movement on the behalf of
Portuguese Journal of Finance, Management and Accounting. ISSN: 2183-3826. Vol 4, Nº 8, September 2018
55
the investors is because DB bank mentioned on the US. Regulatory report as being one of the banks present in the regulatory watch list which indicates that the bank might have problems, this led to a decrease of the one level regarding its rating notation and an increase on the Bearish movements by the investors , meaning an increase in CDS contracts.(“Deutsche Bank’s Slow Bleed Continues as a Pivotal Month Begins,” 2018)
In other news political conflicts in Italy is driving chaos regarding the increase in credit risk , increase on CDS spread which has passed even countries considered as being junk rated by the investors such as Brazil, Turkey and South Africa, despite this Italy is still considered an investment country by the rating agencies even if its experiencing political and fiscal Risk. (“Italy Now Troubles Bond Investors More Than Crisis-Ridden Turkey,” 2018) this situation led to the pope mentioning that the CDS traders are a form of sinful contract that bet on the demise of others and profit on their default being considered by the Pope as being predatory specially regarding the investors who speculate on the derivatives market. However this view of the Pope is considered short sided due to the fact that the benefits of the CDS contracts and derivatives were not considered such us achieving lesser borrowing costs , and allowing countries to get credit that would be out of reach otherwise.(“Pope’s Beef With CDS Market Is a Beef With All Markets,” 2018)
4.Empirical Results and Hypothesis
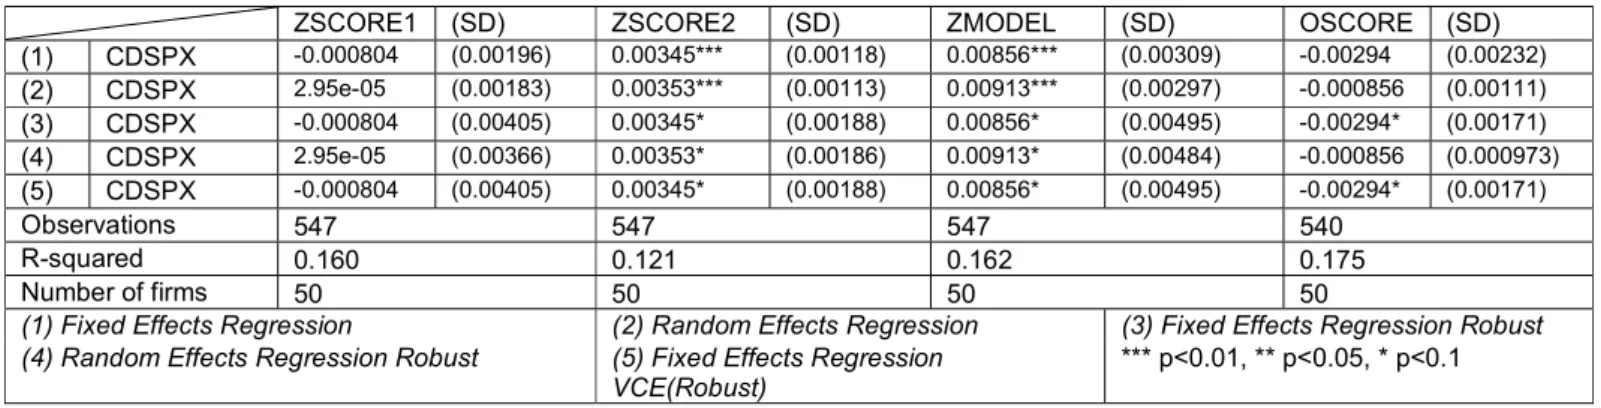
As described in the previous sections, both the CDS contracts and Altman Z-score models are related to Default Probability. We hypothesize that the Z-score models are negative correlated with the CDS price (CDSPX), as a higher Z-score represents a lower likelihood of default (E. Altman, 1968a; Rim & Roy, 2014) and, therefore, an increase in default probability will increase the risk associated and implying a negative correlation between them. Table 4 presents the OLS results and relationship between the selected credit models and the explanatory variable CDSPX.
Portuguese Journal of Finance, Management and Accounting. ISSN: 2183-3826. Vol 4, Nº 8, September 2018
56
VOLACDS represents the annual volatility of the CDS spread. We hypothesize a negative correlation with the models due to the relationship between risk and Z-score (E. Altman, 1968a; E. Altman & Rijken, 2010). Thus, a higher volatility represents a higher uncertainty and therefore a negative correlation between the models and the explanatory variable. Table 5 presents the OLS results between volatility and the selected credit model.
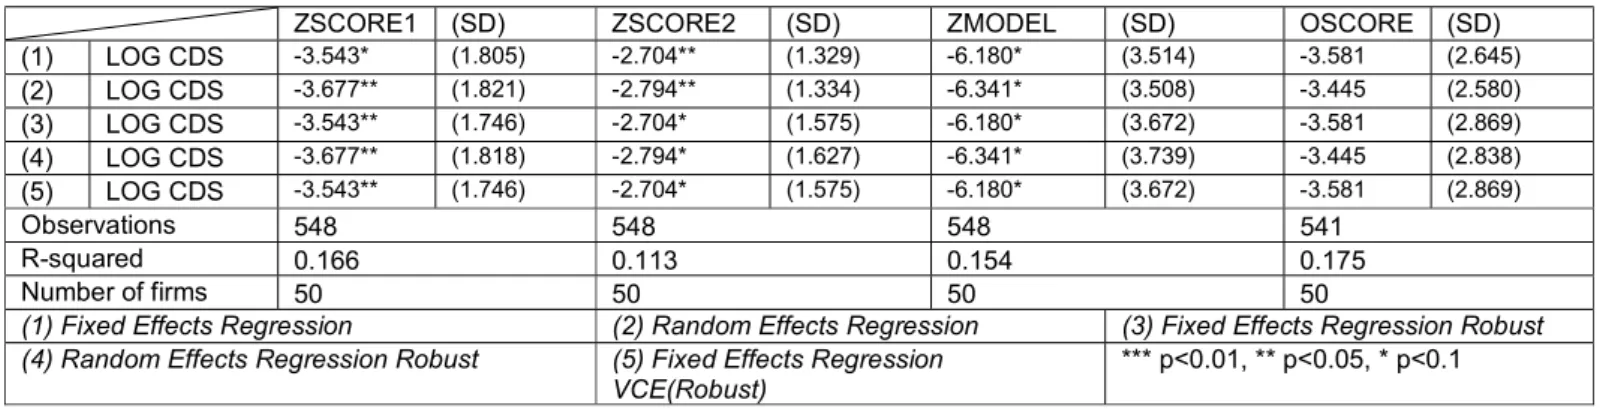
The CDS premium performance is represented by the LOGCDS which is the natural log function of the annualized daily CDS premium observations. It is hypothesized a negative correlation between the Z-score models (E. Altman, 1968a; E. Altman & Rijken, 2010) and the LOGCDS variable due to its connection between the risk and the variation of the default probability and how the Z-score is linked with the default probability (Hull 2015). Table 6 presents the OLS regression of the LOGCDS and the respective results.
To insure the robustness of the OLS regressions, we performed several tests regarding the heteroscedasticity and autocorrelation. The majority of the regressions presented significant results after controlling for all the major errors.
5.Conclusion
Credit Default Swaps have been in the center of the public eye since the 2007-2008 financial crisis. This crisis exposed the need for CDS regulation and more academic studies in order to help regulators, bondholders and all stakeholders. In this paper, we have provided new empirical evidence on CDS market in a European context. In contrast to other studies focused on other markets, we collected a sample of 50 European companies from eight different countries. Our findings suggest that CDS market volatility and CDS performance can improve the existent Z-Score Models. These models are still the most relevant for credit analysis and are often used as benchmarks for developing other models (E. I. Altman, Haldeman, & Narayanan, 1977a; Lepetit & Strobel, 2015; Lin et al., 2016; Rim & Roy, 2014).
Portuguese Journal of Finance, Management and Accounting. ISSN: 2183-3826. Vol 4, Nº 8, September 2018
57
Concerning the CDS price variable we find mixed result, using the Z-Score Models or the O-Score. Although further research is needed to fully explain this result, it is consistent with the view from Lepetit and Strobel (2015).
The Z-score is a tool to determinate and assess the default probability as a form of locating the likelihood of default in different zones (E. Altman, 1968a; E. I. Altman, Haldeman, & Narayanan, 1977b) and that might mean that it is not directly correlated with the probability of default . In the other hand, the O-score is a tool that provides the direct probability of default straight from its output (Ohlson, 1980). This might explain why the correlation between the CDS Premium and the O-SCORE has a negative signal, while has a positive sign with the Z-SCORE model and its variants. This interpretation is corroborated by the results found by Lepetit and Strobel (2015) which suggest a reinterpretation of the default probability attained from the Z-score methodology as an odd of insolvency instead.
Portuguese Journal of Finance, Management and Accounting. ISSN: 2183-3826. Vol 4, Nº 8, September 2018
58
6.References
Altman, E. (1968a, Setembro). Financial Ratios, Discriminant Analysis and the Prediction of Corporate Bankruptcy. The Journal of Finance, pp. 589–609.
Altman, E. (1968b, September). Financial Ratios, Discriminant Analysis and the Prediction of Corporate Bankruptcy. The Journal of Finance, pp. 589–609.
Altman, E. I. (1984). The success of business failure prediction models: An international survey. Journal of Banking & Finance, 8(2), 171–198. https://doi.org/10.1016/0378-4266(84)90003-7
Altman, E. I. (2005). An emerging market credit scoring system for corporate bonds. Emerging Markets Review, 6(4), 311–323. https://doi.org/10.1016/j.ememar.2005.09.007
Altman, E. I., Haldeman, R. G., & Narayanan, P. (1977a). ZETATM analysis A new model to identify bankruptcy risk of corporations. Journal of Banking & Finance, 1(1), 29– 54. https://doi.org/10.1016/0378-4266(77)90017-6
Altman, E. I., Haldeman, R. G., & Narayanan, P. (1977b). ZETATM analysis A new model to identify bankruptcy risk of corporations. Journal of Banking & Finance, 1(1), 29– 54. https://doi.org/10.1016/0378-4266(77)90017-6
Altman, E., & Rijken, H. A. (2010). The Z-MetricsTM Methodology For Estimating
Company.pdf. Risk Metrics Group. Retrieved from
https://www.researchgate.net/publication/215990971_The_Z-Metrics_Methodology_For_Estimating_Company_Credit_Ratings_And_Default_Risk_Pro babilities
Barboza, F., Kimura, H., & Altman, E. (2017). Machine learning models and bankruptcy prediction. Expert Systems with Applications, 83, 405–417. https://doi.org/10.1016/j.eswa.2017.04.006
Blackstone, Solus Settle Fight Over Hovnanian CDS Trade. (2018, May 30). Bloomberg.Com. Retrieved from https://www.bloomberg.com/news/articles/2018-05-30/hovnanian-pays-overdue-interest-on-bonds-within-grace-period
Portuguese Journal of Finance, Management and Accounting. ISSN: 2183-3826. Vol 4, Nº 8, September 2018
59
Boehmer, E., Chava, S., & Tookes, H. E. (2015). Related Securities and Equity Market Quality: The Case of CDS. Journal of Financial and Quantitative Analysis, 50(03), 509–541. https://doi.org/10.1017/S0022109015000241
Danis, A., & Gamba, A. (2018). The real effects of credit default swaps. Journal of Financial Economics, 127(1), 51–76. https://doi.org/10.1016/j.jfineco.2017.10.005
Deutsche Bank’s Slow Bleed Continues as a Pivotal Month Begins. (2018, June 2). Bloomberg.Com. Retrieved from https://www.bloomberg.com/news/articles/2018-06-02/deutsche-bank-s-slow-bleed-continues-as-a-pivotal-month-begins
Hernandez Tinoco, M., & Wilson, N. (2013). Financial distress and bankruptcy prediction among listed companies using accounting, market and macroeconomic variables. International Review of Financial Analysis, 30, 394–419. https://doi.org/10.1016/j.irfa.2013.02.013
Hull, J. (2015). Options, futures, and other derivatives (Ninth edition). Boston: Pearson.
Italy Now Troubles Bond Investors More Than Crisis-Ridden Turkey. (2018, May 29). Bloomberg.Com. Retrieved from https://www.bloomberg.com/news/articles/2018-05-29/italy-now-troubles-bond-investors-more-than-crisis-ridden-turkey
L. Culp,Christopher, & van der Merwe ,Andria. (2016). Single-name Credit Default Swaps: A Review of the Empirical Academic Literature. Johns Hopkins Institute for Applied Economics, AF/No.11/September 2016. Retrieved from https://www.isda.org/a/KSiDE/single-name-cds-literature-review-culp-van-der-merwe-staerkle-isda.pdf
Lepetit, L., & Strobel, F. (2015). Bank insolvency risk and Z-score measures: A
refinement. Finance Research Letters, 13, 214–224.
https://doi.org/10.1016/j.frl.2015.01.001
Lin, H.-W. W., Lo, H.-C., & Wu, R.-S. (2016). Modeling default prediction with earnings management. Pacific-Basin Finance Journal, 40, 306–322. https://doi.org/10.1016/j.pacfin.2016.01.005
Portuguese Journal of Finance, Management and Accounting. ISSN: 2183-3826. Vol 4, Nº 8, September 2018
60
Liu, J., & Zhong, R. (2017). Political uncertainty and a firm’s credit risk: Evidence from the international CDS market. Journal of Financial Stability, 30, 53–66. https://doi.org/10.1016/j.jfs.2017.03.006
Liu, L., Zhang, G., & Fang, Y. (2016). Bank credit default swaps and deposit insurance around the world. Journal of International Money and Finance, 69, 339–363. https://doi.org/10.1016/j.jimonfin.2016.06.017
Ohlson, J. A. (1980). Financial Ratios and the Probabilistic Prediction of Bankruptcy. Journal of Accounting Research, 18(1), 109–131. https://doi.org/10.2307/2490395
Pope’s Beef With CDS Market Is a Beef With All Markets. (2018, May 18). Bloomberg.Com. Retrieved from https://www.bloomberg.com/view/articles/2018-05-18/pope-s-cds-criticism-could-apply-to-all-markets
Reisz, A. S., & Perlich, C. (2007). A market-based framework for bankruptcy prediction. Journal of Financial Stability, 3(2), 85–131. https://doi.org/10.1016/j.jfs.2007.02.001
Rim, E. K., & Roy, A. B. (2014). Classifying Manufacturing Firms in Lebanon: An Application of Altman’s Model. Procedia - Social and Behavioral Sciences, 109, 11–18. https://doi.org/10.1016/j.sbspro.2013.12.413
Saretto, A., & Tookes, H. E. (2013). Corporate Leverage, Debt Maturity, and Credit Supply: The Role of Credit Default Swaps. Review of Financial Studies, 26(5), 1190–1247. https://doi.org/10.1093/rfs/hht007
Saunders, A., & Cornett, M. M. (2008). Financial institutions management: a risk management approach (6th ed). Boston: McGraw-Hill Irwin.
Subrahmanyam, M. G., Tang, D. Y., & Wang, S. Q. (2014). Does the Tail Wag the Dog?: The Effect of Credit Default Swaps on Credit Risk. Review of Financial Studies, 27(10), 2927–2960. https://doi.org/10.1093/rfs/hhu038
Tian, S., & Yu, Y. (2017). Financial ratios and bankruptcy predictions: An international evidence. International Review of Economics & Finance, 51, 510–526. https://doi.org/10.1016/j.iref.2017.07.025
Tolikas, K., & Topaloglou, N. (2017). Is default risk priced equally fast in the credit default swap and the stock markets? AN empirical investigation. Journal of International
Portuguese Journal of Finance, Management and Accounting. ISSN: 2183-3826. Vol 4, Nº 8, September 2018
61
Financial Markets, Institutions and Money, 51, 39–57. https://doi.org/10.1016/j.intfin.2017.09.029
How to cite this article:
Barreto, F.S.C., & Sacadura, J.N.T. (2018). How does credit default swap volatility influence the Z-Score Models? Portuguese Journal of Finance, Management and Accounting. 4 (8), 46-68. Disponível em http://u3isjournal.isvouga.pt/index.php/PJFMA
Portuguese Journal of Finance, Management and Accounting. ISSN: 2183-3826. Vol 4, Nº 8, September 2018
62
TABLE 1 - Sample Description
Description of the sample including period of analysis, country of origin and industry sector of activities. All data from this table was collected from the Bloomberg terminal and all companies here refenced were quoted in the Eurostoxx50 during the period of analysis:
Name Industry sector Country Period
ADIDAS Personal & Household Goods DE 2006-2016
AHOLD DELHAIZE Retail NL 2006-2016
AIR LIQUIDE Chemicals FR 2006-2016
AIRBUS Industrial Goods & Services FR 2006-2016
ALLIANZ Insurance DE 2006-2016
ANHEUSER-BUSCH INBEV Food & Beverage BE 2006-2016
ASML HLDG Technology NL 2006-2016
AXA Insurance FR 2006-2016
BASF Chemicals DE 2006-2016
BAYER Health Care DE 2006-2016
BBVA Banks ES 2006-2016
BCO SANTANDER Banks ES 2006-2016
BMW Automobiles & Parts DE 2006-2016
BNP PARIBAS Banks FR 2006-2016
CRH Construction & Materials IE 2006-2016
DAIMLER Automobiles & Parts DE 2006-2016
DANONE Food & Beverage FR 2006-2016
DEUTSCHE BANK Banks DE 2006-2016
DEUTSCHE POST Industrial Goods & Services DE 2006-2016
DEUTSCHE TELEKOM Telecommunications DE 2006-2016
E.ON Utilities DE 2006-2016
ENEL Utilities IT 2006-2016
ENGIE Utilities FR 2006-2016
ENI Oil & Gas IT 2006-2016
ESSILOR INTERNATIONAL Health Care FR 2006-2016
FRESENIUS Health Care DE 2006-2016
GRP SOCIETE GENERALE Banks FR 2006-2016
IBERDROLA Utilities ES 2006-2016
INDUSTRIA DE DISENO TEXTIL Retail ES 2006-2016
ING GRP Banks NL 2006-2016
INTESA SANPAOLO Banks IT 2006-2016
L'OREAL Personal & Household Goods FR 2006-2016
LVMH MOET HENNESSY Personal & Household Goods FR 2006-2016
MUENCHENER RUECK Insurance DE 2006-2016
NOKIA Technology FI 2006-2016
ORANGE Telecommunications FR 2006-2016
PHILIPS Health Care NL 2006-2016
SAFRAN Industrial Goods & Services FR 2006-2016
SAINT GOBAIN Construction & Materials FR 2006-2016
SANOFI Health Care FR 2006-2016
Portuguese Journal of Finance, Management and Accounting. ISSN: 2183-3826. Vol 4, Nº 8, September 2018
63
SCHNEIDER ELECTRIC Industrial Goods & Services FR 2006-2016
SIEMENS Industrial Goods & Services DE 2006-2016
TELEFONICA Telecommunications ES 2006-2016
TOTAL Oil & Gas FR 2006-2016
UNIBAIL-RODAMCO Real Estate FR 2006-2016
UNILEVER NV Personal & Household Goods NL 2006-2016
VINCI Construction & Materials FR 2006-2016
VIVENDI Media FR 2006-2016
VOLKSWAGEN PREF Automobiles & Parts DE 2006-2016
Portuguese Journal of Finance, Management and Accounting. ISSN: 2183-3826. Vol 4, Nº 8, September 2018
64
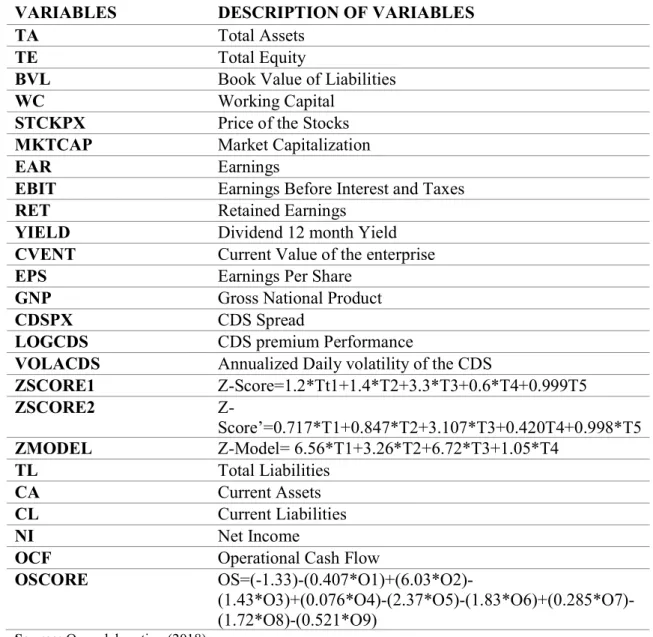
TABLE 2 - Variable Description
This table presents the description of the variables taking into consideration in this paper and their respective abbreviations:
VARIABLES DESCRIPTION OF VARIABLES
TA Total Assets
TE Total Equity
BVL Book Value of Liabilities
WC Working Capital
STCKPX Price of the Stocks
MKTCAP Market Capitalization
EAR Earnings
EBIT Earnings Before Interest and Taxes
RET Retained Earnings
YIELD Dividend 12 month Yield
CVENT Current Value of the enterprise
EPS Earnings Per Share
GNP Gross National Product
CDSPX CDS Spread
LOGCDS CDS premium Performance
VOLACDS Annualized Daily volatility of the CDS
ZSCORE1 Z-Score=1.2*Tt1+1.4*T2+3.3*T3+0.6*T4+0.999T5 ZSCORE2 Z-Score’=0.717*T1+0.847*T2+3.107*T3+0.420T4+0.998*T5 ZMODEL Z-Model= 6.56*T1+3.26*T2+6.72*T3+1.05*T4 TL Total Liabilities CA Current Assets CL Current Liabilities NI Net Income
OCF Operational Cash Flow
OSCORE
OS=(-1.33)-(0.407*O1)+(6.03*O2)- (1.43*O3)+(0.076*O4)-(2.37*O5)-(1.83*O6)+(0.285*O7)-(1.72*O8)-(0.521*O9)
Portuguese Journal of Finance, Management and Accounting. ISSN: 2183-3826. Vol 4, Nº 8, September 2018
65
TABLE 3 - Sample Statistics
Presents all the general statistics employed in the variables used to explain and control de ZSCORE1, ZSCORE2, ZMODEL and OSCORE:
Stats Mean P50 Sd N Range Min Max Skewness Kurtosis
WC 13493.49 1839.55 107885.8 550 1755679 -644881 1110798 2.258715 30.72812 TA 239980.9 71097.5 434242.8 550 2201963 459.559 2202423 2.698537 9.910437 TE 28746.64 22156 22441.64 550 105073.1 146.896 105220 1.026423 3.505617 TL 211234.4 43276.25 419887.9 550 2170223 286.357 2170509 2.759739 10.23935 NI 2769.627 2304 2980.375 550 30910 -9198 21712 0.61346 8.03975 CL 79718.21 16980 190047.2 547 1376476 175.782 1376652 3.804021 17.92993 CA 93619.01 18254.17 199766.7 545 1658162 309.576 1658472 3.814744 21.25171 RET 13611.76 10924 14622.86 550 110824 -38944 71880 0.827147 5.722852 EBIT 4663.707 3647 4295.797 550 32319 -6663 25656 1.456571 6.851678 MKTCAP 42482.02 35403.83 27923.3 549 193921.7 511.9963 194433.7 1.231677 5.558138 BVL 211234.4 43276.25 419887.9 550 2170223 286.357 2170509 2.759739 10.23935 GNP 1909549 2106703 811848.1 549 3057270 139922 3197192 -0.55127 2.348209 OCF 7253.973 4327 12781.75 549 180435 -46972 133463 3.264048 28.86058 EAR 46695.22 39142 37184.05 550 216760.8 506.222 217267 1.468122 5.835909 CDSPX 46.28446 33.2845 41.22155 548 243.467 1.283 244.75 1.618701 5.938159 LOGCDS -0.000038 -0.00049 0.01607 549 0.130976 -0.06448 0.0665 0.033388 5.003518 VOLDCDS 30.75834 27.2075 11.93122 540 64.208 13.875 78.083 1.281262 4.389221
Portuguese Journal of Finance, Management and Accounting. ISSN: 2183-3826. Vol 4, Nº 8, September 2018
66
TABLE 4 - OLS Regressions between Z-Score Models and CDS Spread
Presents the results of the individual regressions of the CDS SPREAD variable regarding the ZSCORE1, ZSCORE2, ZMODEL and O-SCORE:
Source: Own elaboration (2018).
ZSCORE1 (SD) ZSCORE2 (SD) ZMODEL (SD) OSCORE (SD) (1) CDSPX -0.000804 (0.00196) 0.00345*** (0.00118) 0.00856*** (0.00309) -0.00294 (0.00232) (2) CDSPX 2.95e-05 (0.00183) 0.00353*** (0.00113) 0.00913*** (0.00297) -0.000856 (0.00111) (3) CDSPX -0.000804 (0.00405) 0.00345* (0.00188) 0.00856* (0.00495) -0.00294* (0.00171) (4) CDSPX 2.95e-05 (0.00366) 0.00353* (0.00186) 0.00913* (0.00484) -0.000856 (0.000973) (5) CDSPX -0.000804 (0.00405) 0.00345* (0.00188) 0.00856* (0.00495) -0.00294* (0.00171) Observations 547 547 547 540 R-squared 0.160 0.121 0.162 0.175 Number of firms 50 50 50 50
(1) Fixed Effects Regression (2) Random Effects Regression (3) Fixed Effects Regression Robust (4) Random Effects Regression Robust (5) Fixed Effects Regression
Portuguese Journal of Finance, Management and Accounting. ISSN: 2183-3826. Vol 4, Nº 8, September 2018
67
TABLE 5 - OLS Regressions between Z-Score Models and CDS Volatility Presents the results of the individual regressions of the CDS VOLATILITY variable regarding the ZSCORE1, ZSCORE2, ZMODEL and O-SCORE:
Source: Own elaboration (2018).
ZSCORE1 (SD) ZSCORE2 (SD) ZMODEL (SD) OSCORE (SD) (1) VOLACDS -0.000276 (0.000171) -0.000397*** (0.000120) -0.000897*** (0.000319) -2.78e-05 (0.000247) (2) VOLACDS -0.000301* (0.000172) -0.000419*** (0.000120) -0.000939*** (0.000318) 0.000133 (0.000219) (3) VOLACDS -0.000276* (0.000161) -0.000397*** (0.000108) -0.000897*** (0.000297) -2.78e-05 (0.000203) (4) VOLACDS -0.000301* (0.000157) -0.000419*** (0.000111) -0.000939*** (0.000301) 0.000133 (0.000162) (5) VOLACDS -0.000276* (0.000161) -0.000397*** (0.000108) -0.000897*** (0.000297) -2.78e-05 (0.000203) Observations 549 549 549 542 R-squared 0.164 0.125 0.162 0.171 Number of firms 50 50 50 50
1) Fixed Effects Regression (2) Random Effects Regression (3) Fixed Effects Regression Robust (4) Random Effects Regression Robust (5) Fixed Effects Regression
VCE(Robust)
Portuguese Journal of Finance, Management and Accounting. ISSN: 2183-3826. Vol 4, Nº 8, September 2018
68
TABLE 6 - OLS Regressions between Z-Score Models and CDS Performance Presents the results of the individual regressions of the CDS PERFORMANCE variable regarding the ZSCORE1, ZSCORE2, ZMODEL and O-SCORE:
Source: Own elaboration (2018).
ZSCORE1 (SD) ZSCORE2 (SD) ZMODEL (SD) OSCORE (SD) (1) LOG CDS -3.543* (1.805) -2.704** (1.329) -6.180* (3.514) -3.581 (2.645) (2) LOG CDS -3.677** (1.821) -2.794** (1.334) -6.341* (3.508) -3.445 (2.580) (3) LOG CDS -3.543** (1.746) -2.704* (1.575) -6.180* (3.672) -3.581 (2.869) (4) LOG CDS -3.677** (1.818) -2.794* (1.627) -6.341* (3.739) -3.445 (2.838) (5) LOG CDS -3.543** (1.746) -2.704* (1.575) -6.180* (3.672) -3.581 (2.869) Observations 548 548 548 541 R-squared 0.166 0.113 0.154 0.175 Number of firms 50 50 50 50
(1) Fixed Effects Regression (2) Random Effects Regression (3) Fixed Effects Regression Robust (4) Random Effects Regression Robust (5) Fixed Effects Regression